1. Introduction
The growing need for precise real-time location information, in combination with the evolution of global navigation satellite systems (GNSS) technology, which is bringing it closer to significantly more users, means that today's GNSS demand is bigger than ever in market segments such as location-based services, transport, aviation, maritime navigation, agriculture, surveying, timing and synchronisation and monitoring of critical infrastructures (European GNSS Agency, 2019). Currently, precise real-time GNSS services and solutions rely on the precise point positioning (PPP) technique or differential GNSS networks (RTK).
Real-time PPP performs precise positioning using just a single receiver (Zumberge et al., Reference Zumberge, Heflin, Jefferson, Watkins and Webb1997; Kouba and Héroux, Reference Kouba and Héroux2001; Dow et al., Reference Dow, Neilan and Rizos2009). It consists of solving the position using continuous streams of state space representation products, which contain clock and orbital corrections, signal biases and signal propagation models computed by analysis centres and international GNSS services (Hadas and Bosy, Reference Hadas and Bosy2014). In real-time PPP (RT-PPP), continuous streams of state space representation products are needed, and they must meet the highest level of availability. Product outliers, fluctuations in the satellite constellation and latency can sometimes degrade the performance of RT-PPP (Martín et al., Reference Martín, Hadas, Dimas, Anquela and Berne2015; Capilla et al., Reference Capilla, Berné, Martín and Rodrigo2016). Additionally, the standardisation of all state space representation products is still in its final stage (Wübbena et al., Reference Wübbena, Wübbena, Wübbena and Schmitz2017).
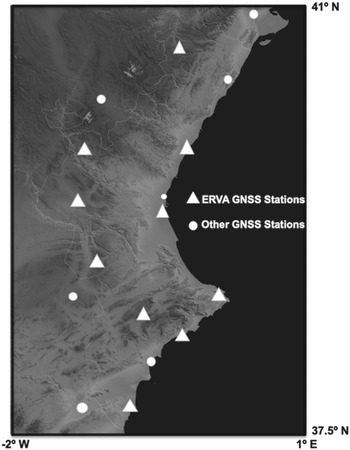
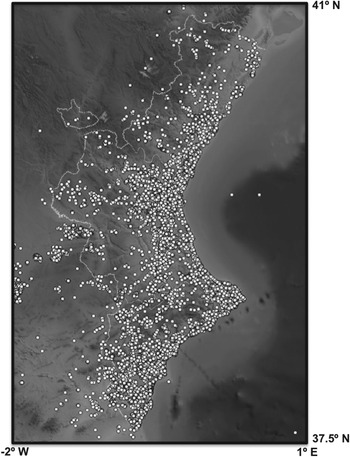
Differential positioning uses the double-differences solution and needs at least a network of reference stations or a reference station near the user (Hofmann-Wellenhof et al., Reference Hofmann-Wellenhof, Lichtenegger and Wasle2008). When the position of the user of the differential services (rover) is computed using the GNSS data that are processed in a regional or local GNSS network, an optimal reliability and accuracy of the rover position can be achieved. In this case, the rover can choose between two different services or mountpoints: the network RTK solution (bi-directional communications between the rover and the network) or single reference station corrections (uni-directional streaming corrections). In this case study, the services provided by the GNSS control centre and servers of the reference station network of Valencia have been analysed. This network is on the east coast of Spain, and it is known as the ERVA Network, with an effective area of 25,000 km2. The network has been active since 2005; it has 10 stations administrated by the Cartographic Institute of Valencia and additional stations shared by other institutions, (Capilla et al., Reference Capilla, Martín, Anquela and Berné2013), as shown in Figure 1.
GNSS ERVA Network and other surrounding stations

The main features and components of a server-based service for RTK corrections for navigation and positioning are the following: a cluster of continuously tracking GNSS reference stations, permanent communications between the stations and a GNSS data centre and, finally, the algorithms and packages for real-time processing in the central servers. In the central servers of the ERVA Network, several database solutions and XML standard-based formats are usually used in order to record real-time connections for the users. NMEA-GGA (National Marine Electronics Association-Global Positioning System Fix Data) position messages are also known when the rover connects to the GNSS network solution, such as the virtual reference station algorithm or the master auxiliary concept technique.
A huge volume of information and reports are generated in the central servers as a result of the connections of users for navigation and positioning applications. Nearly 180,000 min of connections of rovers using RTK services can be registered in the database during a month. Additionally, rover connections can usually generate more than 200,000 records or connections every month in different files. The stored data from the connections are the time-span or number of epochs, the transferred bytes, the quality of the fixed solution and float position, the mountpoint service, the time of the initial connection, the approximate initial rover position or trajectory with received NMEA-GGA information.
In order to obtain the statistics and analysis on the use of real-time differential corrections for navigation and positioning purposes, and to manage this huge volume of data, a big data architecture has been implemented for the automatic storage, processing and data analysis.
Some of the advantages of big data with respect to a traditional centralised architecture, according to some of Aggarwal's ideas (Aggarwal, Reference Aggarwal2016), are related, first of all, with the concept that complex problems based on large datasets could not be solved by using a single computer and centralised database architecture, because it is costly and ineffective. Big data architecture can be used instead, because it is based on dividing a large dataset into several small pieces. These small pieces can be distributed into a network computer cluster and, finally, the cluster can be used to perform analysis optimally in parallel by communication among the computers (Sun et al., Reference Sun, Yan and Zhang2014). Big data architecture provides better computing and lower price and improves the performance compared with centralised database architecture. Secondly, a dynamic schema for data storage is used in big data architecture. It means that the data are stored in their raw format, preserving the original information, and the schema is applied only when the data are to be read. The traditional database is based on a static fixed schema (Hu et al., Reference Hu, Wen, Chua and Li2014), where data cannot be changed once they are stored and this is only done during write operations. This is a very interesting point because GNSS real-time positions are continuously updated, thus new and old records, data and parameters should co-exist in the same database. Finally, a traditional database system requires expensive and complex software and hardware in order to manage large datasets. Meanwhile, in the case of big data, since the massive amounts of data are partitioned and distributed among various computers, open source software and commodity hardware can be used to process the data.
As a final step in the research, data mining algorithms (Duda et al., Reference Duda, Hart and Stork2012; Ryza et al., Reference Ryza, Laserson, Owen and Wills2017) can be used to better understand the users and trends in different business markets, their behaviours and the evolution of the related markets such as agriculture or civil engineering (every ERVA user is labelled with a related market).
In addition, the concept of the correlation between results is demonstrated in the paper. A previous example of the correlation between regional positioning services and other variables, such as economic activity indicators, can be found in Páez et al. (Reference Páez, Torrecillas, Barbero and Berrocoso2016). Therefore, the main novelties of this paper are the introduction of a big data architecture to store and analyse GNSS real-time connections and locations and the use of data mining algorithms to extract knowledge about the dynamic variations of the market sectors with a large dataset.
After the description of the context and the presentation of the purpose of the paper in the present Section 1, in Section 2 the basis for the big data architecture is explained in detail, which deals with the storage and processing software tools. Section 3 is the most important section from a research point of view, in that section all the data mining processes and results are explained in detail. A conclusion section ends the paper.
2. Big data architecture
As the input for the architecture, the network service for real-time positioning generates huge volumes of data, such as a database file with more than 100,000 records every month. This file contains user connections to the network solution or to a reference station, and every connection generates a row with the date, time, IP direction, time-span, observation interval, size in bites of the sent data information for precise positioning, number of epochs, user identification containing the market sector and connected station or network connection. The service also generates an XML format file every day with more than 1,000 parameters of the rover navigation session. This file contains the user coordinates, date, time and user identification containing the market sector of every connection. These data are previously filtered in order to detect wrong or invalid connections to the service.
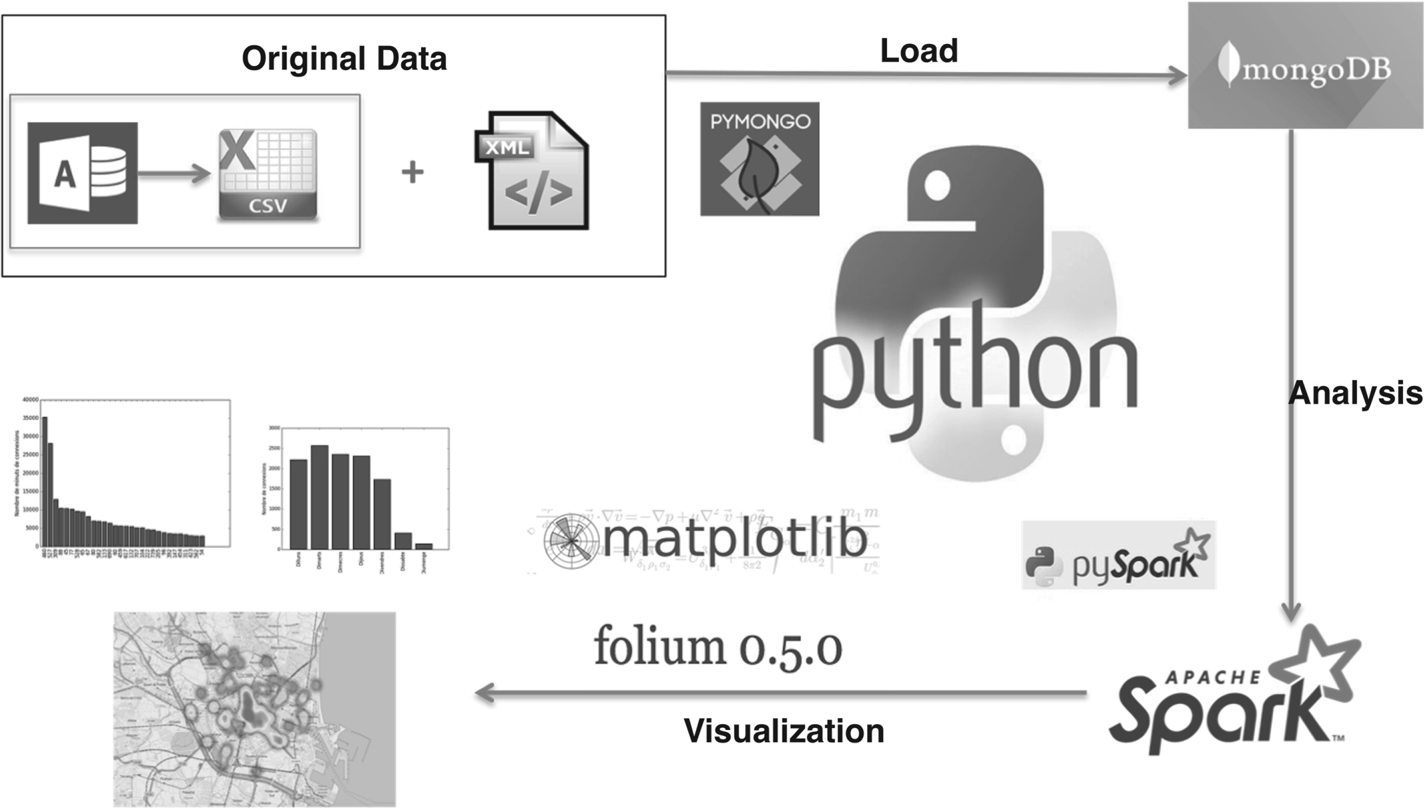
The main core of the architecture is the Python software program, which is shown in Figure 2. It also represents the developed architecture with the input files until the output results of the analysis.
Big data architecture

The first task is to read the database recorded information by the monitoring software of the network with a plug-in or script, and to join it with the XML files and the rest of the log files. In the second task, it is necessary to load the joint result into a NoSQL database, which is the basis for the data storage in the big data architecture. MongoDB NoSQL database is used for data storage, which provides scalability, flexibility and adaptability (Chodorow, Reference Chodorow2013). MongoDB is a document-oriented open source database which stores the data in documents of type JSON with a dynamic schema called BSON.
This database system does not require a schema, which allows the data to be flexible. PyMongo driver can be used to access and consult MongoDB inside the Python software code, which makes MongoDB a notably easy-to-use and versatile database. This property was the main reason for the choice of MongoDB as this research's database. Therefore, this first task (read Access and XML files, join them, generate a document for every connection with the joined data and load them into MongoDB) can be done directly using the Python software to read the original files without intermediate files or formats. Finally, nearly one million documents are loaded in the database every year.
The state-of-the-art industrial standard for big data processing is the MapReduce model (Dean and Ghemawat, Reference Dean and Ghemawat2008). MapReduce is mostly implemented in the frameworks of Apache-Hadoop (Murthy et al., Reference Murthy, Douglas, Konar, O'Malley, Radia and Agarwal2011) and Apache-Spark (Zaharia et al., Reference Zaharia, Chowdhury, Das, Dave, Ma, McCauley, Franklin, Shenker and Stoica2012). Apache-Hadoop is an open source, highly fault-tolerant software framework that can be used to manage big data files. This framework implements both the Hadoop Distributed File System (HDFS), which is derived from the Google File System (GFS) (Ghemawat et al., Reference Ghemawat, Gobioff and Leung2003) and the MapReduce computational paradigm.
Similar to Apache-Hadoop, Apache-Spark supports the MapReduce computational paradigm, developing the concept of a resilient distributed dataset (RDD), which is a read-only dataset that is partitioned across multiple computers. RDDs can be cached in memory and can be reused in multiple Spark MapReduce operations (in comparison with Apache-Hadoop, which writes all intermediate results to HDFS in the hard disks), this approach results in significant performance improvements, especially in the reduction of computational time. Python language can be used to develop Apache-Spark applications, which makes it the ideal framework for this research. Consequently, all of the processing tasks, which consist of joining the original data, storage in MongoDB and analysis continuously in real time, occur in Python language.
Therefore, the second task is to generate the appropriate Python software to query the MongoDB database through the PyMongo library and import the result of the query as an RDD file into the Apache-Spark framework for data mining (using MLlib Apache-Spark library) and analysis. In this process, the Apache-Spark Python modules and the spark-submit command were important tools. The output of this task should be viewed through the corresponding tables, figures and maps, where the Matplotlib and Folium Python libraries are used. All the output data analysis visualisation has been coded using the same Python software, and thus there is only one computer program to query, analyse and visualise the data stored in MongoDB.
The query can be done using a temporal window (from 1 January 2016 to 31 December 2016, for example), concrete mountpoints, users, markets or a combination of them (for example, agricultural users in a specific month each day from 10:00 p.m. to 10:00 a.m.).
3. Data mining
3.1 MapReduce transformations
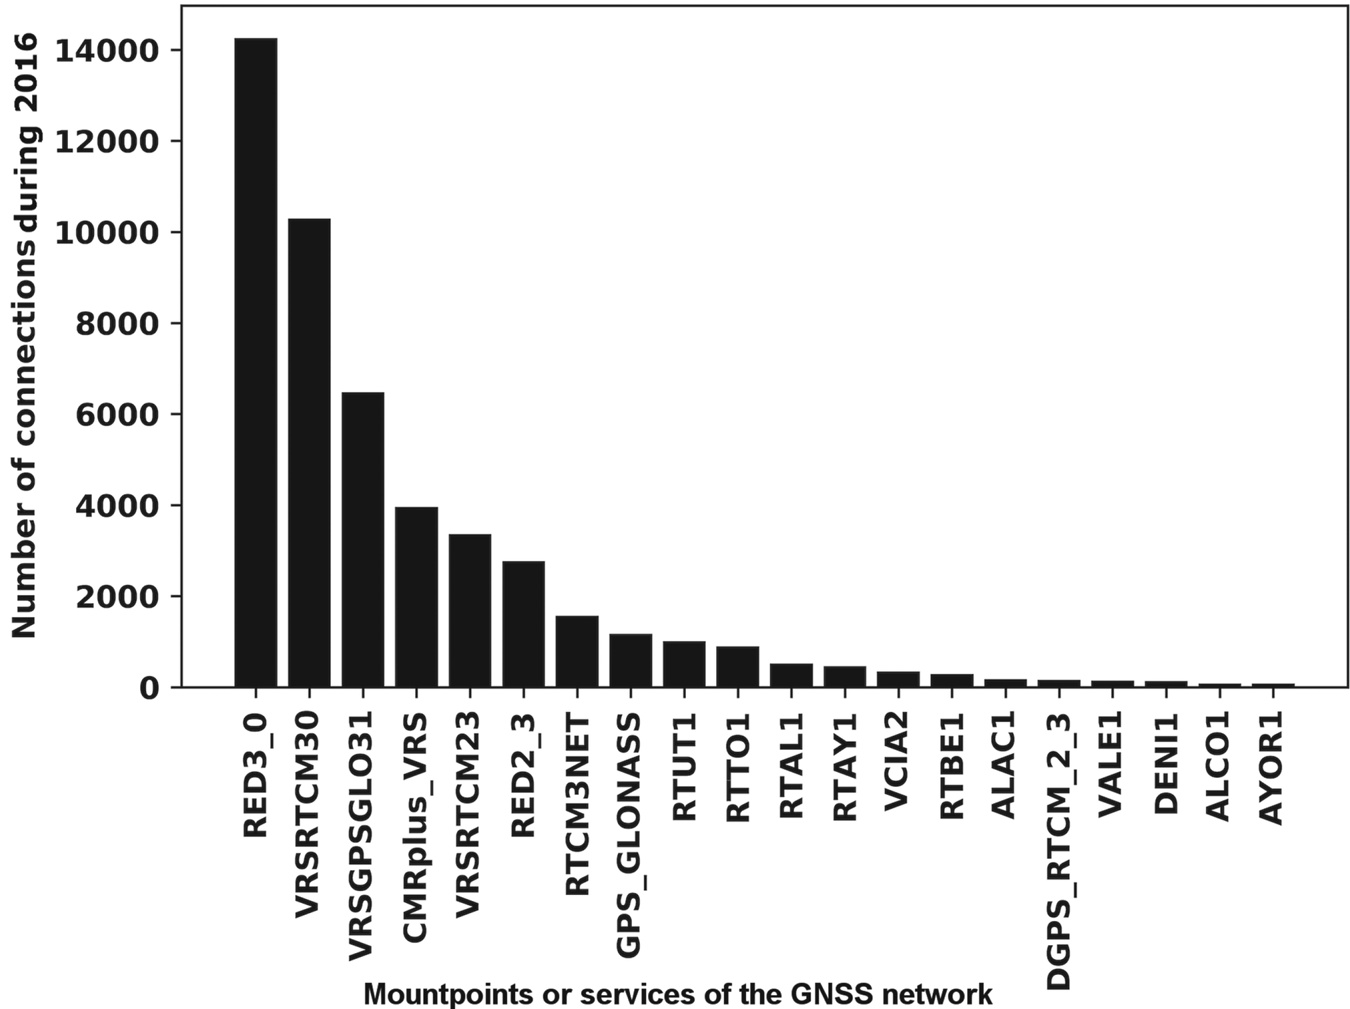
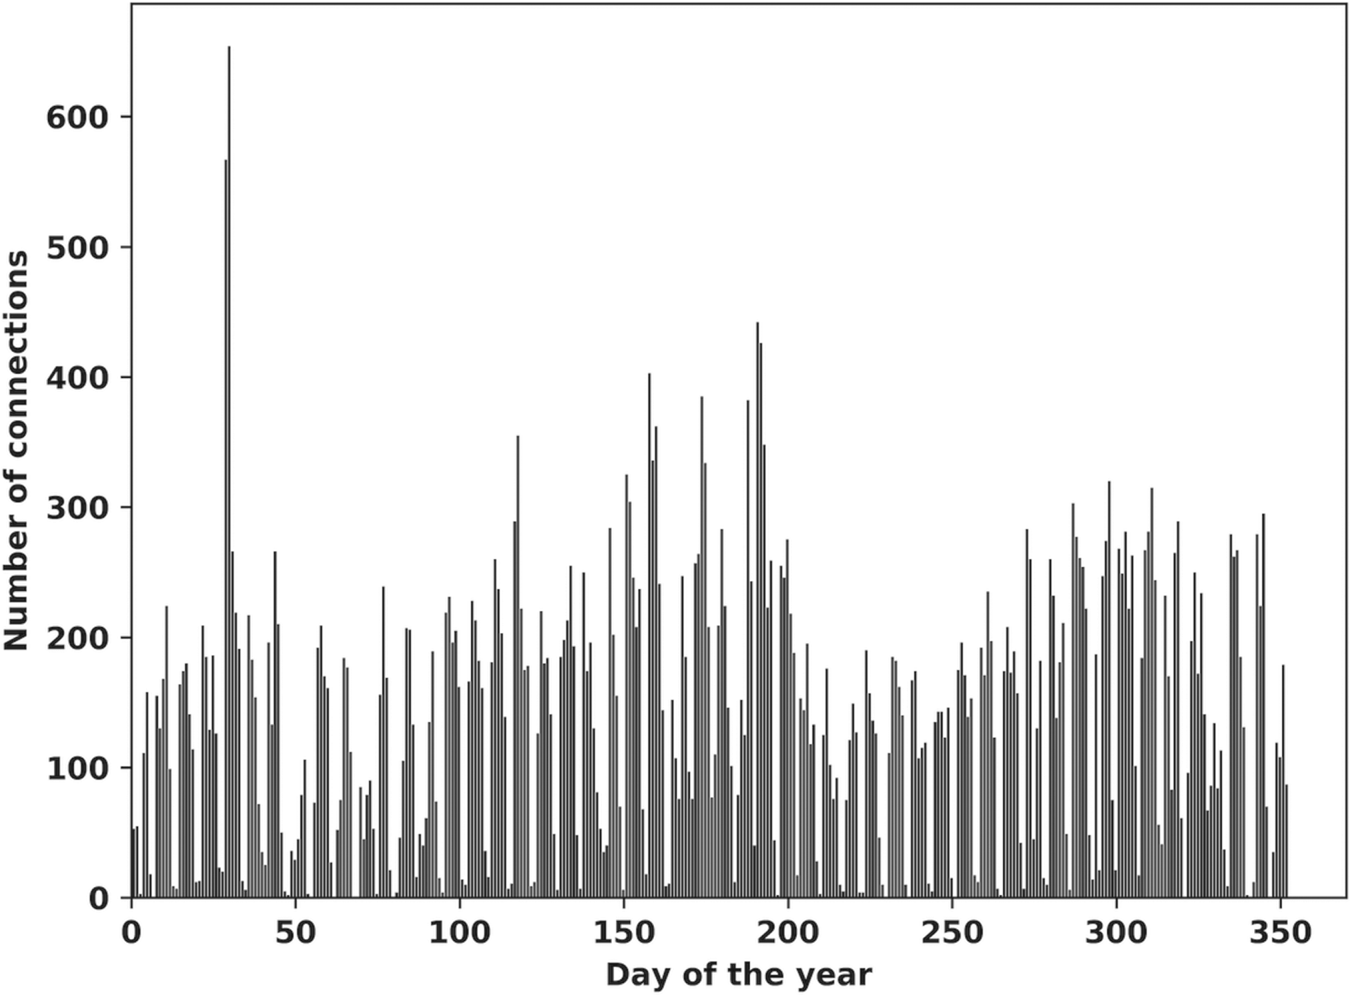
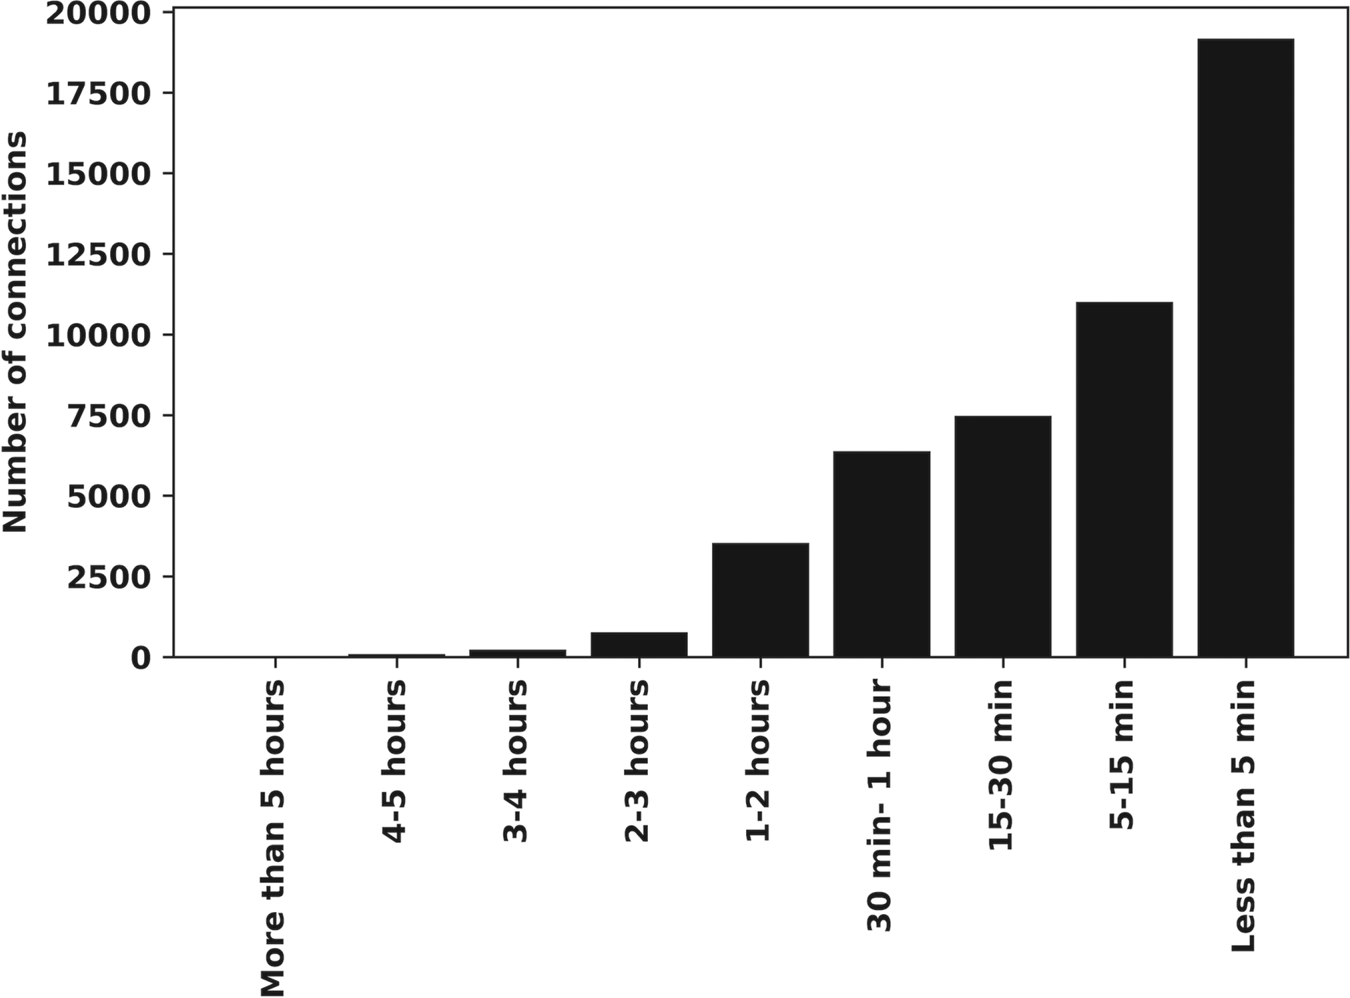
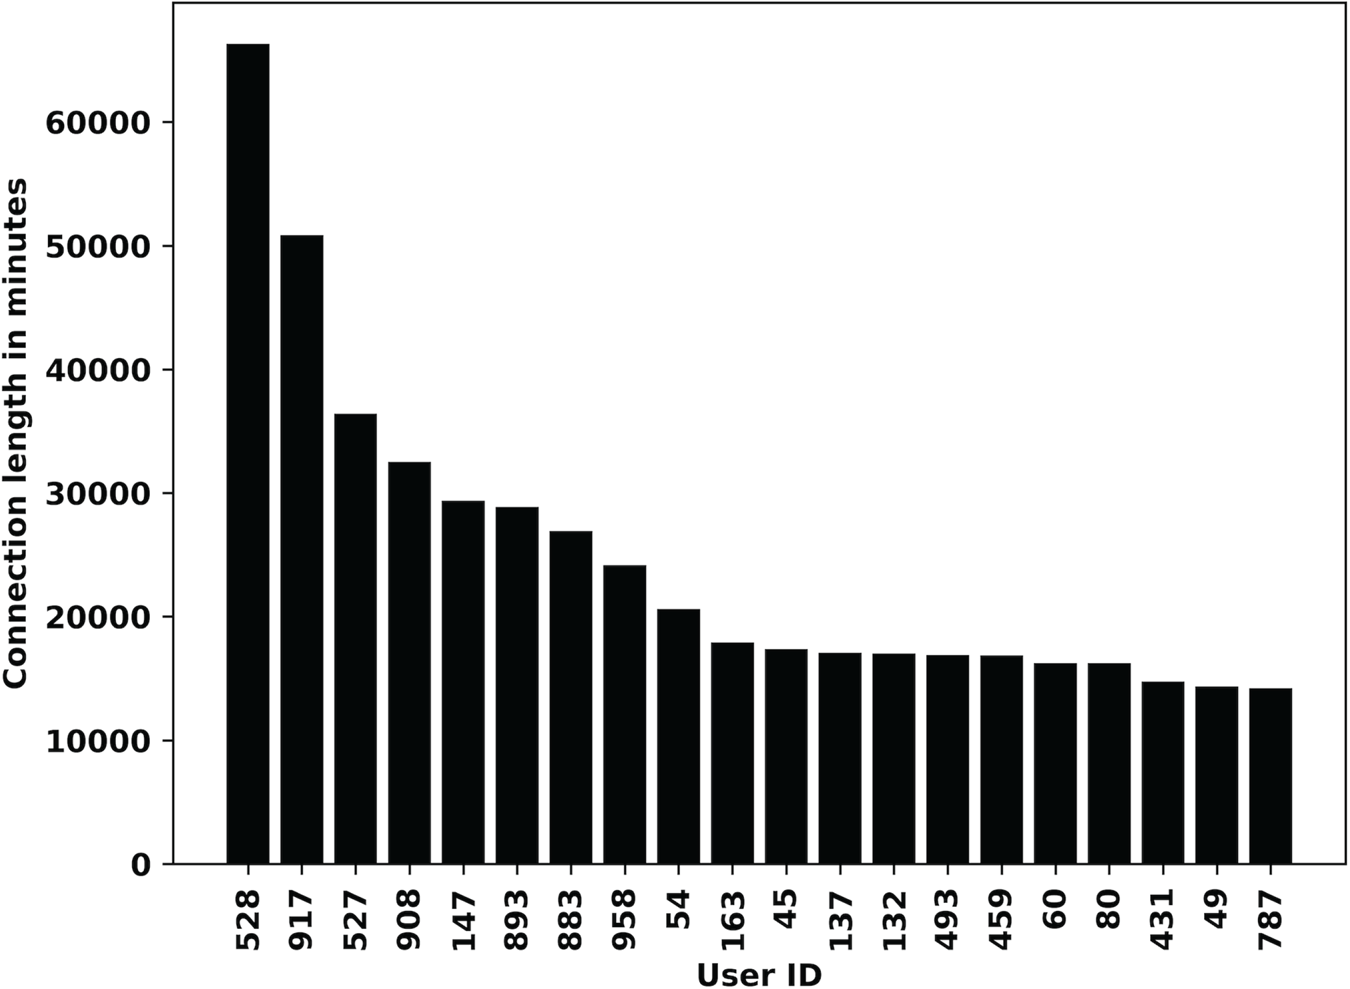
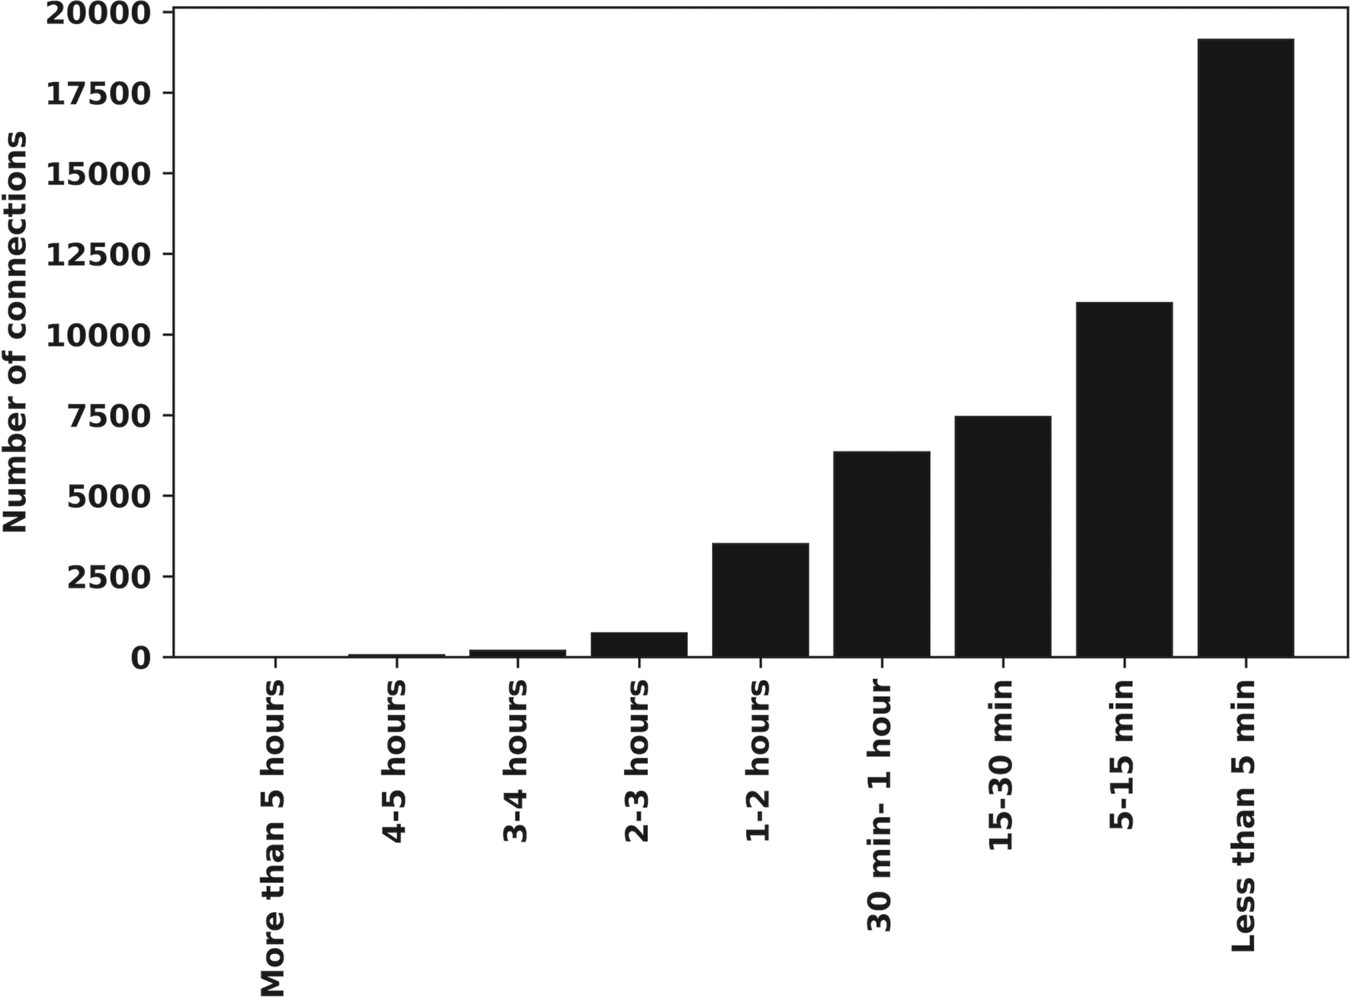
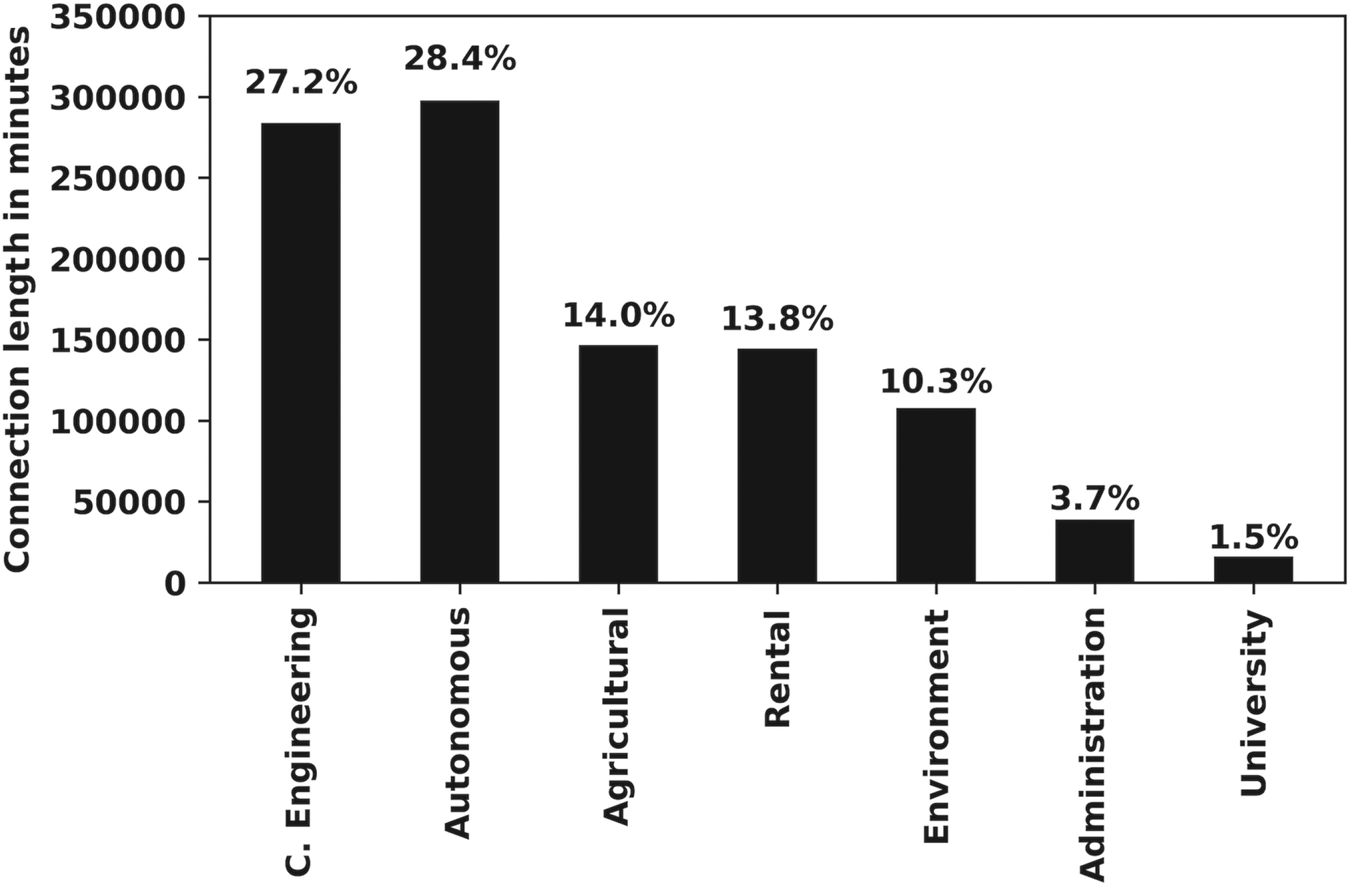
The analysis included in this manuscript corresponds to a period between 2015 and 2019. The result of the MapReduce transformations generates the following output for users connected to the GNSS network: number of connections for every mountpoint, as shown in Figure 3, where RED*, VRS*, CMR*, RTCM3NET, GPS\_GLONASS and DGPS* are the network RTK services, while the rest of the mountpoints are real-time connections to individual stations. Figure 4 shows the number of connections by month, day or weekday. Connection length in minutes by month, day or weekday is shown in Figure 5. Connection length in minutes by user is shown in Figure 6. Connection length in minutes by time interval (less than 5 min, from 5 to 15 min, etc.) is shown in Figure 7. Connection length in minutes by market sector is shown in Figure 8.
Number of connections per mountpoint or service during 2016

Number of connections by day during 2016

Connection length in minutes by month during 2016

Top 20 differential GNSS users during 2016

Mean value of annual connections by time interval during 2016–2019

Mean time-span in minutes by market sector per year (2016–2019)

From the results, we can see that the weekends are the days with the lowest demand for the service and August is the month with the lowest demand. An interesting point to consider is that the mean daily time-span of the connection was about 2,960 min for 2015, 2,954 min for 2016, 3,515 min for 2017, and even more than 4,500 min every day for 2018 and 2019, thus reflecting a considerable increase in the service demand year by year.
From the recursive execution of the previous script month by month from January 2015, it is possible to obtain information about the users’ behaviour and the market sectors with the GNSS network service.
Heat mapping and point mapping showing the location of the users obtained in the query can be seen in Figure 9. All these MapReduce transformations have been coded in the same script, so all results are obtained in the same execution process.
Location map of ERVA user connections during 2016

3.2 Correlations
With the application of correlations in this approach, the concept explains how one or more variables are related to each other. It gives us an idea of the degree of relationship between two variables, such as the seasonal trends and market brands, or economic crisis and the development of certain market domains.
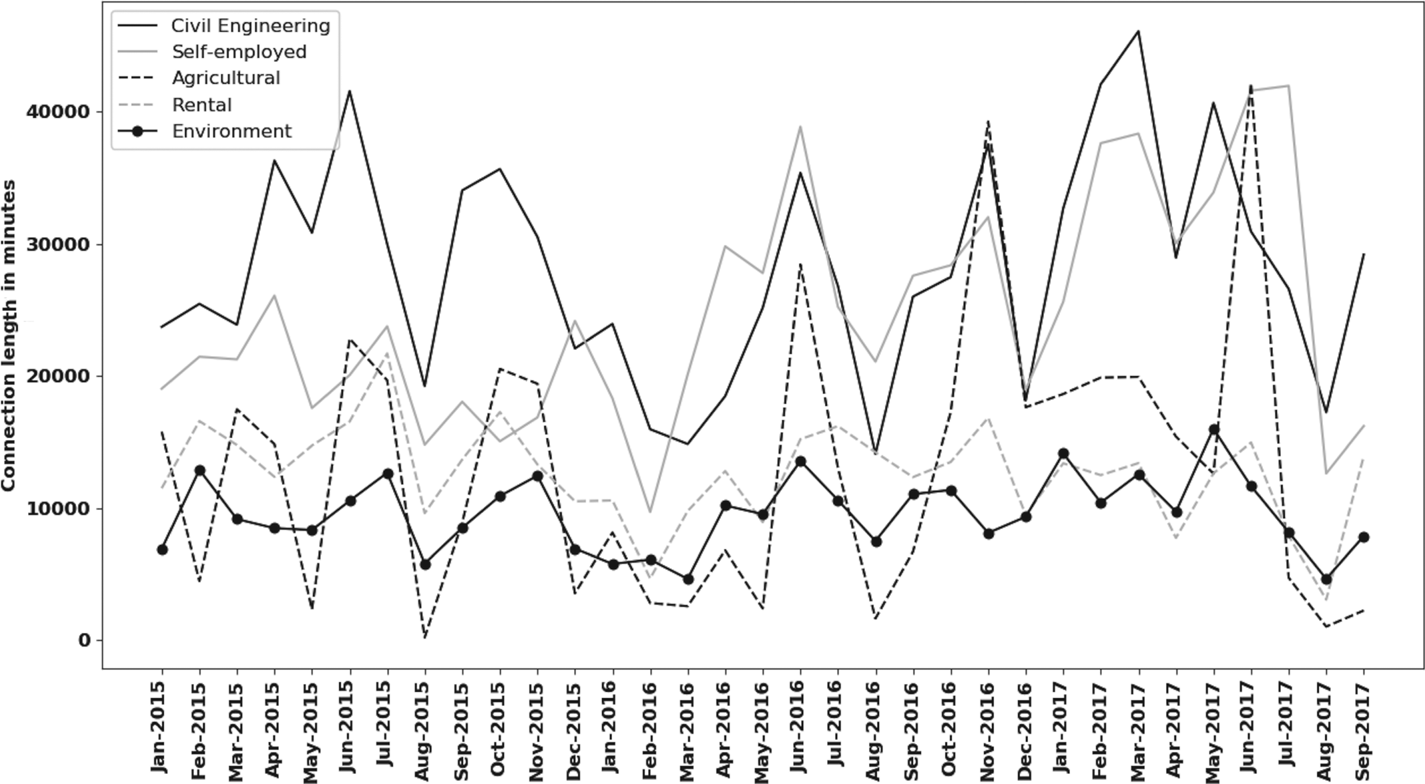
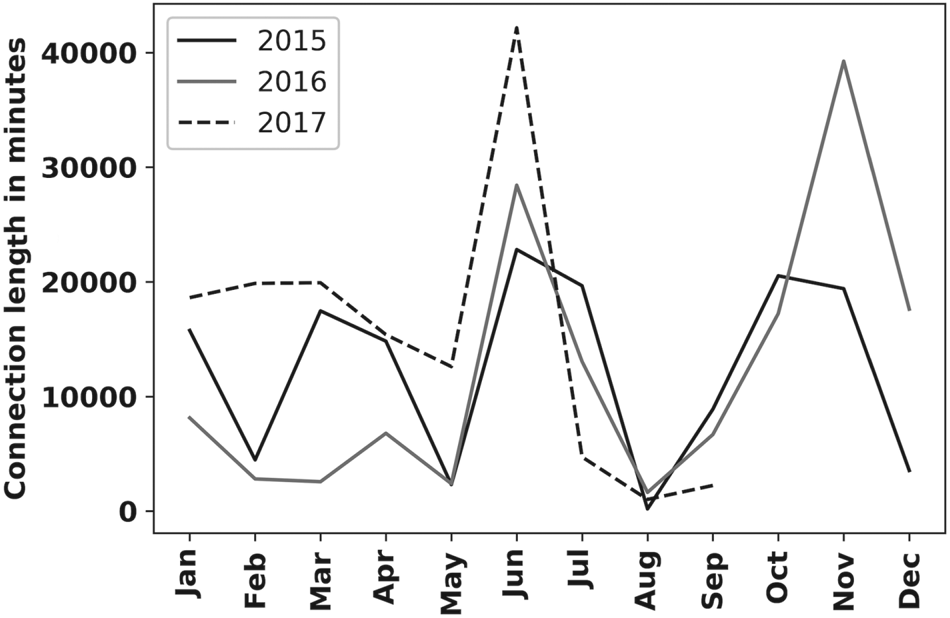
The Spark Machine Learning Library (MLLib) is used for this section. No representative correlation among sectors has been found, as shown in Figure 10. The highest correlations between sectors occur between the sectors of civil engineering and agriculture (58%), between the sectors of civil engineering and the environment (56%) and between the sectors of the environment and sectors of occasional use with temporary rentals of GNSS equipment (56%). The only sector that shows a year-to-year correlation for the three analysed years is the agricultural sector (with 60% month connections between 2015 and 2016, 67% between 2016 and 2017, and 66⋅8% for 2018 and 2019) with a clear seasonal trend, as shown in Figure 11.
Evolution of the top five market sectors

Evolution of the agricultural sector per year

This percentage for the agricultural sector increases year by year. Although there is a decrease in activity between July and August and an increase between August and September in all sectors, there is a decline in activity between November and December for the sectors of civil engineering, agriculture and rentals.
3.3 Regressions
As defined in classical statistics, regression analysis is a method to model the relationship between a target variable and one or more predictor independent variables. It helps us to understand how the value of the target is evolving corresponding to changes in the predictor variables.
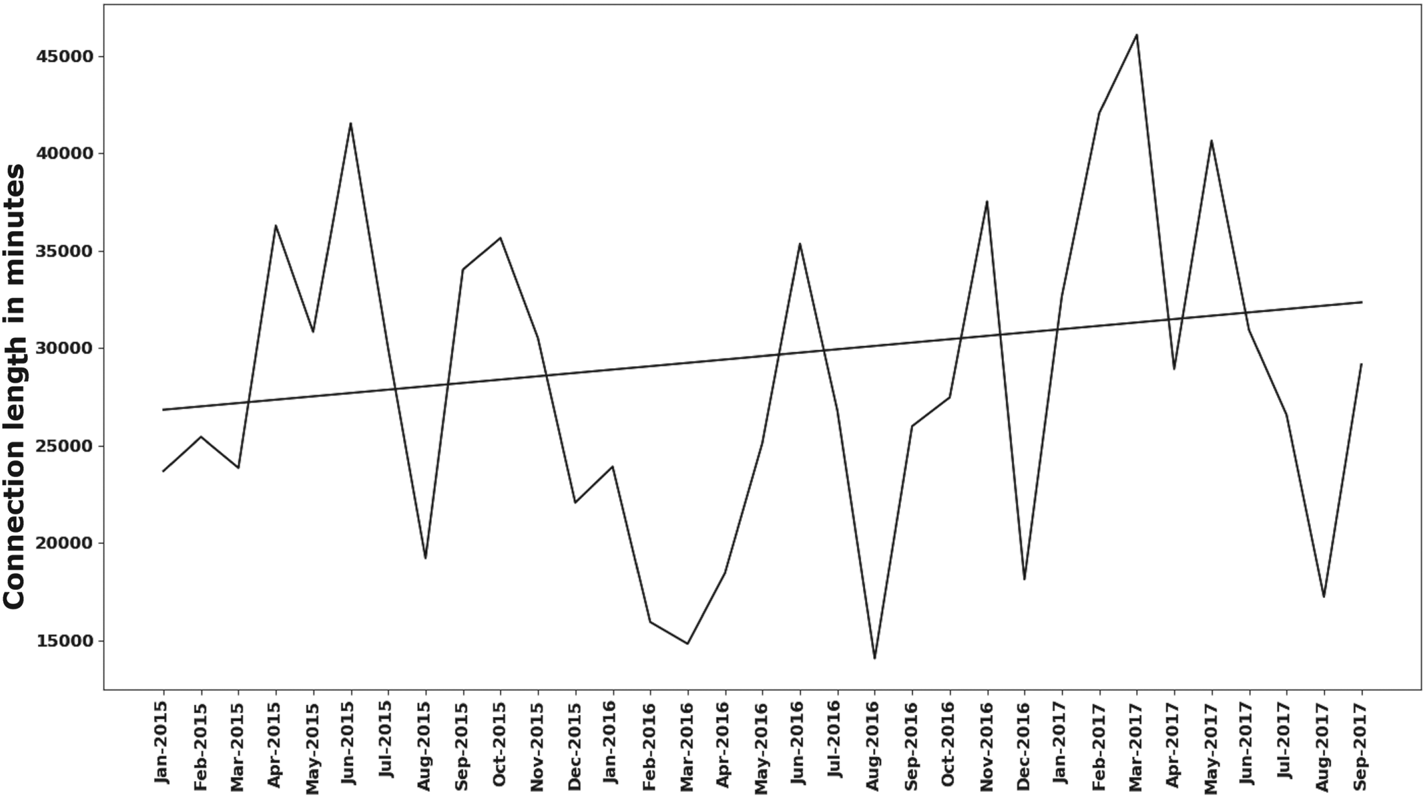
It can be seen that all sectors increase the use of the services and connection time, by computing a regression line for all sectors at the time of use of the real-time positioning service. The civil engineering sector increased the use of the GNSS-ERVA service by 135 min by month in the studied period, the self-employment sector by 455 min, the agriculture sector by 146 min, the environment sector by 52 min, and the rental sector by 106 min. This is shown in Figures 10 and 12. This idea will be developed and expanded in future research to forecast each sector using more complex algorithms such as neural network, random forest, ARIMA models or support vector regression.
Evolution of the civil engineering sector and the regression line

3.4 Clustering
Clustering is an unsupervised machine learning technique that involves the grouping of data sets or points (with one or more variables), classifying each data set or point into a specific group. Data points that are in the same group should have similar properties and/or features.
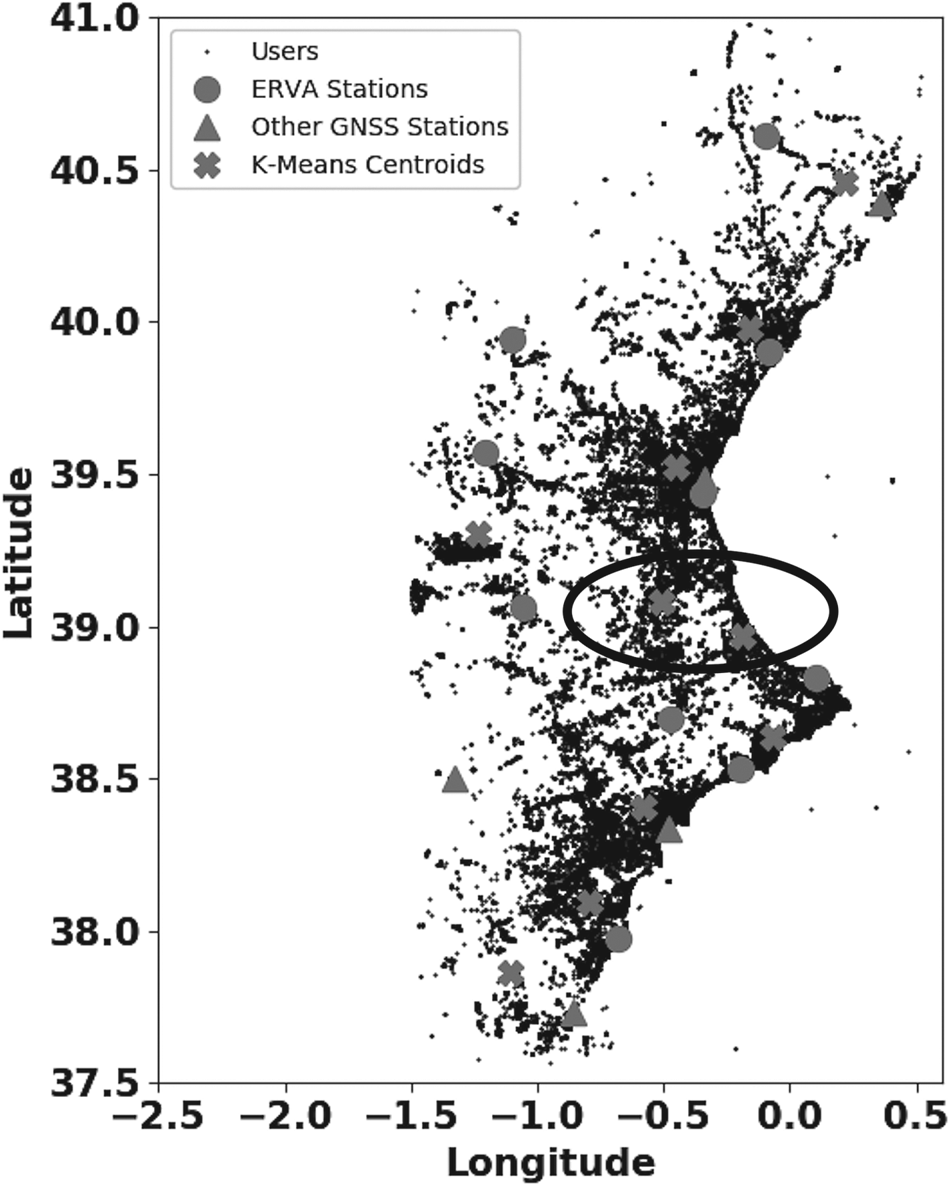
MLLib is used for this section. The idea is to use all user locations during several years to determine the ideal centroid location for the same number of clusters as permanent stations exist and are used to generate the network solution. Therefore, the centroids give us the ideal location for the reference stations based on the locations of real users and can help the decision making regarding the location of a new reference station. Figure 13 is obtained using K-means clustering, where some areas can be easily identified as optimal locations for a new reference station. In the figure, as an example, a circled area is represented in order to help decision makers if they have to include a new permanent station in the territory. Based on the position of the real reference stations and the computed centroids, the circled area is the optimal location obtained for a new station with the clustering algorithm.
K-means clustering: example of an optimal location for a new station inside the circled area, based on the existent stations and computed centroids

3.5 Top users and sectors
Using MapReduce transformations and sort actions to find the top market segments, it is possible to analyse very useful information for knowledge of customer and segment behaviour and stable connections. The percentage of use of the service for each sector is constant if the use is less than 3 h of continuous connection during the period 2015–2019 (20%–30% for civil engineering, 20%–30% for self-employment, 10%–15% for agriculture, 10%–15% for rentals and 10% for the environment – which is the most stable of all). However, if the connection exceeds 3 h of use, the percentage of all sectors decreases, except for the agriculture sector, which rises to 47%. That is, half of the users that use the service with connection times longer than 3 h belong to the agricultural sector.
Over the six years from 2015, the quantitative differences between the number of authenticated users have been obtained every year. The differences give the new users that access the services gradually. In this way, the trend shows that the mean number of new users connected to the service per month has been growing.
3.6 Cartographic reference location of the GNSS positions
In this analysis, cartographic information and GeoJSON data sources have been used. The GeoJSON format (http://geojson.org/) is based on the JavaScript Object Notation (JSON) scheme. JSON allows for better compression of the data sets and topology. A vector feature and its attributes are represented as a JavaScript object. Data based on the GeoJSON structure allow better interoperability, interchange between different platforms and access. For instance, it is supported in many open source libraries and web clients. The format allows for easy parsing of the geometry and attributes for the geospatial representation of geographic data. GeoJSON can be easily treated with the Python software using the GeoJSON library or the JSON and Shapely libraries.
3.6.1 Transport infrastructures
An important geographic dataset from GeoDatabase was provided by the Transports Network project, which is called RT project. It has the objective of defining the structure of the spatial objects and topology, including all kinds of roads and transport infrastructures, following the INSPIRE European Union data specifications (https://inspire.ec.europa.eu/data-specifications). These data sets were exported in the GeoJSON file format. The topology and attributes of the transport infrastructures give information about their geometry such as their width, length, capacity and direction. For example, there are 15194,82 km of interurban roads in the transport infrastructures in the area of this study (25,000 km2).
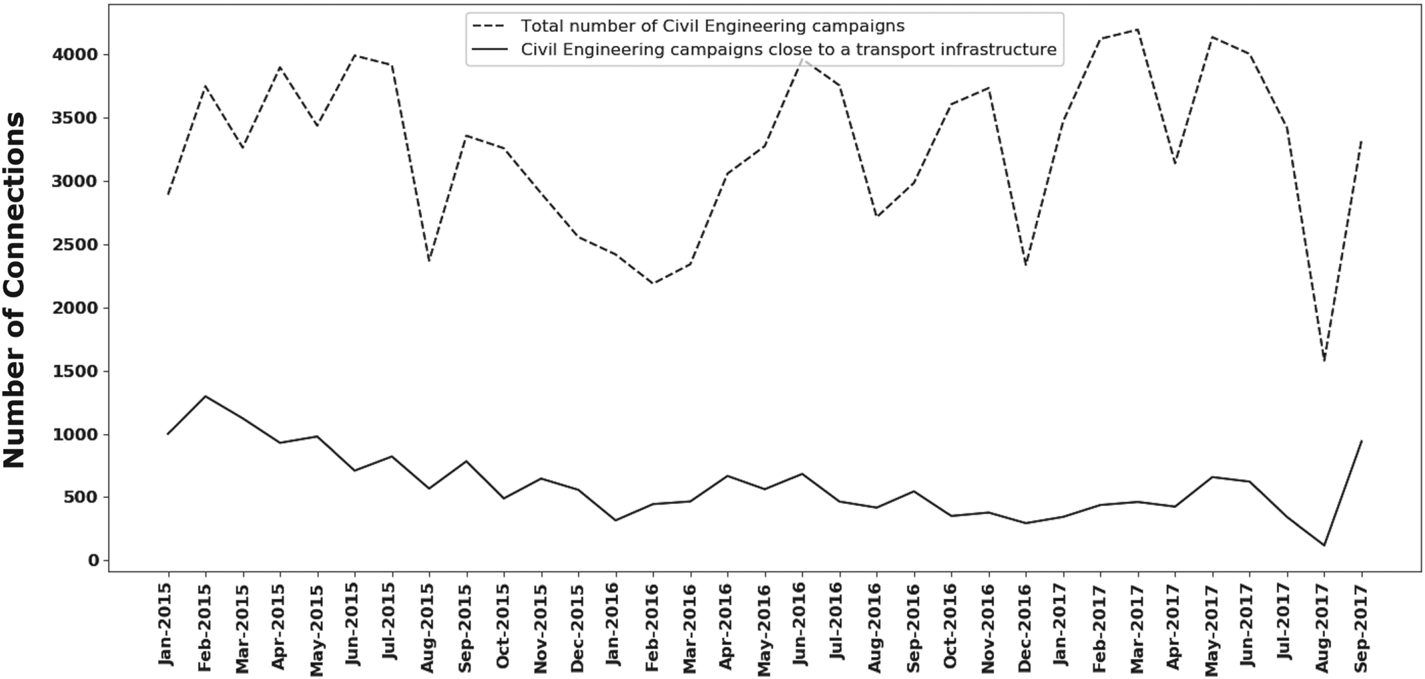
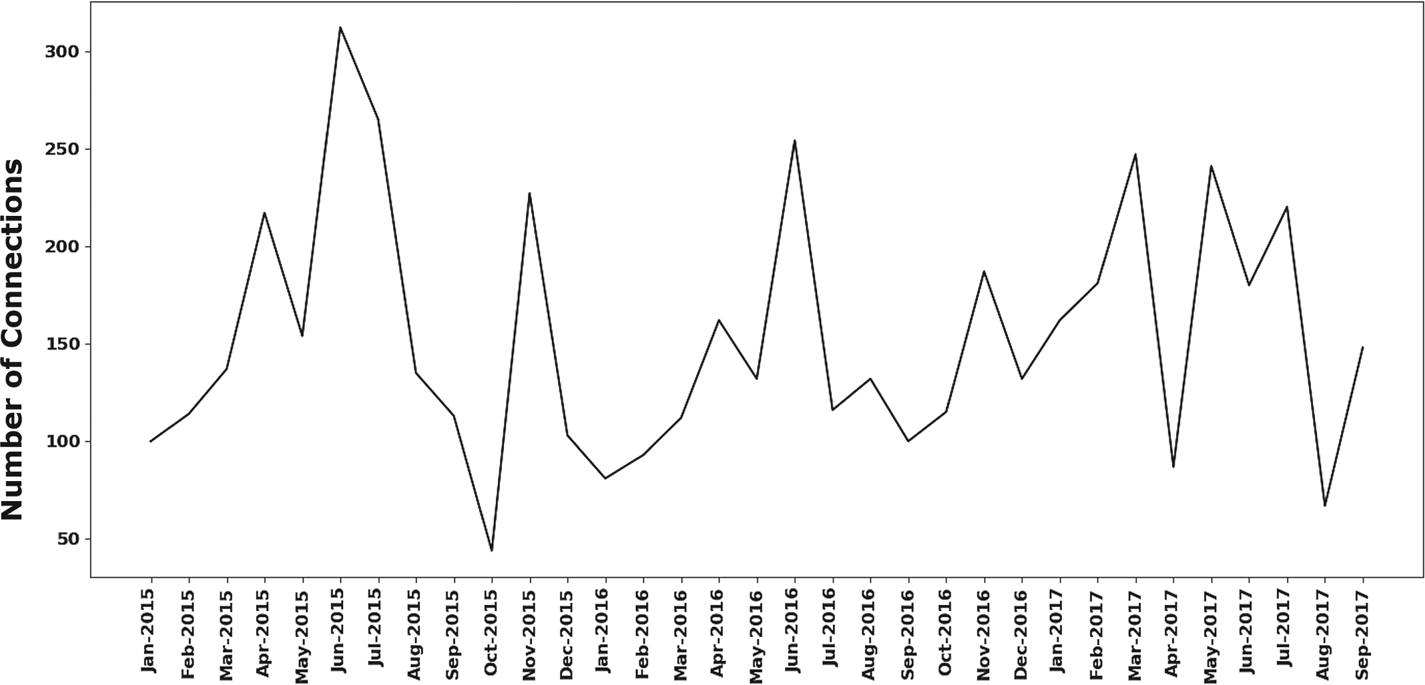
The real-time GNSS user positions can be filtered by sector (civil engineering) and location. The algorithm for filter location searches for users close to a transport infrastructure represented in the GeoJSON format with the known attributes of width and length, in order to obtain the evolution of the number of civil engineering field campaigns near these infrastructures.
Figure 14 shows this evolution from January 2015 to September 2017; during this period 19,856 campaigns were detected. The trend of the number of surveying campaigns during 2015 is decreasing, it is more or less constant for 2016, and it is increasing for 2017–2019 (with the exception of August). Table 1 shows the total number of campaigns every 100 and 5 lineal kilometres for interurban roads.
Evolution of the total number of civil engineering campaigns and those close to a transport infrastructure

Number of real-time GNSS campaigns on interurban roads

Table 2 shows the total number of campaigns every 100 and 5 lineal kilometres for all transport infrastructures. Data mining analysis revealed 90,188 campaigns in the studied period. These results show a recovery in the civil engineering business sector that must be confirmed using information corresponding to the following months.
Number of real-time GNSS campaigns on all the infrastructures

3.6.2 Agriculture sector
Precision agriculture has been an important business market since around 2010 (European GNSS Agency, 2019). In this sector, GNSS differential services are mainly needed for precise guidance of agricultural machinery. Additionally, unmanned aerial vehicles (UAVs) are currently used for precision agriculture. UAVs are also appropriate for agricultural smallholdings and include GNSS equipment that can assign spatial coordinates to the aerial photographs of the crops. This kind of application is very useful for pest control in vineyards or fruit crops.
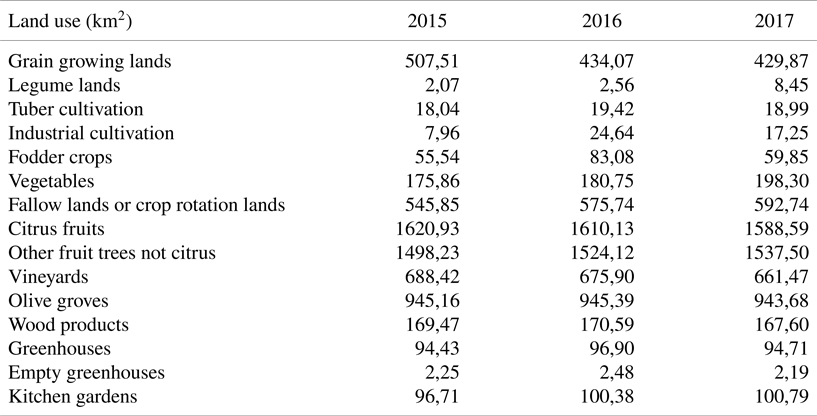
In Spain, public regional or local permanent GNSS networks offer different corrections for free. For this reason, the different RTK public services in Spain have also become an essential tool for agriculture guidance or satellite farming. In the case of the territory of Valencia, agricultural land evolution is updated every year by the regional government agency with competencies in agriculture (http://www.agroambient.gva.es/es). This evolution from 2015 to 2017 can be seen in Table 3.
Evolution of the surface area for different types of agricultural land use. Units are km2

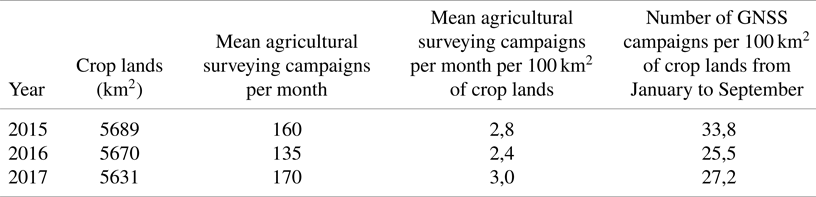
All the agricultural land uses in Table 3, except for crop rotation lands, greenhouses, empty greenhouses and kitchen gardens, can use GNSS technology as a tool for precision agriculture. The existing areas of agricultural lands in square kilometres are given in the first column of Table 4. This shows that the surface area of agricultural lands has tended to decrease, mainly due to depopulation, in some zones in the west of Valencia, which might contribute to a progressive abandonment of agriculture as a productive activity.
Number of real-time GNSS campaigns per 100 km2 of crop lands

However, the evolution of surveying campaigns in the agricultural sector tends to increase year by year, as shown in Figure 15. Therefore, the mean agricultural surveying campaigns per month, which are given in the second column of Table 4, reflect an increase in agricultural activity. Based on the first two columns of Table 4, it is possible to compute the use of GNSS technologies for every 100 km2 surface, which is given in the third column of Table 4. The last column is the total number of agricultural campaigns, taking into account the same period over the three years (January–September) in every 100 km2. Similar values were obtained for 2018 and 2019. These results again reflect an increase in this sector in spite of the diminution of agricultural lands. This trend will be analysed in future research with data from the subsequent years, aiming to verify this hypothesis: the evolution and modernization of agricultural activities have a direct impact on the performance and profitability of crop lands, and this fact can help to avoid the abandoned crop lands and depopulation in some areas that depend on agriculture as the main activity.
Evolution of the number of connections for the agricultural sector

4. Discussion
Compared with other solutions for data mining, this implementation based on big data architecture has some remarkable differences. First of all, a big amount of data sets is quickly processed with a non-centralised traditional architecture. By splitting the dataset into small pieces, clusters of data can be processed with better performance.
The original information and format, whatever the format, is preserved without limitations with the implemented big data architecture. This has a positive aspect. Normally, the network GNSS monitoring software generates its own output files of recorded connections of users. These files can have different formats (access database records, XML, ASCII, log files, binary proprietary formats etc.).
With the exception of the NMEA specific sentence formats for communication between navigation devices, there are no standardised formats for monitoring users’ connections in real-time navigation. The proposed big data architecture needs, and can use and extract conclusions in real-time, not only from the NMEA files, but also from the additional information that provides the monitoring software of the network to obtain additional analysis. Thus, whatever the format of the input files, the big data architecture will be able to use it.
This approach and solution does not use proprietary libraries or software, as the entire infrastructure uses open source software. Also, different time-spans can be chosen for the analysis: real-time, day-by-day, monthly or annual use of the positioning and location services.
Specifically, the use of the MongoDB open source database allows integration with any programming language, and a powerful graphic interface. Another positive consequence is the replication and high availability. The input data can also be indexed based on any attribute of the navigation parameters, and it is possible to combine different and new data sets that arrive in real time. The capability of processing has been provided by the Hadoop framework which has allowed the management of clusters. With the combination of Hadoop and MapReduce, a quick method of data recovering and analysis over a huge volume of users is obtained, which is not possible with the traditional GNSS network proprietary software. Finally, when comparing data mining implementation with other software solutions, it has shown better performance in terms of velocity, hardware requirements and output information.
5. Conclusion
The proposed big data architecture applied to the GNSS market segment of differential services has become an optimal and effective option, because it allows the loading, storage and data mining of massive data and stored records of positioning and navigation quickly and easily. The same software language (Python) is used in all the processes. Therefore, a modular code has been created that performs the whole analysis. Based on this architecture, the analysis and data mining processes have been executed in order to identify the correlations between the dynamics of the GNSS network users and some of the most important economic sectors of the territory, such as agriculture, civil engineering and self-employment, but it is useful for analysing more market segments in any differential correction services. The MapReduce programming paradigm has proved to be successful in the analysis with the top market segments and sectors that need precise navigation and positioning services.
The lineal regression technique shows increments in the number of new users in the civil engineering, agricultural, self-employment and environmental sectors every month. The data mining processes illustrates the trends with respect to the civil engineering sector. This sector was negatively affected by the economic and global financial crisis, but its business volume seemed to recover during 2017–2019, and must be analysed during the coming years after the crisis caused by the global pandemic.
The big data process and data mining integration provides interesting economic findings for the agricultural sector. It shows how the GNSS technique has been introduced in this market and how it can benefit the economy based on this market segment. Additionally, the Spark MLLib has become a very relevant tool in order to show the frequency of connections in the agricultural sector, showing a correlation with seasonal trends. That is to say, there exists a year-on-year correlation and it reveals that half of the users of the service with connection times longer than 3 h belong to the agricultural sector. Furthermore, it reveals information about the time-span and the geographic locations with the most demand in real time with clustering.
With respect to the input format files for the analysis, some positive aspects are that a great quantity of input and output formats is supported by the libraries. Also, a powerful graphic output could be further developed with the use of JSON format.