I. INTRODUCTION
In the past decade, the synthesis of iron nanoparticles has been intensively developed for their fundamental scientific interests and biomedical applications,Reference Shaw, Westly, Pittet, Subramanian, Schreiber and Weissleder1 such as biosensers,Reference Miller, Prinz, Cheng and Bounnak2 targeted drug delivery,Reference Jain, Morales, Sahoo, Leslie-Pelecky and Labhasetwar3, Reference Chourpa, Douziech-Eyrolles, Ngaboni-Okassa, Fouquenet, Cohen-Jonathan, Souce, Marchais and Dubois4 contrast agents in magnetic resonance imaging (MRI),Reference Tiefenauer and Vo-Dinh5–Reference Corot, Robert, Idee and Port8 and magnetic hyperthermia.Reference Ito, Shinkai, Honda and Kobayashi9, Reference Hergt and Dutz10
The intracellular uptake and degradation of the iron nanoparticles is important to their most biomedical application.Reference Nam, Kwon, Chung, Lee, Kwon, Jeon, Kim, Park, Kim, Her, Oh, Kwon, Kim and Jeong11 The intracellular uptake of iron nanoparticles is a prerequisite to their most clinical applications, in which they are required to internalize into cells. For example, the cells labeled by iron nanoparticles were used to monitor the engraftment process. Therefore, the evaluation of the intracellular uptake of iron nanoparticles is essential to their clinical applications. To translate an agent of iron nanoparticles to the theranostic applications, the comparative and quantitative evaluation of its labeling efficiency to various cells is necessary.Reference Chithrani, Ghazani and Chan12
However, most previous quantitative evaluations are not systematic. In these evaluations, different cell lines and iron nanoparticles with various core, size, and coating were used in different studies. Moreover, an agent of iron nanoparticles was often evaluated with only one kind of cell in most studies. As a result, it is hard to compare the results from different studies and find the common biomedical performance of an iron nanoparticle agent. Therefore, it is necessary to perform comprehensive studies in this field, for example, to systematically evaluate the cell labeling effect of an iron nanoparticle agent with multiple cell lines from different tissues and species.
For this purpose, this study investigated the cell labeling effect of a 12-nm meso-2,-3-dimercaptosuccinic acid (DMSA)-coated Fe3O4 nanoparticles to six different cell lines, including mouse macrophage cells (RAW264.7), hepatoma cells (Hepa1-6), Human acute monocytic leukemia cells (THP-1), hepatoma cells (HepG2), liver cells (HL-7720), and cervical adenocarcinoma cells (HeLa). These cell lines were often chosen to serve as models for evaluation of the intravascularly administered agents. The macrophage and monocytes are the commonly used cell lines for phagocytosis investigation of nanoparticles, and the hepatocytes are important to evaluate the hepatotoxicity of a novel nanoparticle agent.Reference Shaw, Westly, Pittet, Subramanian, Schreiber and Weissleder1 The cancer cells are the anticipant targets for drug delivery and magnetic hyperthermia by the iron nanoparticles.
II. EXPERIMENTAL PROCEDURE
A. Nanoparticles, chemicals, and cells
The Fe3O4 magnetic nanoparticles were supplied by Dr. Chen of the Biological and Biomedical Nanotechnology Group of the State Key Lab of Bioelectronics, Southeast University, Nanjing, China.Reference Chen, Zhang, Zhang, Xia, Liu, Xu and Gu13 The nanoparticles were averaged 12 nm in diameter, modified with 2, 3-dimercaptosuccinnic acid (DMSA). N-(2-hydroxyethyl) piperazine-N'-ethanesulfonic acid, glutaraldehyde, and paraformaldehyde were purchased from Sigma (St. Louis, MO). The cell culture media of RPMI-1640 and Dulbecco’s modified Eagle medium (DMEM) were purchased from Gibco (Carlsbad, CA). Potassium peroxydisulfate (K2S2O8), potassium ferrocyanide (KSCN), Iron (III) chloride hexahydrate (FeCl3), and hydrochloric acid were purchased from Sinopharm Chemical Reagent Co. Ltd., Shanghai, China. The cells, including RAW 264.7, Hepa1-6, THP-1, HepG2, HL-7720, and HeLa, were all purchased from China Center for Type Culture Collection, Chinese Academy of Sciences, Shanghai, China.
B. Cell culture and treatment with nanoparticles
The adherent cells, RAW264.7, Hepa1-6, HepG2, and HeLa, were cultured in DMEM supplemented with 10 mM HEPES, 10% fetal calf serum (FCS), 100 U/mL penicillin and 100 μg/mL streptomycin in a humidified 5% CO2 atmosphere at 37 °C in 75 cm2 flasks; HL-7702 was cultured in RPMI-1640 medium, supplemented with 10% FCS, 10 mM HEPES, 2 mM L-glutamine, 50 U/mL penicillin, and 50 μg/mL streptomycin. The suspension cell THP-1 was cultured in RPMI-1640 medium containing 20% FCS. To treat adherent cells with the nanoparticles, 50,000 cells per well were seeded into 24-well plate for iron content measurement, 15,000 cells per well were seeded into 48-well plate for Prussian blue staining, and 10,000 cells per well were seeded into 96-well plate for MTT assay. The cells were cultured for 24 h, and then the media containing different concentrations of the nanoparticles were exchanged into wells, and cells were cultured for more various times. To treat suspension cell with the nanoparticles, cells were seeded into microwells at a density of 1 × 10⁶ per mL and cultured for 24 h, the nanoparticles were then directly added into wells and cells were continuously cultured for various times.
C. Transmission electron microscopy (TEM) observation
After the nanoparticles treatment, cells were collected and fixed overnight at 4 °C with 1.25% glutaraldehyde in 0.1M phosphate buffer saline (PBS, pH 7.4). Cells were rinsed with PBS and post-fixed with 1% osmium tetroxide for 1 h, dehydrated with a series of ethanol solutions of 50–100%, cleared with propylene oxide, and gradually infiltrated with Epon resin (Shell Chemical, Parsippany, NJ). Cells were arranged in molds filled with Epon resin and allowed resin to polymerize at 60 °C for 24 h. The resin-embedded cell samples were sectioned with a diamond knife mounted on a RMC MT-7 ultramicrotome (Research and Manufacturing Co., Tucson, AZ). The ultrathin sections were supported on a copper grid and observed on a Hitachi 8100 electron microscope (Tokyo, Japan) at an acceleration voltage of 100 kV.
D. Prussian blue staining of cells
After the nanoparticles treatment, cells were treated in turn as follows: washed three times with PBS, fixed with 4% paraformaldehyde for 30 min, washed three times with PBS, incubated for 30 min with 2% potassium ferrocyanide (Perl’s reagent) in 6% hydrochloric acid, washed with PBS again, and counterstained with nuclear fast red. The stained cells were observed with a light microscope and photographed.
E. Measurement of cell iron content
After the nanoparticles treatment, cells were washed three times with PBS, collected in a 1.5-mL tube, and counted. Cells were precipitated by centrifugation, resuspended in 50 μL of hydrochloric acid, and incubated at 60 °C for 4 h. Cells were precipitated by centrifugation again, and the supernatants were transferred into 96-well plates. Fifty microliters of freshly prepared detection reagent (0.08% K2S2O8, 8% KSCN, and 3.6% HCl dissolved in water) was added to each well, and the plates were kept at room temperature for 10 min. The absorbance was measured using an absorption reader (Bio-Tek instruments, Winooski, VT) at an excitation wavelength of 490 nm. The iron content was determined by normalizing the obtained absorbance with a standard curve using FeCl3 calibration standards that contained 0, 0.5, 1, 2, 4, 6, 10, 20, 40, 50, and 100 μg/mL of iron. A blank control cell sample was used to confirm the absence of iron contamination in the tested cells. The average iron content per cell was calculated by dividing the total iron content of a cell sample with the number of cells in this sample. Each experiment was repeated in triplicate wells at least six times.
F. Measurement of cell viability
The cell viability was measured with a modified MTT assay.Reference Pieters, Huismans, Leyva and Veerman14, Reference Häfeli, Riffle, Harris-Shekhawat, Carmichael-Baranauskas, Mark, Dailey and Bardenstein15 In brief, after the nanoparticles treatment, the cell culture medium containing the nanoparticles was carefully removed, and 180 μL of serum-free medium and 20 μL of an MTT solution (5 mg/mL in PBS) (Sigma) were added to the cells. Cells were incubated for 4 h. As a control, 150 μL of PBS (pH 7.4) was added to the cells of three wells. The supernatant in each well was aspirated and 150 μL of dimethyl sulfoxide (DMSO) was added to the cells for solubilizing the cells and MTT crystals. After shaking at 400 rpm on an Eppendorf Thermomixer (Eppendorf Inc., Hamburg, Germany) at 37 °C for 10 min to allow all crystals to dissolve, the blue color was read in a multiwell reader (Bio-Tek Instruments) at 570 nm. The cell viability of blank control cells was defined as 100%, and the cell viability of the nanoparticle-treated cells was calculated by dividing their optical density with that of blank control cells. The nanoparticles were considered toxic if the difference between the cell growth inhibition of control and exposed cells was statistically significant at the 5% level, as determined by a t-test.
G. Statistical analysis
All data are presented as mean ± standard deviations (SD). The data were statistically processed using analysis of variation and the Student’s t-test. For all the tests, p values of <0.05 were considered to indicate statistical significance. All the calculations were performed using SPSS 10.0 statistical program (SPSS Inc., Chicago, IL).
III. RESULTS AND DISCUSSIONS
A. Confirmation of Prussian blue staining results by TEM
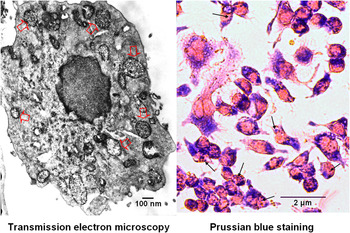
The TEM was used to observe the internalization of magnetic nanoparticles (MNPs) into cells, determine the subcellular distribution and localization of nanoparticles in cells, and find the morphology of nanoparticles before and after cell uptake.Reference Wilhelm, Billotey, Roger, Pons, Bacri and Gazeau16–Reference Zhou, Leuschner, Kumar, Hormes and Soboyejo19 However, it is cumbersome, time-consuming, and low-throughput to detect large numbers of samples with TEM. It is also difficult to quantitative assay of cellular uptake of nanoparticles with TEM. The Prussian blue staining was developed and used as a facile alternative approach to detect the intracellular iron nanoparticles.Reference Arbab, Bashaw, Miller, Jordan, Lewis, Kalish and Frank20–Reference Farrell, Wielopolski, Pavljasevic, Kops, Weinans, Bernsen and van Osch26 In this study, the TEM observation found that only the nanoparticle-treated RAW264.7 cells contained large numbers of inclusions in the cytoplasm [Fig. 1(a)], and the light microscopy observation found only the nanoparticle-treated RAW264 cells contained agglomerates stained in blue by Prussian blue [Fig. 1(b)]. These results reveal that the blue agglomerates in cells stained by Prussian blue consist of the inclusions of iron nanoparticles. This is in agreement with other previous studies.Reference Rivière, Boudghène, Gazeau, Roger, Pons, Laissy, Allaire, Michel, Letourneur and Deux22, Reference Schwarz, Fernandes, Sanroman, Hodenius, Lang, Himmelreich, Schmitz-Rode, Schueler, Hoehn, Zenke and Hieronymus25 Therefore, this study detected the larger numbers of cell samples treated by the nanoparticles with high-throughput Prussian blue staining.
Observation of the internalization of the nanoparticles into RAW264.7. Cells were treated with the nanoparticles at a concentration of 30 μg/mL for 24 h. The open arrows in TEM image (a) point out several typical cytoplasmic inclusions of the nanoparticles in a cell. The solid arrows in light microscopy image (b) point out several typical agglomerates of the nanoparticles stained in blue by Prussian blue.

B. Qualitative investigation of cell labeling with Prussian blue staining
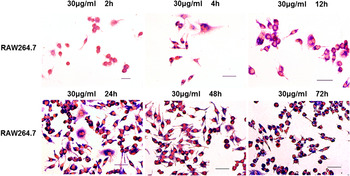
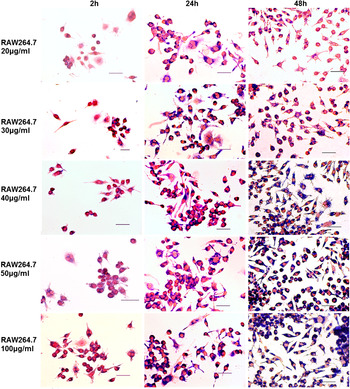
To systematically investigate the internalization of the nanoparticles into six different mammalian cells, cells were incubated with cell culture media containing the nanoparticles at various concentrations for different times. After the nanoparticles treatment, cells were stained with Prussian blue for visualizing the intracellular iron with light microscope. The inclusions containing iron presented as dense blue granules in Prussian blue stained cells [Fig. 1(b)]. The cell nucleus was stained in red after cells were counterstained with nuclear fast red [Fig. 1(b)]. Because the macrophage and monocytes may ingest many nanoparticles and are commonly used for phagocytosis investigation of nanoparticles,Reference Shaw, Westly, Pittet, Subramanian, Schreiber and Weissleder1, Reference Chen, Zhang, Zhang, Xia, Liu, Xu and Gu13 the internalization of the nanoparticles into RAW264.7 cells was investigated in more detail than other cells. Not only the internalization of the nanoparticles into the cells, which were treated with the nanoaprticles at a concentration of 30 μg/mL for 2, 4, 12, 24, 48, and 72 h, but also the internalization of the nanoparticles into the cells, which were treated with the nanoaprticles at concentrations of 20, 30, 40, 50, and 100 μg/mL for 2, 24, and 48 h, were systematically investigated.
The typical images of Prussia blue staining of RAW264.7 treated with the nanoparticles at a concentration of 30 μg/mL for various times are presented in Fig. 2. It is clear that the inclusions of the nanoparticles in cells increased with the incubation time. When cells were incubated with the nanoparticles for 2 h, few cells obviously contained the nanoparticles, however, the number of cells obviously containing the nanoparticles increased with the incubation time. After incubation for 4 h, almost all cells was effectively labeled by the nanoparticles.The cytoplasm of most cells was filled up with large numbers of the nanoparticles’ inclusions, showing the great endocytosis of RAW264.7 cells to the nanoparticles.
Prussian blue staining of RAW264.7. Cells were incubated with the nanoparticles at concentrations of 30 μg/mL for 2, 4, 12, 24, 48, and 72 h. Scale bar = 2 μm.

The typical images of Prussia blue staining of RAW 264.7, which were treated with MNPs at various concentrations (20, 30, 40, 50, and 100 μg/mL) for different times (2, 24, and 48 h), are shown in Fig. 3. When these cells were incubated for 2 h with MNPs, cellular labeling was low detectable at Prussian blue staining (left column of Fig. 3). After treatment for 24 h (middle column of Fig. 3) and 48 h (right column of Fig. 3) more and more MNPs internalized into cells. While at the same incubation time, the intracellular nanoparticles uptake substantially increased with the concentration of MNPs in culture medium, revealing a significant dose-dependent uptake of nanoparticles into cells. It is obvious that the MNPs’ concentration is more of a determinant than incubation time to the cell loading of MNPs.
Prussian blue staining of RAW264.7. Cells were cultured, incubated with the nanoparticles at concentrations of 20, 30, 40, 50, and 100 μg/mL for 2, 24, and 48 h. Scale bar = 2 μm.

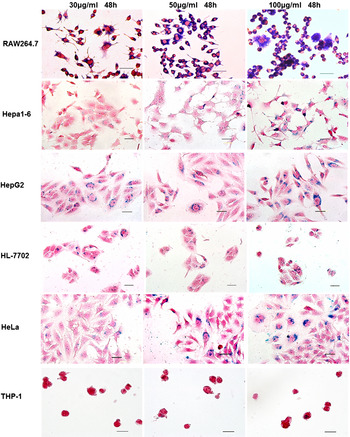
To investigate the labeling performance of the nanoparticles to various mammalian cells, other five cell lines, including Hepa1-6, THP-1, HepG2, HL-7702, and HeLa, were also treated with the nanoparticles. These cells include the normal and cancer cells coming from different tissues (blood, liver, and cervices) of different animals (mouse and human). The typical images of six different cells treated by the nanoparticles and stained with Prussian blue are presented in Fig. 4. and show the nanoparticles internalized into all cells investigated. These results reveal the internalization of the nanoparticles into various cells in a cell-nonspecific mechanism. This facile cell-nonspecific labeling of a variety of mammalian cells by the nanoparticles suggests that the nanoparticles may be a good reagent for MRI imaging. However, the endocytosis capability of different cells was not the same. It is obvious that RAW264.7 endocytosed much more nanoparticles than other cells, and its endocytosis rate was higher than those of other cells. This agrees with the physiological function of this cell.
Prussian blue staining of RAW264.7, Hepa1-6, THP-1, HepG2, HL-7702, and HeLa. Cells were incubated with the nanoparticles at concentrations of 30, 50, 100 μg/mL for 48 h. Scale bar = 2 μm.

C. Quantitative evaluation of cell labeling with iron loading
The quantitative evaluation of the intracellular uptake of iron nanoparticles is essential to their clinical applications. Several methods based on different physical concepts were used to quantify the cellular iron loading, including atomic absorption spectroscopy,Reference Slavin27, Reference Hoepken, Korten, Robinson and Dringen28 paramagnetic resonance spectroscopy,Reference Woodmansee and Imlay29 a desktop susceptometer,Reference Strom, Hultenby, Gruttner, Teller, Xu and Holgersson30 magnetophoresis assay,Reference Wilhelm, Billotey, Roger, Pons, Bacri and Gazeau16, Reference Rivière, Boudghène, Gazeau, Roger, Pons, Laissy, Allaire, Michel, Letourneur and Deux22 electronic spin resonance,Reference Wilhelm, Billotey, Roger, Pons, Bacri and Gazeau16, Reference Rivière, Boudghène, Gazeau, Roger, Pons, Laissy, Allaire, Michel, Letourneur and Deux22 densitometric analysis, and colorimetric assay.Reference LeVine, Wulser and Lynch31–Reference Adams33 The colorimetric assay is a widely used method for bulk cellular iron content measurement, which relies on the spectrophotometric detection of the colored complex formed by reaction of Fe2+ with ferrozine.Reference Gay, Collins and Gebicki34–Reference Huberman and Perez36 The final measure is only dependent on a regular ultraviolet-visible spectrophotometer or microplate reader.Reference Rad, Janic, Iskander, Soltanian-Zadeh and Arbab37 The microplate reader is especially appropriate to assay large samples and amenable to high-throughput data collection. For example, over 330 samples were detected by colorimetric assay with a microplate reader in this study; each measurement was made in sextuplicate. The intracellular iron loading was thus quantified using the colorimetric assay.
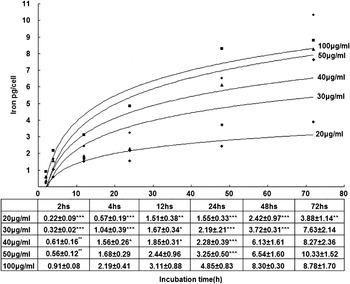
The mean cellular iron loading (pg Fe/cell) of RAW264.7 was assessed by the colorimetric assay after cells were treated with the nanoparticles. Because RAW264.7 cells were chosen to evaluate the intravascularly administered iron nanoparticles, it was evaluated in more detail than other calls. In this study, RAW264.7 cells were treated with the nanoparticles at five different doses (20, 30, 40, 50, and 100 μg/mL) for six various times (2, 4, 12, 24, 48, and 72 h). The results are displayed in Fig. 5. It is obvious that the cellular iron loading increased with the treating time. However, after incubation for about 24 h, the velocity of iron loading came to decrease and reached a slowly increased plateau phase. It seems that the cells were saturated by the nanoparticles, and the nanoparticles were taken up by an “adsorptive endocytosis” pathway.Reference Kalambur, Longmire and Bischof35 In particular, such saturable plateau phase also appeared in the cells incubated with the low concentrations (20, 30 μg/mL) of the nanoparticles. This phenomenon revealed that the most important determinant to the cellular iron loading is the concentration of the nanoparticles, not the incubation time.
Iron loading assay of RAW264.7. Cells were incubated with the nanoparticles at concentrations of 20, 30, 40, 50, and 100 μg/mL for 2, 4, 12, 24, 48, and 72 h. The uptake of the nanoparticles represented as a function of incubation time. The results are mean ± SD from six independent experiments.

Some previous studies revealed that the intracellular uptake of iron nanoparticles was closely related to the clustering of nanoparticles on the cell surface. The scanning electron microscopy (SEM) and TEM observations indicated that the differential endocytosis was obviously associated with the adhesion capability of iron nanoparticles to the cell surface.Reference Jordan, Scholz, Wust, Schirra, Schiestel, Schmidt and Felix38, Reference Ho, Barcza, Chen, Müller, Darton and Slater39 The quantity of intracellular uptake of iron nanoparticles was dependent on the amount of the aggregates of iron nanoparticles on the cell surface. The cells with a minor amount of nanoparticles on the cell membrane had the low nanoparticle uptake; while the cells with many nanoparticles on their surface had the high nanoparticle uptake.Reference Jordan, Scholz, Wust, Schirra, Schiestel, Schmidt and Felix38 SEM observation revealed that iron nanoparticles attached to cell surface in many aggregates were important to their internalization. The results of this study are in agreement with these SEM and TEM observations. The increase of the nanoparticles’ concentration in culture medium can promote the aggregation of the nanoparticles on the cell surface, and the aggregates of the nanoparticles induce cell endocytosis.
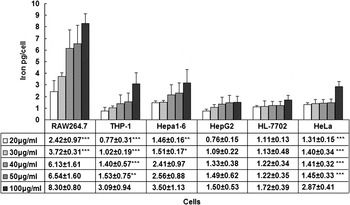
The cellular iron loading of the other five different cell lines, including THP-1, Hepa1-6, HepG2, HL-7702, and HeLa, were also systematically measured using the colorimetric assay. For comparisons, six cell lines were all treated with the nanoparticles at five different doses (20, 30, 40, 50, and 100 μg/mL) for 48 h. The results are displayed in Fig. 6. It is obvious that the cellular iron loading of each kind of cell lines increased with the concentration of the nanoparticles. The intracellular uptake of the nanoparticles was closely related to the cell types. At any concentration of the nanoparticles, the iron loading of RAW264.7 was significantly higher than that of other cell lines. For example, at a concentration of 100 μg/mL the iron loading of RAW264.7 was 8.30 ± 0.80 pg/cell, which was ~3 to 4 times higher than that of THP-1, Hepa1-6, HepG2, HL-7702, and HeLa (3.09 ± 0.94, 3.50 ± 1.13, 1.5 ± 0.53, 1.72 ± 0.39, and 2.87 ± 0.41 pg/cell, respectively). The iron loading of RAW264.7, THP-1, Hepa1-6, and HeLa significantly increased with the concentration of the nanoparticles, while that of HepG2 and HL-7702 did not significantly change with the concentration of the nanoparticles. However, the uptake of the nanoparticles was at the same order of magnitude in all cell lines. These results suggest that the nanoparticles may be used to label a wide variety of cells in vitro and in vivo.
Iron loading assay of RAW264.7, Hepa1-6, THP-1, HepG2, HL-7702, and HeLa. Cells were incubated with the nanoparticles at concentrations of 20, 30, 40, 50, and 100 μg/mL for 48 h. The results are mean ± SD from six independent experiments.

The hepatocytes are of importance to the evaluation of hepatotoxicity of novel agents. It was interesting that both the human hepatoma cells (HepG2) and liver cells (HL-7720) showed a similar lowest iron loading. Along with the increase of the nanoparticles’ concentration from 20 to 100 μg/mL, the iron loading of both cell lines showed no significant increase. This implies that the nanoparticles may be ingested by the hepatocytes in a low amount; even the nanoparticles are intravascularly administered at a very high dose such as 100 μg/mL. The final concentrations (20, 30, 40, 50, and 100 μg/mL) of the nanoparticles used in this study encompassed the blood concentration of an MRI contrast (Combidexe, Advanced Magnetics, Inc., Cambridge, MA) achieved during human studies. The Combidexe was injected into humans at 2.6 mg Fe per kg body weight, which corresponds to a blood concentration of ~0.03 mg/mL Fe.Reference Shaw, Westly, Pittet, Subramanian, Schreiber and Weissleder1, Reference Harisinghani, Barentsz, Hahn, Deserno, Tabatabaei, van de Kaa, de la Rosette and Weissleder40 Therefore, it is reasonable to deduce that the nanoparticles may be little stocked by hepatocytes in clinical application.
D. Evaluation of effects of the nanoparticles on cell viability
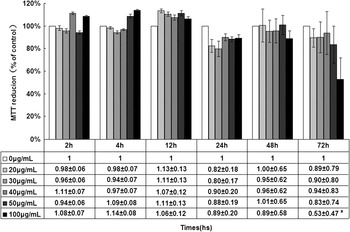
The effect of MNPs on cell viability was assessed using MTT assay. The RAW264.7 cells were exposed to MNPs at various concentrations (0, 20, 30, 40, 50, and 100 μg/mL) for different times (2, 4, 12, 24, 48, and 72 h). The results of the MTT assay are shown in Fig. 7. It demonstrated that the cell viability of RAW264.7 was not significantly affected by the incubations with the nanoparticles at concentrations of 20, 30, 40, and 50 μg/mL for 2, 4, 12, 24, and 48 h. However, the long incubation time (72 h) with the highest concentration (100 μg/mL) of the nanoparticles resulted in the significant decrease of cell viability.
Cell viability assay of RAW264.7. Cells were treated with the nanoparticles at concentrations of 20, 30, 40, 50, and 100 μg/mL for 2, 4, 12, 24, 48, and 72 h. The viability of the blank control cells was considered 100%. The results are mean ± SD from six independent experiments. The statistical analysis was performed by comparing treated group with blank control group. * = P < 0.05.

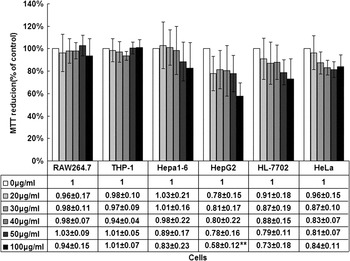
Other cells, including THP-1, Heap1-6, HepG2, HL-7702, and HeLa, were exposed to the nanoparticles at various concentrations for 48 h for evaluating the cell viability. The cell viability of these cells was compared with that of RAW264.7. The results are shown in Fig. 8. It demonstrated that the cell viability of RAW264.7 and THP-1 was not significantly (p > 0.05) affected by the various concentrations of the nanoparticles. It also showed that the increase of the nanoparticles’ concentration resulted in a slight decrease of cell viability of Hepa1-6, HepG2, HL-7702, and HeLa, although the decrease was not significant (p > 0.05), except for HepG2 treated by the nanoparticles at the highest concentration of 100 μg/mL. These results revealed that all cells investigated in this study had high endurance to the treatment of the nanoparticles at various concentrations; this suggests that the nanoparticles had better biocompatibility.
Cell viability assay of of RAW264.7, THP-1, Heap1-6, HepG2, HL-7702, and HeLa. Cells were treated with the nanoparticles at various concentrations for 48 h. The viability of the blank control cells was considered 100%. The results are mean ± SD from six independent experiments. The statistical analysis was performed by comparing the treated group with the blank control group. ** = P < 0.01.

IV. CONCLUSION
This study systematically investigated the cell labeling of 12-nm DMSA-coated Fe3O4 nanoparticles with multiple mammalian cell lines, including RAW264.7, Hepa1-6, THP-1, HepG2, HeLa, and HL-7702. The results showed that the nanoparticles labeled all studied cells with different labeling efficiency, which depended on the cell types, the nanoparticles’ concentration, and the time of incubating cells with the nanoparticles. The cell viability of all cells was not significantly affected by the nanoparticles at a dose of <100 μg/mL. These results are in agreement with the previous studies, which revealed that the Fe3O4 was a commonly used biocompatible material for preparation of magnetic nanoparticles, and the Fe3O4 nanoparticles were approved by the Food and Drug Administration (FDA) as an MRI contrast agent due to their minimal toxicity.Reference Tiefenauer and Vo-Dinh5, Reference Bacon, Stark, Park, Saini, Groman, Hahn, Compton and Ferrucci41, Reference Weissleder, Stark, Engelstad, Bacon, Compton, White, Jacobs and Lewis42 In conclusion, the 12-nm DMSA-coated Fe3O4 nanoparticles provide a potential agent to cell labeling for in vivo biomedical application.
ACKNOWLEDGMENT
This investigation was funded by the National Important Science Research Program of China (No. 2006CB933205).