Conduct problems and antisocial behaviors place significant social and financial burden on society (Moffitt, Caspi, Harrington, & Milne, Reference Moffitt, Caspi, Harrington and Milne2002), and as a result, the identification of etiological factors has been the focus of intense empirical scrutiny for over a century. Current theories suggest that both biological and social risk factors contribute to antisocial behavior (Moffitt, Reference Moffitt1993; Raine, Reference Raine2002), and recent studies suggest that particular genotypes may interact with the social environment to predict aggression, conduct problems, and antisocial outcomes (Brennan et al., Reference Brennan, Hammen, Sylvers, Bor, Najman and Lind2011; Caspi et al., Reference Caspi, McClay, Moffitt, Mill, Martin and Craig2002).
In the human literature, one potentially relevant gene that has not garnered much attention in the prediction of antisocial outcomes is the oxytocin receptor gene (OXTR). This omission is surprising, given the links between the oxytocin hormone and behavior relating to social interaction and affiliation highlighted in the empirical literature and in the popular press (Bartz, Zaki, Bolger, & Ochsner, Reference Bartz, Zaki, Bolger and Ochsner2011; Yong, Reference Yong2012). Existing theory and human and animal studies support positive associations between oxytocin and prosocial behaviors such as maternal–infant bonding (Gordon et al., Reference Gordon, Zagoory-Sharon, Schneiderman, Leckman, Weller and Feldman2008; Lim & Young, Reference Lim and Young2006), empathy (Barraza & Zak, Reference Barraza and Zak2009), and trust (Gonzaga, Turner, Keltner, Campos, & Altemus, Reference Gonzaga, Turner, Keltner, Campos and Altemus2006), making it potentially relevant in the prediction of antisocial behaviors as well. Two reports to date have examined associations between OXTR polymorphisms and antisocial outcomes, and these focused only on children with persistent, severe aggressive behavior (Beitchman et al., Reference Beitchman, Zai, Muir, Berall, Nowrouzi and Choi2012; Malik, Zai, Abu, Nowrouzi, & Beitchman, Reference Malik, Zai, Abu, Nowrouzi and Beitchman2012).
Although the popular press may dub oxytocin “the love hormone,” recent studies suggest that the effects of oxytocin on human behavior are more complex and dependent on environmental context. For example, intranasal administration of oxytocin heightens feelings of envy during a gambling game (Shamay-Tsoory et al., Reference Shamay-Tsoory, Fischer, Dvash, Harari, Perach-Bloom and Levkovitz2009) and results in reduced trust and cooperation among individuals sensitive to rejection (Bartz, Simeon, et al., Reference Bartz, Simeon, Hamilton, Kim, Crystal and Braun2011). Oxytocin administration also increases ethnocentric behavior, resulting in greater preference toward ingroup members and derogation toward outgroup members (De Dreu et al., Reference De Dreu, Greer, Handgraaf, Shalvi, Van Kleef and Baas2010). In a recent review of the oxytocin literature, Bartz, Zaki, et al. (Reference Bartz, Simeon, Hamilton, Kim, Crystal and Braun2011) proposed the social salience hypothesis, suggesting that rather than increasing trust or positive affiliation, oxytocin may increase an individual's sensitivity to, and thus potential reactivity toward, the social environment. Neuroimaging data further supports the role of oxytocin in heightening the salience of socially positive or negative but not socially neutral stimuli, and specific brain regions such as the ventral tegmental area have been implicated (Groppe et al., Reference Groppe, Gossen, Rademacher, Hahn, Westphal and Gründer2013).
Although originating from the oxytocin hormone literature, the social salience hypothesis appears to be consistent with findings in the genetic literature as well, and in particular, findings concerning the rs53576 polymorphism of the OXTR gene. Similar to the oxytocin hormone literature, initial candidate gene studies of rs53576 reported more positive, prosocial outcomes among certain individuals with the G allele, compared to those with the A allele, such as higher levels of prosocial and trusting behaviors (Kogan et al., Reference Kogan, Saslow, Impett, Oveis, Keltner and Rodrigues Saturn2011; Krueger, Reference Krueger, Parasuraman, Iyengar, Thornburg, Weel and Lin2012), increased empathy (Rodrigues, Saslow, Garci, John, & Keltner, Reference Rodrigues, Saslow, Garcia, John and Keltner2009), and greater sensitivity to an infant's cry (Riem, Pieper, Out, Bakermans-Kranenburg, & van IJzendoorn, Reference Riem, Pieper, Out, Bakermans-Kranenburg and van IJzendoorn2011). Many of the initial genetic studies were conducted in healthy samples, and a recent meta-analysis casts doubt on direct effects of OXTR genotypes on prosocial behavior (Bakermans-Kranenburg & van IJzendoorn, Reference Bakermans-Kranenburg and van IJzendoorn2013). While the biological function of the rs53576 polymorphism has yet to be delineated, results from Gene × Environment interaction studies of OXTR highlight the importance of the social context and suggest that individuals with the G allele may be better characterized as more attentive to social cues, rather than prosocial in nature. For example, Bradley et al. (Reference Bradley, Westen, Mercer, Binder, Jovanovic and Crain2011) found that people with the G allele, compared to AA individuals, exhibited heightened emotion dysregulation following exposure to childhood abuse. Individuals with the G allele were more physiologically responsive than AA individuals to social support in a stressful context (Chen et al., Reference Chen, Kumsta, von Dawans, Monakhov, Ebstein and Heinrichs2011) and were more likely to seek out social support during stress, though only if it was culturally appropriate (Kim et al., Reference Kim, Sherman, Sasaki, Xu, Chu and Ryu2010). These interaction effects suggest that G carriers may be more attentive to social cues, and thus they may be more vulnerable in the context of adverse social situations. Given that even in normal adult populations, hypersensitivity to social cues is linked to higher levels of negative affect and greater fluctuations in negative affect and self-esteem, increased social salience combined with a negative social environment could readily lead to antisocial behavior, particularly in an at-risk population.
Thus, the current study sought to examine whether the rs53576 polymorphism interacts with social stress to predict conduct problems and antisocial behaviors in a high-risk sample of youth. The sample was considered specifically high risk because a high proportion of youth were exposed to maternal depression earlier in life. To our knowledge, there are no published studies examining this specific gene–environment interaction with respect to antisocial outcomes in humans. The behavioral genetics literature suggests that genetic effects may differentially impact the manifestation of adolescent and adult antisocial behaviors (Rhee & Waldman, Reference Rhee and Waldman2002). Therefore, our study sought to examine whether the OXTR rs53576 polymorphism interacted with current social stress to predict conduct and antisocial behaviors at two different developmental time points: age 15 and age 20. We hypothesized a Gene × Environment interaction such that individuals with the rs53576 G allele would be more likely to evidence conduct and antisocial behaviors in the presence of current social stress. We further explored developmental differences by comparing findings for outcomes at age 15 versus age 20.
Methods
Participants
Participants were 404 Caucasian youth (n = 237 females) drawn from a large prospective birth cohort of children (N = 7,223) born between 1981 and 1984 at the Mater Misericordiae Mother's Hospital in Brisbane, Australia (Najman et al., Reference Najman, Bor, O'Callaghan, Williams, Aird and Shuttlewood2005). A sample of 815 mothers and children were recruited from the original birth cohort on the basis of varying histories of maternal depression measured longitudinally through age 5 (Hammen & Brennan, Reference Hammen and Brennan2001). Approximately two-thirds of the children were chosen on the basis of medium to high levels of maternal self-reported depression, and one-third were chosen on the basis of low levels of maternal self-reported depression. This “high-risk” sample of children was assessed at age 15 (N = 815) and again at age 20 (N = 747), and DNA was collected at ages 22–25 (N = 512). Of the youth eligible for DNA collection based on their previous participation in either the age 15 or age 20 follow-ups, 63 could not be located and 173 either actively or passively refused participation in the DNA collection.
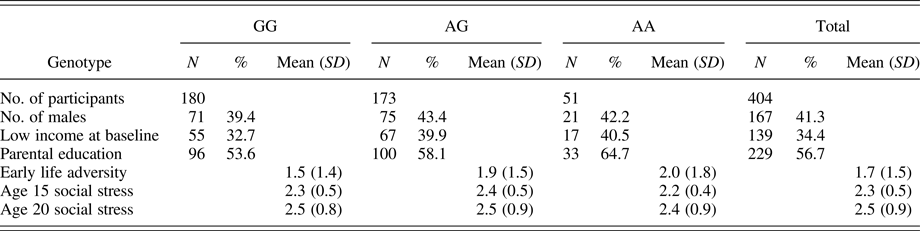
Inclusion criteria for the current study included participation in the age 15 follow-up, the availability of genetic data for analysis, and Caucasian ethnicity due to differences in oxytocin receptor gene allele frequencies noted across ethnic groups (e.g., Kim et al., Reference Kim, Sherman, Sasaki, Xu, Chu and Ryu2010). Participants included in the current study did not differ from the overall birth cohort in terms of mother education, t (df = 7164) = –0.76, p = .45, family income, t (df = 6747) = 0.09, p = .93, or number of siblings, t (df = 6667) = –0.87, p = .38. However, there were significantly more females in the current study (59%) than in the original birth cohort (48%), χ2 (N = 7223) = 22.36, p < .001. A similar pattern was noted when comparing participants in the current sample to those in the high-risk depression cohort established at age 15 (N = 815). The two samples were similar in terms of maternal education, t (df = 808) = 0.199, p = .84, family income, t (df = 764) = 0.215, p = .83, and number of siblings, t (df = 810) = –0.891, p = .84, but differed with respect to gender, χ2 (N = 815) = 32.57, p < .001, with more females in the current sample. Sample descriptions are provided in Table 1.
Descriptive statistics by OXTR rs53576 genotype

Note: The amount of missing data varied and ranged from 0 to 42 missing data points for early life adversity (12 GG, 23 AG, and 7 AA). Low income represents the percentage of participants with family incomes under $10,400 Aus per year, parental education represents the number and percentage with the equivalent of a high school degree or less, early life adversity is a sum of the number of adversities experienced in childhood ranging from 0 to 6, and social stress is derived from the chronic stress interview and ranges from 1 (no stress) to 5 (exceptional social stress). OXTR, Oxytocin receptor gene.
Procedures
Multimethod assessments of youth behavior and family functioning, based on clinical interviews and questionnaires, were conducted at ages 15 and 20. Family interviews were conducted in the participants’ homes by teams of two graduate-level students who were blind to mother's psychiatric history. Mothers and their children were interviewed separately. Mothers provided written informed consent for themselves and their children at age 15, and the youth provided verbal assent. For subsequent visits, all participants provided written informed consent. All procedures were approved by the University of California, Los Angeles (UCLA) Institutional Review Board, Emory University Institutional Review Board, and the University of Queensland Ethics Review Committee.
Measures
Youth conduct problems at age 15
At age 15, youth completed the Achenbach Youth Self-Report (YSR), which contains 112 items that assess the frequency with which the youth engaged in various maladaptive behaviors in the last 6 months. Mothers completed the Achenbach Child Behavior Checklist (CBCL; Achenbach & Edelbrock, Reference Achenbach and Edelbrock1983), which consists of a similar set of 113 maladaptive behaviors items. Responses for items on both measures are coded as 0 (never/rarely), 1 (sometimes), and 2 (almost always). The YSR and CBCL are widely used, empirically validated measures with high internal consistency (α = 0.78–0.97) and adequate test–retest reliability (e.g., r = .83 for 15- to 18-year-olds; Achenbach, Reference Achenbach1991). DSM-oriented conduct disorder symptom scales were calculated from the CBCL and YSR as specified by Achenbach and Rescorla (Reference Achenbach and Rescorla2003). Sample items on the conduct disorder scale include whether the child is mean to others, gets in fights or arguments, threatens others, destroys or vandalizes property, breaks rules, lies, or swears. Youth (YSR) and maternal (CBCL) reports of conduct disorder demonstrated adequate internal reliability (α = 0.80 and 0.87, respectively).
Clinical research interviewer ratings of conduct disorder were based on a semistructured interview data using the Schedule for Affective Disorders and Schizophrenia for School-Aged Children, Epidemiological Version (KSADS-E; Orvaschel, Reference Orvaschel1995). The KSADS-E was administered to youth during home visits, and a clinical research team assigned consensus diagnoses of conduct disorder (present versus absent) based on reviews of each recorded interview. Seventy-five of the KSADS-E interviews were selected for reliability ratings by a second clinician blind to original diagnoses. All interrater reliability ratings were acceptable (κ > 0.7).
Youth antisocial behavior at age 20
At age 20, youth completed the Adult Self-Report (ASR; Achenbach & Rescorla, Reference Achenbach and Rescorla2003) and mothers completed the Adult Behavior Checklist (ABCL; Achenbach & Rescorla, Reference Achenbach and Rescorla2003). Similar to the YSR completed at age 15, the 126-item ASR measures the participant's self-reported frequency of maladaptive behaviors using a scale of 0 (not true), 1 (somewhat or sometimes true), and 2 (very true or often true). The ABCL is completed by an informant, in this case the mother, and measures similar constructs to the CBCL collected at age 15. Example items on the antisocial personality problems subscales of the ASR and the ABCL include whether the youth argues a lot, is mean to others, breaks rules, fights with others, and threatens others. Item responses on the DSM-oriented subscales for antisocial personality problems were summed for both the ASR and the ABCL. Adequate internal reliability in these scales was noted (youth-report ASR α = 0.83, maternal-report ABCL α = 0.90).
Clinician ratings of antisocial behavior were based on the administration of the Structured Clinical Interview for DSM-IV Axis II disorders (SCID-II; First, Gibbon, Spitzer, Williams, & Benjamin, Reference First, Gibbon, Spitzer, Williams and Benjamin1997). Counts of antisocial personality disorder symptoms (e.g., “Do you often find that you have to lie to get what you want?”), coded as “present” by the interviewer, were summed to reflect the clinician-rated variable of antisocial behavior at age 20. Consistent with the standard administration of the SCID-II (First et al., Reference First, Gibbon, Spitzer, Williams and Benjamin1997), individuals who did not endorse the necessary amount of relevant preinterview screener items, which assess past conduct problems, a criteria for antisocial personality disorder, were not administered the SCID-II antisocial personality disorder questions and thus received a zero for symptom count.
Social stress at age 15 and 20
Youth were administered the UCLA Life Stress Interview at ages 15 and 20, which has been utilized in previous research with diverse populations (Hammen, Reference Hammen1991), including multiple studies with adolescents and young adults (Adrian & Hammen, Reference Adrian and Hammen1993; Rao, Hammen, & Daley, Reference Rao, Hammen and Daley1999). The interviewer inquired about the youth's ongoing chronic stress over the last 6 months and rated the severity using 5-point, behaviorally anchored scales in each of several domains: social life, close friendships, romantic relationships/dating interests, relationships with family members, academic performance, occupational experiences, personal health, and health of close family members. In the current study, the social life domain score was used to capture current social problems in peer relationships (e.g., “Are there people you can go out with,” “Are you lonely,” “How often do you get invited to social activities”). Scores on this scale ranged from 1 to 5, with higher scores indicating greater stress. For chronic stress at age 15, interclass correlation coefficients ranged from 0.63 to 0.94, and for age 20, they ranged from 0.72 to 0.88 (Hammen, Hazel, Brennan, & Najman, Reference Hammen, Hazel, Brennan and Najman2012).
Youth early adversity
Given the high-risk nature of the sample and noted associations between early childhood adversity and conduct problems (Chronis et al., Reference Chronis, Lahey, Pelham, Williams, Baumann and Kipp2007; Fergusson, Horwood, & Lynskey, Reference Fergusson, Horwood and Lynskey1994; Greenberg, Speltz, Deklyen, & Jones, Reference Greenberg, Speltz, Deklyen and Jones2001), early adversity was included to assess its potential independent contribution to antisocial outcomes. Youth early adversity was determined using information provided by the mother at pregnancy, birth, 6-month, and 5-year assessments. This variable has been used in our previous work (e.g., Hazel, Hammen, Brennan, & Najman, Reference Hazel, Hammen, Brennan and Najman2008), and it reflects the following adversities: maternal Axis I diagnosis prior to age 5 (primarily maternal depression), financial hardship, parental discord, maternal stressful life events, serious childhood illness, and maternal separation from partners. The continuous variables were recoded as a binary variable above or below the 33rd percentile, and the remaining variables were coded for presence or absence. Variables were then summed to reflect the total number of adversities, with scores ranging from 0 (no adversity) to 6 (all of the aforementioned adversities were present).
Genotyping
Participants who agreed to participate in blood collection were mailed consent forms, questionnaires, and a blood collection pack. Blood was drawn at local pathology clinics, and the samples were then transported to the Genetic Epidemiological Laboratory of the Queensland Institute of Medical Research, where the DNA was stored and extracted. For the current study, aliquots of DNA were shipped to UCLA for genotyping by the UCLA Social Genomics Core of the USC/UCLA Biodemography Center. Individual status on the OXTR rs53576 polymorphism was assayed by a commercial TaqMan Genotyping Assay (Applied Biosystems, Foster City, CA) performed on an iCycler real-time polymerase chain reaction instrument (BioRad, Hercules, CA), following the manufacturer's specified protocol. Test–retest reliability of duplicated samples yielded a total genotyping error rate less than 1%. Genotype distributions were GG = 180 (44.6%), AG = 173 (42.8%), and AA = 51 (12.6%), and were in Hardy–Weinberg equilibrium, χ2 (2, N = 404) = 0.87, p = ns.
Data analysis strategy
Structural equation modeling (SEM; Arbuckle, Reference Arbuckle2011) with AMOS 20.0 was used to test our primary hypothesis that the OXTR genotype and current levels of social stress would interact to predict conduct and antisocial behavior outcomes. Dependent measures were latent factors of youth-, maternal-, and clinician-rated conduct and antisocial behavior outcomes at ages 15 and 20. Independent variables (genotype and current social stress) were centered to reduce problems of multicollinearity, and centered variables were multiplied to create interaction terms. When hypothesized interaction terms were significant, a median split on current social stress was used to interpret the direction of the interaction effect.
As indicated above, extensive previous research (Chronis et al., Reference Chronis, Lahey, Pelham, Williams, Baumann and Kipp2007; Fergusson et al., Reference Fergusson, Horwood and Lynskey1994; Greenberg et al., Reference Greenberg, Speltz, Deklyen and Jones2001) justified the inclusion of early adversity as a potential confound. Given the well-known gender differences in rates of conduct and antisocial behaviors, gender was also tested as a potential covariate. Early adversity and gender were significantly associated with the outcomes (p < .05) and were therefore retained in all models.
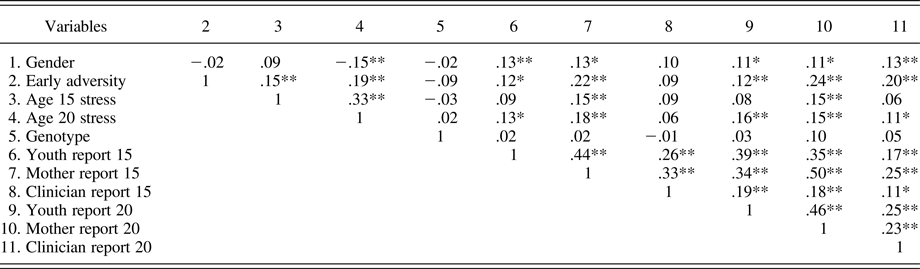
Early adversity and mother and youth ratings of conduct problems and antisocial behaviors were square root transformed to provide normalized distributions. Table 2 presents the correlations between all study variables. Significant correlations between predictors were accounted for in the SEM. OXTR genotype was not correlated with any of the covariates nor social stress at age 15 and age 20 (p > .05).
Correlations between variables
Note: Gender is coded as 1 = male and 0 = female. Early adversity and mother and youth ratings of conduct problems and antisocial behaviors are square root transformed.
*p < .05. **p < .01.
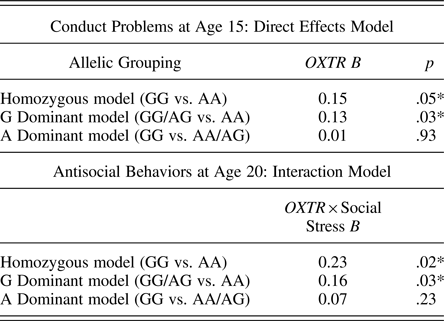
Because the biological function of the rs53576 polymorphism has yet to be delineated, and the literature is mixed in regards to heterozygote (AG) grouping, the implications for AG grouping are not well understood. We initially tested all models using only homozygous (GG and AA) individuals. Follow-up analyses compared G-dominant (GG/AG vs. AA) and A-dominant (GG vs. AG/AA) allelic groupings to the homozygous grouping models.
Model fit was assessed using the χ2 index, the comparative fit index (CFI), and the root mean square of approximation (RMSEA) and its 90% confidence interval. The χ2 index tests the discrepancies between the population covariance and the covariance predicted by the model, where a nonsignificant χ2 indicates a good, nondiscrepant fit (Hooper, Coughlan, & Mullen, Reference Hooper, Coughlan and Mullen2008). The CFI compares the model of interest with the independence model while taking the sample size into account. CFI values range from 0 to1 with those over 0.95 indicating an adequate fit (Hu & Bentler, Reference Hu and Bentler1999). RMSEA compares how well the model estimates fit the population covariance matrix (Browne, Cudeck, Bollen, & Long, Reference Browne, Cudeck, Bollen and Long1993), where values less than 0.5 indicate a good fit (Hu & Bentler, Reference Hu and Bentler1999; Kline, Reference Kline2010).
Results
Age 15 conduct problems
Despite good model fit, χ2 (17, N = 231) = 11.97, p = .80, CFI = 1.0, RMSEA = 0.00 (90% CI = 0.00–0.04), our hypothesis that OXTR would interact with social stress to predict conduct problems at age 15 was not supported, because the interaction term was nonsignificant (p = .79). Correlated predictors for this model included early adversity and social stress, the interaction term and genotype, and the interaction term and social stress. Removing the interaction term, the model fit remained adequate, χ2 (13, N = 231) = 11.58, p = .56, CFI = 1.0, RMSEA = 0.00 (90% CI = 0.00–0.06), and the main effect of OXTR genotype on conduct problems was significant, with GG individuals exhibiting higher levels of conduct problems compared to AA individuals at age 15 (β = 0.15, p = .05). Correlated predictors for this model included early adversity and social stress.
Age 20 antisocial problems
As predicted, there was a significant interaction between OXTR rs53576 genotype and current social stress to predict antisocial behavior at age 20 (β = 0.21, p = .014; see Figure 1). The OXTR and social stress interaction model provided adequate fit, χ2 (16, 231) = 23.0, p = .11, CFI = 0.92, RMSEA = 0.04 (90% CI = 0.04–0.08). Correlated predictors in this model included early adversity and social stress, gender and social stress, the interaction term and genotype, and the interaction term and social stress. A median split on current social stress revealed that GG individuals were more likely than AA individuals to exhibit antisocial behaviors in the presence of high social stress (β = 0.32, p = .020) but not low social stress (β = 0.10; p = .10; see Figure 1). Both low and high social stress models provided adequate fit, low social stress: χ2 (9, N = 111) = 2.63, p = .98, CFI = 1.0, RMSEA = 0.00 (90% CI = 0.00–0.00); high social stress: χ2 (9, N = 111) = 11.28, p = .26, CFI = 0.94, RMSEA = 0.05 (90% CI = 0.00–0.12). No correlations between predictors were included because they were nonsignificant.
(Color online) The influence of the oxytocin receptor gene (OXTR) rs53576 polymorphism on antisocial behaviors at age 20 in the presence of high versus low social stress: homozygous grouping (GG vs. AA). The sample was split into high and low social stress groups using the median as a cut point. Standardized betas are presented; those above the arrow are under conditions of high social stress, those below are under conditions of low social stress. In the path model, bold beta weights are significant at *p < .05. Given no significant intercorrelations identified between the predictors, none were included in the model. OXTR genotypes were coded as GG = 1 and AA = 0 and were centered on the mean. Early adversity is a square root transformed combination score of adverse early life events, where higher values represent greater adversity.
Allelic grouping
Heterozygous groupings (G-dominant and A-dominant) were compared to the homozygous models described above, including the main effect of OXTR on conduct problems at age 15 and the interaction of OXTR and social stress at age 20 (see Table 3). Correlated predictors in the original models above were retained. All age-15 models provided good fit: G-dominant grouping: χ2 (13, N = 404) = 7.75, p = .86, CFI = 1.0, RMSEA = 0.00 (90% CI = 0.00–0.03); A-dominant grouping: χ2 (13, N = 404) = 12.55, p = .48, CFI = 1.0, RMSEA = 0.00 (90% CI = 0.00–0.05). The association between OXTR and conduct problems remained significant in the G-dominant grouping (β = 0.13; p = .03) but lost significance when using A-dominant grouping (β = 0.01; p = .93). All age-20 interaction models provided adequate fit, G-dominant grouping: χ2 (16, N = 404) = 16.98, p = .39, CFI = 0.99, RMSEA = 0.01 (90% CI = 0.00–0.05); A-dominant grouping: χ2 (16, N = 404) = 28.12, p = .031, CFI = 0.93, RMSEA = 0.04 (90% CI = 0.01–0.07). Again, the G-dominant grouping was more consistent with the homozygous model, such that the interaction remained significant for the G-dominant grouping (β = 0.13; p = .03) but lost significance for the A-dominant grouping (β = 0.07; p = .23). A median split on current social stress, similar to that described above, further supported a G-dominant grouping, indicating that social stress was positively associated with antisocial behavior only among GG/AG individuals (see Figure 2).
(Color online) The influence of the oxytocin receptor gene (OXTR) rs53576 polymorphism on antisocial behaviors at age 20 in the presence of high versus low social stress: heterozygous grouping (GG/AG vs. AA). The sample was split into high and low social stress groups using the median as a cut point. Standardized betas are presented; those above the arrow are under conditions of high social stress, those below are under conditions of low social stress. In the path model, bold beta weights are significant at *p < .05. Given no significant intercorrelations identified between the predictors, none were included in the model. OXTR genotypes were coded as GG or AG = 1 and AA = 0 and were centered on the mean. Early adversity is a square root transformed combination score of adverse early life events, where higher values represent greater adversity.
Exploring allelic grouping for OXTR beta weights and p values in the homozygous, G dominant, and A dominant models
Note: Standardized beta weights are presented. OXTR, Oxytocin receptor gene.
*p < .05.
Discussion
Our study assessed whether the OXTR rs53576 polymorphism interacts with current social stress to predict conduct problems and antisocial behaviors at two developmental time points. Previous research suggests a mechanism of social sensitivity for rs53576 where those with the G allele, compared to the A allele, experience heightened social salience (Bartz, Zaki, et al., Reference Bartz, Zaki, Bolger and Ochsner2011; Kumsta & Heinrichs, Reference Kumsta and Heinrichs2013). The majority of published research examines main effects of OXTR polymorphisms on social behavior in healthy, nonclinical samples. More recent reports (Bradley et al., Reference Bradley, Westen, Mercer, Binder, Jovanovic and Crain2011; Sturge-Apple, Cicchetti, Davies, & Suor, Reference Sturge-Apple, Cicchetti, Davies and Suor2012) have also suggested that those carrying a G allele may demonstrate increased risk of maladaptive behaviors in the presence of social adversity. Results from the current study lend additional support to this hypothesis. At age 20, the OXTR polymorphism interacted with current levels of social stress such that G carriers exhibited higher levels of antisocial behaviors only in the presence of high social stress, while AA individuals did not significantly differ on antisocial behavior ratings across social stress levels.
Although there is limited research on the influence of OXTR on antisocial outcomes, previous literature demonstrates the important role of the interaction between a negative social environment and a specific genotype in the development of antisocial behavior (Caspi et al., Reference Caspi, McClay, Moffitt, Mill, Martin and Craig2002). Given that the current study is the first to report associations between OXTR rs53576 and antisocial/conduct-disordered behavior in adolescents, including a Gene × Environment interaction, these findings require replication before any clinical implications can be drawn. Although preliminary, our findings suggest that certain individuals carrying the G allele may be particularly sensitive to social stress and that the role of social support and peer-based interventions could ameliorate the risk of persistent antisocial behavior in these young adults.
Our age 20 findings are consistent with Dodge's social cognitive model of aggression. Dodge and colleagues (e.g., see Dodge & Pettit, Reference Dodge and Pettit2003, for review), and others, have published a body of literature that supports associations between social cognitive biases, such as a propensity to perceive threat and hostility, and increased likelihood of conduct disorder. They also suggest that individuals engaging in delinquent behavior often utilize a more limited behavioral repertoire (Dodge & Crick, Reference Dodge and Crick1990), so that when faced with social stress, they may be more likely to engage in antisocial behavior, even when their peers may have developed more adaptive behavioral strategies as they transition into adulthood. Heightened social salience (as evidenced by G allele carriers) may therefore lead to increased sensitivity to perceived negative cues from the social environment, contributing to negative, acting out behavior in young adults facing high social stress.
A significant proportion of our sample was already at risk for negative behavioral outcomes, given the maternal history of depression, and while early adversity also predicted antisocial behavior at age 20, the Gene × Environment interaction with current levels of social stress predicted negative outcomes above and beyond the influence of early adversity. This finding may suggest that while extensive empirical support for early intervention exists, intervention in young adults aimed at decreasing social stress and/or reducing an individuals' sensitivity to negative social cues could also be effective in reducing antisocial outcomes. Future studies should assess the unique and combined influences of early and current social adversity on antisocial outcomes and whether they interact with OXTR, in order to identify individuals at highest risk for negative outcomes in adulthood.
At age 15, only a genetic main effect was demonstrated, such that individuals with the G allele showed significantly higher levels of conduct problems, regardless of their current levels of social stress. This finding was unexpected and contradicts a recent study looking at several oxytocin-related genes in children (Malik et al., Reference Malik, Zai, Abu, Nowrouzi and Beitchman2012). This recent study looked only at childhood-onset, severe, persistent aggression and failed to find significant effects for the rs53576 polymorphism. Developmental context may be useful in explaining our results. As per Moffitt (Reference Moffitt1993), empirical data suggest that antisocial behavior is more normative in midadolescence, in large part because it is highly socially rewarding. It might be the case, then, that 15-year-olds who are more sensitive to social cues (i.e., the G-allele carriers) might also be more sensitive to social rewards for delinquency and more likely to display conduct problems overall. Another possible explanation for our age 15 findings is the high-risk nature of our cohort, which may have restricted our ability to examine the moderating effects of current social stress. Furthermore, the mean score for social stress was slightly lower at age 15 than at age 20, potentially suggesting that at age 15, lower stress levels mitigated an interaction effect. Further research is necessary to fully understand implications for developmental theory, prevention, or treatment.
The rs53576 polymorphism has not been well studied in adolescence, with the majority of previous studies reporting an average participant age of college age or older (Krueger et al., Reference Krueger, Parasuraman, Iyengar, Thornburg, Weel and Lin2012; Rodrigues et al., Reference Rodrigues, Saslow, Garcia, John and Keltner2009). Our study identified differential genetic influences at age 15 and age 20, highlighting the importance of studying such Gene × Environment interactions in a developmental context using longitudinal data. The different findings between these age groups support the suggestion by Rhee and Waldman (Reference Rhee and Waldman2002) that genes may differentially influence antisocial behaviors in adolescence versus adulthood. The limited published data on OXTR polymorphisms during adolescence strongly suggests a need for replication in other prospective samples.
The biological function of allelic variance in rs53576 is not known, resulting in a lack of a clearly defined grouping method for heterozygous individuals. A majority of previous studies have grouped AG individuals with AA individuals, primarily due to sample size limitations. In the current study, we used an empirical approach to test the influence of heterozygote grouping, first conducting all analyses using only homozygous individuals and then reanalyzing the data to compare G-dominant (GG/AG vs. AA) versus A-dominant (GG vs. AG/AA) groupings. Our results indicated that the G-dominant grouping (GG/AG vs. AA) was more consistent with the homozygous models. This finding highlights the importance of addressing grouping in future studies, which may help delineate the biological function of OXTR polymorphisms.
Despite the preliminary nature of these data, the current study makes a novel contribution to the etiology of antisocial behavior across an important developmental period, highlighting OXTR’s role in conduct and antisocial behaviors. However, these findings should be interpreted in the context of the following limitations. First, the sample is relatively small in comparison to other Gene × Environment designs, which highlights the concern for spurious findings and need for replication (Duncan & Keller, Reference Duncan and Keller2011). These findings should be considered preliminary pending replication. The sample is on the larger end of studies assessing behavioral associations with OXTR, which often range from 100 to 400 subjects (Krueger et al., Reference Krueger, Parasuraman, Iyengar, Thornburg, Weel and Lin2012; Rodrigues et al., Reference Rodrigues, Saslow, Garcia, John and Keltner2009; Saphire-Bernstein, Way, Kim, Sherman, & Taylor, Reference Saphire-Bernstein, Way, Kim, Sherman and Taylor2011); and the subsample of AA individuals is sufficiently large to assess research questions surrounding allelic grouping, a limitation expressed in a number of previous studies. Furthermore, as with all gene–behavior association studies, our candidate gene accounts for only a small percentage of the variance of the outcome. Antisocial behavior has been reported to have a heritability of 0.5 (Rhee & Waldman, Reference Rhee and Waldman2002). Therefore, our results similarly reflect the concept of missing heritability, whereby individual genes account for a small proportion of the expected overall inherited variance (Manolio et al., Reference Manolio, Collins, Cox, Goldstein, Hindorff and Hunter2009). Other influences that may be important to consider in future studies are epistatic and epigenetic phenomena (Slatkin et al., Reference Slatkin2009). Second, different clinical questionnaires were used to evaluate conduct problems at age 15 (e.g., YSR) and antisocial behaviors at age 20 (e.g., ASR). These differences were due to measurement variation in the child and adolescent versus adult versions of the questionnaires and interviews. However, the questionnaires tap into similar behavioral constructs, and there is significant item overlap. Third, it is possible that the clinician-completed SCID-II measure of antisocial behavior symptom count may underrepresent age 20 antisocial behaviors for youth who did not meet the necessary amount of relevant screener questions. Therefore, it is possible that those individuals who were given a score of 0 may have endorsed some of the antisocial questions had they been administered this assessment regardless of screener criteria. However, standard protocol for SCID-II administration and antisocial personality disorder assessment were followed (First et al., Reference First, Gibbon, Spitzer, Williams and Benjamin1997), making these findings more translatable to what may be found in clinical practice. Furthermore, given the use of SEM for data analysis, the potential gap arising from the standard administration of this measure should be captured through the incorporation of the youth and maternal Achenbach measures included in the antisocial latent construct. Fourth, the time point at which the genetic data was collected (age 25) may have contributed to increased attrition. While minimal differences between the larger at-risk cohort and those who contributed genetic data do not have direct implications for our findings (i.e., greater number of females), collecting genetic data when the adolescents were still living at home may have increased follow-up rates and reduced potential sampling bias. Fifth, social stress was collected concurrently with behavioral outcomes at both time points, which tempers our ability to make causal inferences in our hypothesized associations. However, our data collection strategy is consistent with our hypothesis that current social stress would be influential in changing behavior in genetically at-risk youth.
The following methodological and statistical considerations strengthen the preliminary findings reported in the current study: (a) using a multimethod approach, including self-report, parent-report, and clinician-report data, enhanced the validity of the behavioral constructs while reducing sampling bias; (b) the use of SEM strengthened our analytical approach by reducing the inherent error that exists when using a single scale to approximate a construct and thus allowed for a more robust test of our hypotheses; (c) the longitudinal, prospective nature of the data facilitated our ability to meaningfully interpret differences at age 15 versus age 20 and allowed us to incorporate important covariates, such as early adversity measured prospectively, to help tease apart environmental influences on antisocial behavior; and (d) the use of a data-driven method for allelic grouping makes an innovative contribution to the OXTR literature.
Although significant research efforts have sought to understand the transition from childhood to adolescence, the period between adolescence and adulthood has been surprisingly understudied. The present findings shed light on the role of OXTR in the etiology of conduct disorder and antisocial behavior, and highlight the importance of studying Gene × Environment interactions in a developmental context.