Implications
Space allowance and floor type are two of the major factors affecting animal performance and welfare during housing. There are on-going suggestions to increase the space allowance provided to beef cattle on concrete slats or replace concrete slats with alternative flooring systems. This study confirms that increasing the space allowance provided to finishing heifers on concrete slats above 3.0 m2 has no effect on animal performance but does improve animal cleanliness. Regarding flooring, the study confirms that housing finishing heifers on straw instead of concrete slats does not affect carcass weight but has a positive impact on lying time.
Introduction
The conventional housing system for beef cattle in many European countries is a group pen with fully slatted concrete floors that require low labour inputs for waste removal compared with solid floors or straw bedding (Lowe et al., Reference Lowe, Steen, Beattie and Moss2001). Space allowance and floor type are identified as critical factors affecting the welfare of cattle housed indoors (Welfare Quality®, 2009). Furthermore, there have been suggestions that the space allowance for finishing cattle needs to be increased above 3.0 m2/animal (Wechsler, Reference Wechsler2011). A change of this magnitude would have a significant negative impact on the beef industry as the number of animals being housed by livestock producers in present housing facilities would have to be reduced significantly or, alternatively, additional housing facilities would be required.
Research addressing the welfare of finishing cattle is largely focused on measurements of animal performance (Keane et al., Reference Keane, McGee, O’Riordan, Kelly and Earley2015), immune function and behaviour (Earley et al., Reference Earley, McDonnell and O’Riordan2015), hoof lesions (Keane et al., Reference Keane, McGee, O’Riordan, Kelly and Earley2015) and animal cleanliness (Lowe et al., Reference Lowe, Steen, Beattie and Moss2001). Previous studies from our group showed that insufficient space allowance during housing had detrimental effects on cattle welfare and productivity. For example, Fisher et al. (Reference Fisher, Crowe, O’Kiely and Enright1997) reported that increasing space allowance from 1.5 to 2.0 m2/animal, for finishing heifers weighing 550 kg, improved average daily live weight gain (ADG) by 0.13 kg and increased their lying time by 1.5 h daily, however further improvements were not evident above 2.0 m2. Furthermore, Hickey et al. (Reference Hickey, Earley and Fisher2003) reported that increasing space allowance for finishing steers weighing 600 kg from 2.0 to 3.0 m2/animal improved ADG by 0.38 kg, however when space allowance was increased to 4.0 m2, ADG did not improve further. With regards to lying time, Hickey et al. (Reference Hickey, Earley and Fisher2003) found that housing steers at 1.5 m2 instead of 2.0, 3.0 and 4.0 m2 decreased lying time by ~2 h; however there was no difference between the latter three treatments.
Studies comparing the welfare and performance of finishing beef cattle accommodated on straw and concrete slats are often confounded by the fact that straw-bedded systems normally have a larger floor area than slats (Ingvartsen and Andersen, Reference Ingvartsen and Andersen1993), hence, the present study aimed to avoid this problem by studying the two floor types at the same space allowance. The hypotheses of the present study were that increasing space allowance from 3.0 m2/animal to 4.5 and 6.0 m2/animal would not affect the performance, welfare or physiology of finishing heifers housed on concrete slats and that housing finishing heifers on straw as opposed to concrete slats would not affect animal performance or welfare. Therefore, the objective of this study was to combine performance, welfare and physiological measurements in the evaluation of three space allowances (3.0, 4.5 and 6.0 m2) on fully slatted concrete floors, and one space allowance (6.0 m2) on straw, of beef heifers accommodated indoors over a 105-day finishing period.
Material and methods
The study was planned and performed in a manner aiming to prevent any unnecessary pain and discomfort to the animals. All animal procedures performed in this study were conducted under experimental licence AE19132/P035 from the Health Products Regulatory Authority, Ireland.
Animals, management and study design
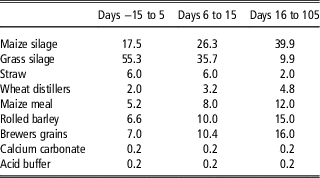
The study was conducted at the Kepak feedlot, Caulstown, Co. Meath, coordinates 53°27'11.5''N 6°27'02.5''W, from February until July 2015. In all, 240 late-maturing crossbred beef heifers, (mean initial live weight, 504 (SD 35.8) kg) were sourced in three batches of 80 from commercial farms and assembled at the feedlot. Due to difficulty in sourcing all the heifers at once, commencement of the study was staggered by batch over a 6-week period, each 3 weeks apart. On arrival at the feedlot, heifers were treated for the control of ecto- and endo- parasites using Closamectin (Norbrook Laboratories, Co. Monaghan, Ireland), were immunised against bovine respiratory syncytial virus, parainfluenza-3 virus and bovine viral diarrhoea using Rispoval®3 (Pfizer Animal Health, Co. Cork, Ireland), infectious bovine Rhinotracheitis virus using Rispoval-IBR marker live (Pfizer Animal Health, Co.), and against clostridial diseases using Tribovax 10 (Intervet, Tallaght, Ireland). The general health status of the heifers was inspected daily. Before commencing the study, heifers were accommodated in a separate straw-bedded shed for 14 days in order to acclimatise to both housing and diet. They were offered a grass silage-based total mixed ration (TMR) ad libitum (Table 1). Heifers were weighed after this period and then blocked by breed, live weight and age. For each batch there were 10 blocks of eight heifers. From within block, heifers were randomly assigned to one of four treatments: (i) 3.0 m2, (ii) 4.5 m2 and (iii) 6.0 m2 space allowance per animal on a fully slatted concrete floor and (iv) 6.0 m2 space allowance per animal on a straw-bedded floor for 105 days.
Ingredients (percentage) of the total mixed ration offered to beef heifers during the acclimatisation period and the 105-day finishing period

Experimental pens
Animals were allocated to 24 pens, each containing 10 heifers, located in the same housing facility. The pens were evenly distributed in three separate rows, throughout the house and each row had two replicates of each treatment. To achieve the respective space allowances, the dimensions of the pens were 4.50×6.66 m for treatment 1, 9.0×5.0 m for treatment 2 and 9.0×6.66 m for treatments 3 and 4. The feed face length was standard (4.5 m) for all pens. Each pen was fitted with concrete gang slats with the following dimensions: slat length 3.25 m, slat width 1.22 m, slat rib width 170 mm, void space 40 mm. The concrete slats were in situ for 30 years before the commencement of the study and were in good condition with no obvious defects. Adjacent pens were separated by a metal bar design that prevented physical contact but permitted visual contact between animals. The average daily temperature for the duration of the study inside the shed was 9 (SE±2) °C. To permit direct treatment comparisons within a single shed, the straw-bedded floors were created by placing a polypropylene geotextile membrane (Synthetic Packaging, Clara, Co. Offaly, Ireland) over the concrete slatted floor and the straw was placed on top of this free-draining membrane. The membrane was also placed on the surround of the pen enclosures to a height of 0.5 m to prevent movement of the straw to adjacent floor treatments. The straw-bedded pens were replenished with unchopped barley straw at a rate of 150 kg/pen every 3 days and this was fully removed and replaced with fresh straw, every 2 weeks. Soiled bedding in the straw-bedded pens was never higher than 25 cm in depth. Heifers had free access to clean, fresh drinking water.
Animal diets and composition
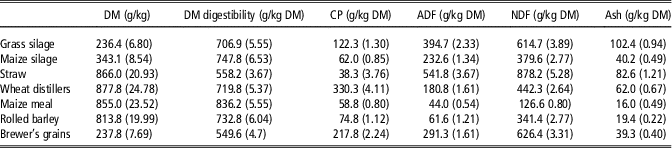
Heifers were offered a TMR ad libitum. Feeding took place once daily at 1400 h. On days 5 and 10 of the study, the proportions of ingredients in the TMR were changed (Table 1). The TMR was mixed in a Keenan MechFiber® 350 diet feeder Alltech Farming Solutions Ltd, Borris, Co. Carlow, Ireland. The feeder weighing system was calibrated every 14 days before the heifers were fed. Feed was weighed into each pen daily and refusals were weighed back manually twice weekly. Dry matter intake (DMI) was calculated on a pen basis. The TMR offered and refused was sampled twice weekly. Samples were stored at −20°C pending laboratory analysis. These samples were subsequently pooled on a weekly basis for dry matter (DM) determination and on a 3-week basis for chemical analysis. The maize silage, grass silage and concentrate feed ingredients were sampled once weekly and stored at −20°C pending laboratory analysis. Feed DM was determined on a weekly basis and feed samples were pooled on a 3-week basis for chemical analysis. The DM of the grass silage and maize silage was determined after drying, in an oven with forced-air circulation, at 40°C for 48 h. Samples of wheat distillers’, maize meal, brewers’ grains and rolled barley were dried in an oven, with forced-air circulation, at 98°C for 16 h for DM determination and a separate sample was dried at 40°C for 48 h for chemical analysis. Sample processing and chemical analysis of the grass silage, maize silage, straw and concentrates was carried out as described by Owens et al. (Reference Owens, McGee, Boland and O’Kiely2008). The chemical composition of the feed offered to the heifers is shown in Table 2.
The mean chemical composition (standard error of the mean) of the raw materials in the total mixed ration fed to beef heifers during a 105-day finishing period.

DM=dry matter.
Animal measurements
Heifers were weighed on 2 consecutive days before assignment to treatment on day 0, at 21day intervals (days 21, 42, 63 and 84) throughout the study period and finally on the day preceding and the day of slaughter (day 105). From these weights ADG was determined by linear regression. Post-slaughter, carcass weight, kill-out proportion and hide weight were determined. Carcasses were graded mechanically for conformation and fat scores (1 to 15) according to the EU beef carcass classification scheme (EC, 2006). Feed conversion ratio (FCR) was expressed as kilograms of DMI per pen per day divided by kilograms of live weight gain per pen per day.
Animal cleanliness
Heifers were dirt scored immediately before the beginning of the study on day −1 and at 21-day intervals (days 21, 42, 63, 84) throughout the study period, and again on the day of slaughter (day 105). Dirt scoring was carried out by the same person on each occasion and was carried out blind to treatment. The body dirt scoring system used by Earley et al. (Reference Earley, McDonnell and O’Riordan2015), which was adapted from Scott and Kelly (Reference Scott and Kelly1989) was applied. Using this system, the entire left side of each heifer was diagrammatically divided into 16 body segments and each segment was assigned a score between 1 (very clean) and 5 (very dirty) levels of intensity. Each animal was then given an overall dirt score, between 16 and 80, which was equal to the sum of the scores for each of the 16 body segments (Earley et al., Reference Earley, McDonnell and O’Riordan2015; Keane et al., Reference Keane, McGee, O’Riordan, Kelly and Earley2015).
Assessment of hoof lesions
Using the method of Greenough and Vermunt (Reference Greenough and Vermunt1991) all four hooves of each heifer were inspected for the presence of lesions, by the same person, on day −1 and again on retrieval of the four hooves post-slaughter. The dorsal area was examined for equal and unequal size, and the plantar area for heel erosion, under run sole, digital dermatitis, inter-digital dermatitis and white line damage. The total number of lesions that each heifer obtained during the study was calculated.
Haematological sample collection
Heifers were blood sampled via jugular venepuncture on day 0 and at 21-day intervals. Blood samples were collected into 1×6 ml K3Ethylene diamine tetraacetic acid (K3EDTA) tube (Vacuette; Cruinn Diagnostics, Dublin, Ireland) for haematological analysis. Unclotted K3EDTA whole blood samples were analysed using an ADVIA haematology analyser (ADVIA 2120; Bayer Healthcare, Siemens, UK) equipped with software for bovine blood. White blood cell (WBC) count, total leucocyte, neutrophil, lymphocyte, eosinophil, monocyte, basophil and red blood cell numbers, haemoglobin, mean cell haemoglobin concentration (MCHC), mean corpuscular haemoglobin, mean corpuscular volume, haematocrit concentration and percentage and platelet number were measured. Further blood samples were collected into 1×8 ml no-anticoagulant tubes for serum separation. Serum samples were assayed using a chemistry analyser (AU400 clinical analyser; Beckman Coulter Ireland. Ltd, O’Callaghans Mills, Co. Clare, Ireland) for metabolite concentrations. Total protein, albumin, globulin, non-esterified fatty acids (NEFA), creatine kinase and β-hydroxybutyrate (βHB) concentrations were measured.
Animal behaviour
Animal behaviour in each pen was recorded continuously for 18 days (days 70 to 87) using Hikvision high definition EXIR Dome 3.66 mm IR cameras (Hikvision, No.555 Qianmo Road, Binjiang District, Hangzhou, China) supplied and fitted by Lynx Security, Co Meath, Ireland. One camera was positioned in front of each pen which provided a clear view of the entire pen. The video cameras were connected to a network video recorder (DS-9608/9616/9632NI-ST; Hikvision, No.555 Qianmo Road, Binjiang District, Hangzhou, China). The pictures from all cameras were calibrated with date and time settings. For the purposes of data analysis, individual animal behaviour was recorded by scan sampling the video footage every 10 min (Fregonesi et al., Reference Fregonesi, Tucker, Weary, Flower and Vittie2004) for 72 h at three different occasions, days 71 to 73, 77 to 79 and 84 to 86, during the recording period. At each scan sampling the number of heifers lying down, standing up, eating (head down, actively biting feed), drinking, mounting other heifers, grooming itself, grooming another heifer or head-butting was recorded (Earley et al., Reference Earley, McDonnell and O’Riordan2015).
Statistical analysis
All statistical analyses were performed using SAS software Version 9.3 (SAS Institute Inc. Cary, NC, USA). Pen was the experimental unit for all variables. Data were checked for normality and homogeneity of variance by histograms, q–q plots, and formal statistical tests as part of the UNIVARIATE procedure of SAS (version 9.3, 2006; SAS Institute). Data that were not normally distributed were transformed by raising the variable to the power of lambda. The appropriate λ value was obtained by conducting a Box-Cox transformation analysis using the TRANSREG procedure of SAS. Data subjected to transformation were used to calculate P-values. Data from the three concrete slat treatments were analysed using a mixed model ANOVA with the MIXED procedure of SAS to examine the effect of treatment on intake, performance traits, hoof lesion scores and behavioural data. The PDIFF option was applied to evaluate the pair-wise comparisons between the straw treatment and the 6.0 m2/head treatment on concrete slats. The statistical model included the fixed effect of treatment and batch. Data with multiple observations, such as dirt scores, haematological variables and metabolites, were analysed using a repeated measures ANOVA (MIXED procedure of SAS 9.3). Terms for treatment, day and their interaction were included in the model. If the interaction term was not significant (P>0.05) it was subsequently excluded from the final model. The PDIFF (difftype) option and the Tukey test were applied as appropriate to evaluate pair-wise comparisons between the group means on concrete slats and the associated P-values were derived. Data were considered statistically significant when P<0.05. Least square means are reported with a pooled standard error of the mean. Four heifers were removed throughout the course of the study, one heifer from treatment 3 was diagnosed with tuberculosis on day 18, one heifer from treatment 1 received a leg injury on day 22 and two heifers, one from treatment 3 and one from treatment 4 became lame on days 40 and 76, respectively. The injuries were not related to treatment. In each of these cases, a cohort animal of the same weight and breed previously adapted to the same diet replaced the affected animal to maintain the same spatial allowance per animal. Behavioural results indicated that the replacement heifer in treatment 4 did not disturb the normal behavioural pattern of the heifers on day 76. Data from the replacements animals were not included in the statistical analysis.
Results
Animal intake, growth and carcass characteristics
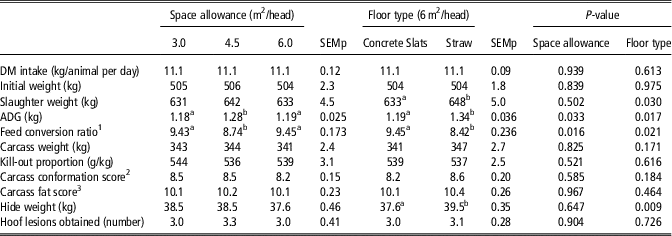
Animal intakes and performance data are shown in Table 3. There was no effect of space allowance or floor type on DMI. The ADG of heifers housed at 4.5 m2/animal was greater than those at 3.0 and 6.0 m2/animal which did not differ. Heifers housed on straw had a greater (P<0.05) ADG than those on slats at 6.0 m2/animal. The FCR results followed the same pattern as ADG, being better (P<0.05) at 4.5 m2 than 3.0 and 6.0 m2 and being better (P<0.05) on straw than 6.0 m2 on slats. Slaughter weight was not affected by space allowance; however, floor type did have an effect, with heifers on straw having greater (P<0.05) slaughter weights than those on slats at 6.0 m2. Space allowance and floor type had no effect on carcass weight, kill-out proportion, carcass conformation score or fat score. Hide weight was not affected by space allowance; however, floor type did have an effect with heifers on straw having heavier hides than those housed at 6.0 m2 on concrete slats (P<0.01).
Effect of space allowance and floor type on beef heifer intakes, performance characteristics and number of hoof lesions obtained during a 105-day finishing period

SEMp=pooled standard error; DM=dry matter; ADG=average daily gain.
The values are expressed as least square means and SEMp.
a,bLeast squares means within a row without a common superscript letter differ (P<0.05).
1 Kilograms of DM intake divided by kilograms of live weight gained.
2 EU Beef Carcass Classification Scheme, scale 1 (poorest) to 15 (best).
3 EU Beef Carcass Classification Scheme, scale 1 (leanest) to 15 (fattest).
Hoof lesions and dirt scores
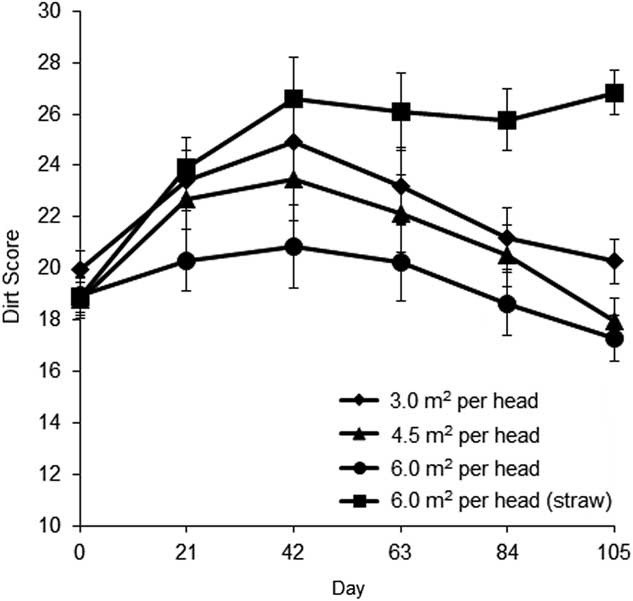
The number of hoof lesions gained during the study was not affected by space allowance or floor type (Table 3). There was a treatment×time interaction (P<0.001) for dirt scores of heifers on concrete slats (Figure 1). Dirt scores of heifers housed at 3.0 and 4.5 m2 increased from day 0 until day 42, after which point they decreased consistently until day 105. There was no difference between the two treatments at any time point except for day 105. Dirt scores of heifers housed at 6.0 m2 were lower than those at 3.0 m2 throughout the study but did not differ from heifers at 4.5 m2, except for days 21 and 42. Heifers housed at 3.0 m2 had greater dirt scores on the day of slaughter than those at 4.5 and 6.0 m2. There was a treatment×time effect (P<0.001) of floor type on dirt scores (Figure 1). From day 21 onwards, heifers housed on straw had greater dirt scores than those housed on concrete slats at 6.0 m2/head.
Effect of space allowance and floor type on the dirt scores (0 to 80) of beef heifers over the 105-day finishing period.

Blood metabolic and haematological variables
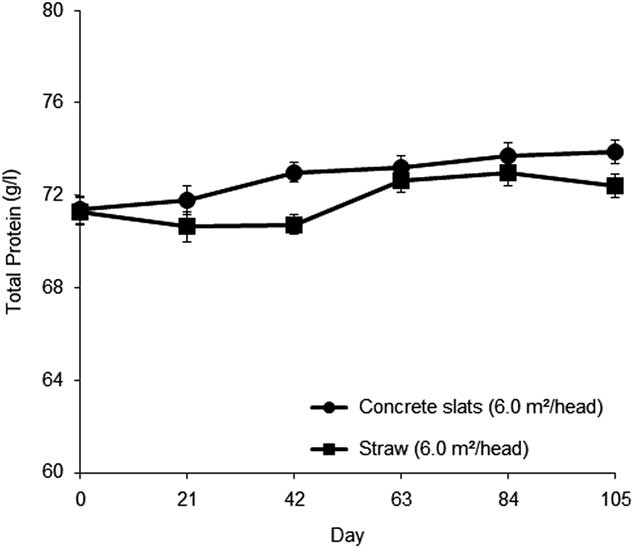
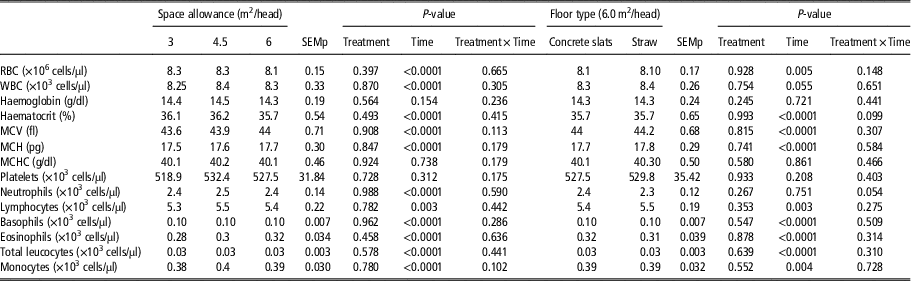
There were no treatment×time interactions for the effect of space allowance on any of the blood metabolite concentrations. There was no treatment×time interaction for the effect of floor type on any of the blood metabolite concentrations except for serum protein concentration (P<0.05) (Figure 2). Heifers housed on concrete slats at 6.0 m2 had greater serum protein concentrations than those on straw on day 42. After this point, serum protein concentrations increased for heifers on straw and there was no difference between treatments on any other day. There was a time effect (P<0.05) on the concentration of all blood metabolites at each of the space allowances on concrete slats (Table 4). With regard to floor type, there was a time effect (P<0.05) on the concentration of all blood metabolites except for globulin (Table 4). The results for haematological variables are shown in Table 5. There was no treatment×time interaction for the effect of space allowance or floor type on any of the haematological variables measured. With regard to space allowance, there was an effect of time (P<0.05) on all the haematological variables except for haemoglobin concentration, MCHC and platelet number. Regarding floor type, there was an effect of time (P<0.05) on all the haematological variables except for haemoglobin concentration, MCHC, WBCP, platelet and neutrophil number.
Effect of floor type on the serum total protein concentration of beef heifers over the 105-day finishing period.

Effect of space allowance and floor type on blood metabolite concentrations of beef heifers during a 105-day finishing period

SEMp=pooled standard error; βHB=β-hydroxybutyrate acid; NEFA=non-esterified fatty acids.
The values are expressed as least square means and SEMp.
Effect of space allowance and floor type on haematological counts of beef heifers during a 105-day finishing period

SEMp=pooled standard error; RBC=red blood cells; WBC=white blood cells; MCV=mean corpuscular volume; MCH=mean cell haemoglobin; MCHC=mean cell haemoglobin concentration.
The values are expressed as least square means and SEMp.
Animal behaviour
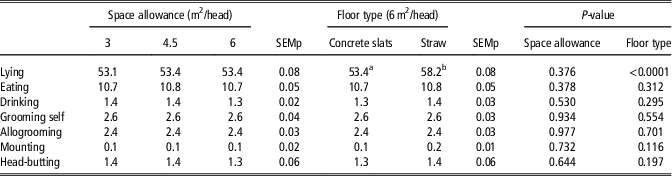
Space allowance had no effect on the percentage occurrence of any of the behavioural variables observed (Table 6). Floor type did affect animal behaviour. The percentage of heifers lying at any one time was greater (P<0.001) in the heifers housed on straw than those on concrete slats at 6.0 m2/head. The percentage occurrence of the other behavioural variables observed was not affected by floor type.
Effect of space allowance and floor type on the percentage occurrences of beef heifer behaviours during a 105-day finishing period.

SEMp=pooled standard error.
Values are expressed as a percentage of the number of times the behaviour was observed out of 144 observations in 24 h and SEMp.
a,bValues within a row without a common superscript letter differ (P<0.001).
Discussion
Effect of space allowance
The present study evaluated the effect of housing finishing beef heifers at a range of space allowances on fully slatted concrete floors on animal performance and welfare. The lowest and intermediate space allowances (3.0 and 4.5 m2/animal) were based on the recommendations in a report by the Scientific Committee on Animal Health and Animal Welfare (2001). That report concluded that the minimum space allowance provided to beef cattle should be 3.0 m2 for an animal weighing 500 kg plus or minus 0.5 m2 for each 100 kg above or below 500 kg. The largest space allowance (6.0 m2/animal) was chosen to assess whether increasing the space allowance above the current recommendations is beneficial to animal performance or welfare.
The majority of studies carried out on the effect of space allowance on the performance and welfare of finishing beef cattle on concrete slats have investigated space allowances below 3.0 m2. Fisher et al. (Reference Fisher, Crowe, O’Kiely and Enright1997) reported that housing finishing heifers, weighing 560 kg, at space allowances below 2.0 m2, instead of at 2.5 and 3.0 m2/animal impaired performance and lying time. Furthermore, Hickey et al. (Reference Hickey, Earley and Fisher2003) reported a reduction in carcass weight and a decrease in the production of Interferon-γ (INF-γ) to the mitogen Concanavalin-A in steers, weighing 610 kg, housed at 1.5 m2/head compared with 3.0 m2. Similarly, Gupta et al. (Reference Gupta, Earley and Crowe2007) found that housing bulls at 1.2 m2 compared with 2.7 m2 reduced performance and raised plasma cortisol concentrations suggesting that the performance and stress response of animals at the lower space allowance was inhibited.
In the present study, DMI was not affected by space allowance. The greater ADG recorded for heifers housed at 4.5 m2 compared with 3.0 m2 was in contrast to the findings of Hickey et al. (Reference Hickey, Earley and Fisher2003) and Gupta et al. (Reference Gupta, Earley and Crowe2007) who reported no difference in the ADG of finishing cattle housed on concrete slats when space allowance was increased from 3.0 and 2.7 m2 to 4.0 and 4.2 m2, respectively. Despite the greater ADG observed in heifers housed at 4.5 m2 in the present study, carcass weights, kill-out proportions, conformation scores and fat scores were similar across the three space allowances. Similarly, Hickey et al. (Reference Hickey, Earley and Fisher2003) reported no difference in any of these variables when space allowance was increased above 3.0 m2.
After housing, cattle tend to get dirtier, regardless of space allowance, for the first 2 to 4 weeks and then get cleaner due to the shedding of the winter coat (Scott and Kelly, Reference Scott and Kelly1989). The results of the current study support this as dirt scores of heifers at the three space allowances on concrete slats increased until day 42 and decreased subsequently. The greater dirt scores observed for heifers housed at 3.0 m2/animal than those housed at 4.5 and 6.0 m2/animal in the present study are consistent with the findings of Gygax et al. (Reference Gygax, Siegwart and Wechsler2007) and Hickey et al. (Reference Hickey, Earley and Fisher2003) who reported that as space allowance increased above 3.0 m2/animal for finishing bulls and steers respectively, dirt scores decreased.
Overall, the number of hoof lesions detected was low when compared with previous studies (Earley et al., Reference Earley, McDonnell and O’Riordan2015, Keane et al., Reference Keane, McGee, O’Riordan, Kelly and Earley2015). This may be attributed to the housing duration or the difference of diets between studies. The current study duration was 105 days, whereas studies carried out by Earley et al. (Reference Earley, McDonnell and O’Riordan2015) and Keane et al. (Reference Keane, McGee, O’Riordan, Kelly and Earley2015) lasted 150 days, therefore allowing more time for lesions to develop. The lower number of lesions detected in the present study may be due to the fact that the diet offered was made up of over 50% forage ensuring that heifers had sufficient quantity of fibre to prevent acidosis occurring, which is recognised as a predisposing factor associated with hoof lesions (Nagaraja and Titgemeyer, Reference Nagaraja and Titgemeyer2007).
Changes in the composition of haematological profiles can indicate the presence of a stress response in cattle. This was demonstrated by Burton et al. (Reference Burton, Madsen, Chang, Weber, Buckham, van Dorp, Hickey and Earley2005), who used reductions in the number of monocytes, eosinophils and basophils in circulation as indicators of bovine stress. White blood cell counts have been used by Eicher et al. (Reference Eicher, Lay, Arthington and Schutz2013) to assess whether floor type had an effect on the immune function of dairy cows. Similarly, Sutherland et al. (Reference Sutherland, Worth and Steward2014) used WBC counts to assess whether different space allowances initiated a stress response in dairy calves. The results for haematological profiles in the present study suggest that the space allocations used were sufficient so as to not initiate a stress response in the animals.
Analysis of clinical biochemistry provides an objective means of assessing nutritional status in an animal and can be used with other methods enabling specific and global nutritional problems to be identified. During stress, metabolism and caloric demands are increased; however, nutrient intake may be low with deficiencies being made up by catabolic processes that metabolise muscle proteins and fat stores (Earley et al., Reference Earley, McDonnell and O’Riordan2015). The absence of an effect of space allowance on serum protein, albumin, globulin, NEFA and βHB concentrations, combined with no differences in DMI, would suggest that the mobilisation of body energy reserves did not occur in this study. Furthermore, there was no difference in creatine kinase levels between treatments, suggesting that none of the three stocking densities was more conducive to muscle injuries than the other two (Buckham Sporer et al., Reference Buckham Sporer, Weber, Burton, Earley and Crowe2008).
The results for behavioural variables measured in the current study are within the normal range for cattle (Phillips et al., Reference Phillips, Beerda, Knierim, Waiblinger, Lidfords, Krohn, Canali, Valk, Veissier and Hopster2013). Adequate space for lying down is important for maximising animal production and well-being (Haley et al., Reference Haley, Rushen and de Passillé2000). It enables animals to lie in an out-stretched posture and prevents them from stepping on other animals, therefore reducing the risk of injuries (Wechsler, Reference Wechsler2011). Inadequate space for lying down has been identified as contributing factor to lameness (Leonard et al., Reference Leonard, O’Connell and O’Farrell1996), although once an animal is lame it will lie down for longer periods than healthy animals (Fayed, Reference Fayed1997). Wechsler (Reference Wechsler2011) reported that normal lying behaviour for cattle is between 12.5 and 14.5 h/day. Therefore, lying durations >14.5 h/day may indicate sub optimal animal welfare conditions. The heifers housed on concrete slats in the present study were lying for 12.8 h/day which is within the range Wechsler (Reference Wechsler2011) described as normal for beef cattle. Other behavioural parameters used in the assessment of the effect of housing conditions on animal welfare include: number and duration of lying bouts (Haley et al., Reference Haley, Rushen and de Passillé2000), synchronisation of lying behaviour (Fregonesi and Leaver, Reference Fregonesi and Leaver2002) and changing of lying postures (Haley et al., Reference Haley, Rushen and de Passillé2000). Perhaps, if these parameters were investigated, they might have revealed welfare issues that have not been identified by the methods used in the present study.
Effect of floor type
Although Hickey et al. (Reference Hickey, Earley and Fisher2003) and Gottardo et al. (Reference Gottardo, Ricc, Fregolent, Ravarotto and Cozzi2003) have compared straw and concrete slats at the same space allowances, 4.0 and 3.0 m2/animal, respectively, the current study is the first one, to the authors’ knowledge, to compare these two floor types at 6.0 m2/animal. The greater ADG recorded for heifers accommodated on straw is in contrast to the findings of Hickey et al. (Reference Hickey, Earley and Fisher2003b) and Gottardo et al. (Reference Gottardo, Ricc, Fregolent, Ravarotto and Cozzi2003) who recorded no difference in ADG between animals housed on straw and concrete slats. Floor type had no effect on carcass weight, kill-out proportion, conformation score or fat score. This is consistent with the findings of Hickey et al. (Reference Hickey, Earley and Fisher2003) and Gottardo et al. (Reference Gottardo, Ricc, Fregolent, Ravarotto and Cozzi2003) who reported no difference between the two floor types, with the same space per animal, for any of these variables. Likewise, Lowe et al. (Reference Lowe, Steen, Beattie and Moss2001) observed no difference between the carcass weight, kill-out proportion, conformation and fat score of steers housed on concrete slats and straw, however, the steers on straw had a greater space allowance than those on slats in contrast to the present study. The heavier hides recorded for heifers housed on straw are consistent with the greater dirt body scores observed on the straw treatment on the day of slaughter.
The greater dirt scores observed in heifers on straw in the present study is consistent with Gottardo et al. (Reference Gottardo, Ricc, Fregolent, Ravarotto and Cozzi2003) who reported that cattle housed on straw were more likely to be dirtier at the end of the fattening period than those on concrete slats with the same space allowance. Similar results were observed by Brscic et al. (Reference Brscic, Gottardo, Tessitore, Guzzo, Ricci and Cozzi2015) however in this study, sawdust was mixed with the straw and space allowance per animal was lower on concrete slats than on straw. Conversely, Hickey et al. (Reference Hickey, Earley and Fisher2003) studied the two floor types at the same space allowance and reported greater dirt score for steers housed on concrete slats compared with straw bedding.
It has been suggested that soft floors cause insufficient claw wear resulting and impaired claw health (Wechsler, Reference Wechsler2011), however, this was not evident in the present study. This is consistent with the findings of Thio et al. (Reference Thio, Gygax, Friedli, Mayer and Ossent2005), who recorded no difference in the presence of hoof lesions between bulls kept on straw and concrete slats. Similarly, Fregonesi and Leaver (Reference Fregonesi and Leaver2001) compared the effects of straw bedding and concrete on hoof health of dairy cows and noted no difference between the two floor types. However, in the aforementioned study, cows on straw did have access to a concrete area which may have provided some hoof wear.
Housing heifers on straw did not affect blood cell profiles or metabolite concentrations which is consistent with the findings of Hickey et al. (Reference Hickey, Earley and Fisher2003) and Gottardo et al. (Reference Gottardo, Ricc, Fregolent, Ravarotto and Cozzi2003). Although total protein concentration was lower in heifers on straw on day 42, the levels were still within normal reference range (Jones and Allison, Reference Jones and Allison2007), suggesting that protein metabolism was not affected by the presence of straw.
The increased lying time on straw recorded in the current study is in contrast to the findings of Absmanner et al. (Reference Absmanner, Rouha-Mülleder, Scharl, Leisch and Troxler2009) who reported that lying time for cattle did not differ between concrete slats and straw, however this study provided greater space allowance per animal on straw. The reduced lying time on concrete slats may be due to the hard concrete floors causing pain in the carpal joints as suggested by Haley et al. (Reference Haley, Rushen and de Passillé2000). It may also be due to heifers on straw being able to transition more easily between standing and sitting as was suggested by Wechsler (Reference Wechsler2011). It has been reported that when underfoot conditions provide more traction, mounting behaviour will increase (Platz et al., Reference Platz, Ahrens, Bendel, Meyer and Erhard2008). In the present study, very little mounting behaviour was observed which may be due to the observational method used or that neither floor type was conducive to mounting.
In the present study, straw was replenished at a rate of 5 kg/animal per day and cleaned out completely every 14 days, which is in line with the recommendations of between 4 and 6 kg/day by Maton et al. (Reference Maton, Daelemans and Lambrecht2012). At this rate, under Irish conditions, the current availability of straw is unlikely to suffice to house all finishing cattle in Ireland on straw (Williamson, Reference Williamson1998). Alternative bedding materials would need to be considered or more straw produced if housing of cattle in Ireland was to move away from concrete slatted floors.
Conclusion
The lack of a difference in carcass weight between heifers housed at the three different space allowances suggests that 3.0 m2 is sufficient space for finishing beef heifers in terms of performance. The results for physiological variables, metabolic variables and animal behaviour would suggest that increasing space allowance above 3.0 m2 did not affect animal welfare in the present study, however, providing additional space brought about a positive change in animal cleanliness. With regards to floor type, when housed at the same space allowance, accommodating finishing beef heifers on straw as opposed to concrete slats did improve ADG; although this finding was not reflected in carcass weight. Welfare indicators such as haematological and metabolic variables indicate no positive or negative effect of straw bedding; however, behavioural results indicated that the provision of straw increased lying time.
Acknowledgements
The authors thank John Horgan and Jonathan Forbes, from Kepak, for access to animals and facilities at Kepak, Co. Meath, and Francis Collier, Joe Larkin and Margaret Murray, Teagasc, Grange for excellent technical help and assistance during the study. Many thanks are due to the farm staff at Teagasc, Grange beef research centre and at the Kepak feedlot. This study was funded by a Teagasc Walsh Fellowship to Michael Keane (2013073).