
1. Introduction
The dynamics of the drop impacting on a solid or pool surface are fundamental subjects of extensive studies (Yarin Reference Yarin2006; Thoroddsen, Etoh & Takehara Reference Thoroddsen, Etoh and Takehara2008; Thoraval et al. Reference Thoraval, Takehara, Etoh and Thoroddsen2013; Josserand & Thoroddsen Reference Josserand and Thoroddsen2016). An air bubble is often trapped underneath upon drop impact (van Dam & Clerc Reference van Dam and Clerc2004; Bouwhuis et al. Reference Bouwhuis, van der Veen, Tuan, Keij, Winkels, Peters, van der Meer, Sun, Snoeijer and Lohse2012; Li, Vakarelski & Thoroddsen Reference Li, Vakarelski and Thoroddsen2015; Langley, Castrejon-Pita & Thoroddsen Reference Langley, Castrejon-Pita and Thoroddsen2020). The air bubble entrapment occurs in a wide range of drop diameters from hundreds of nanometres to millimetres (Thoroddsen, Etoh & Takehara Reference Thoroddsen, Etoh and Takehara2003; Shen et al. Reference Shen, Zou, Liu, Duley and Zhou2016; Yi et al. Reference Yi, Qi, Luo, Jiang and Deng2016). Hicks & Purvis (Reference Hicks and Purvis2010) found that the air at the bottom of the drop evolves into a film of 1–5  $\mathrm {\mu }$m thickness before the drop contacts the substrate. When the lubricating pressure of the air (
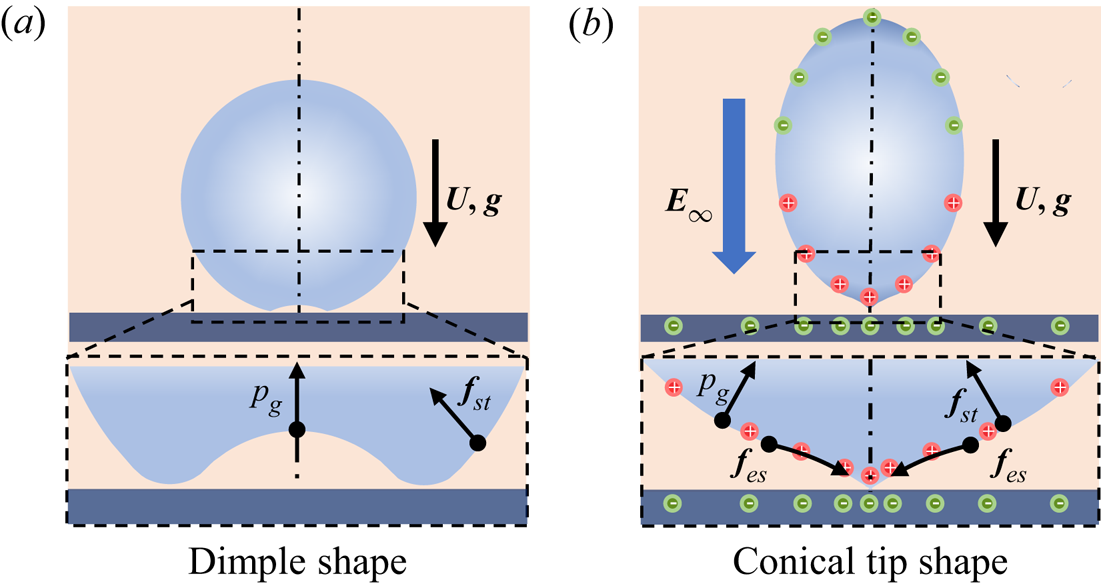
 $p_g$) is strong enough, the bottom of the drop can be deformed into a dimple (Mandre, Mani & Brenner Reference Mandre, Mani and Brenner2009), as shown in figure 1(a). The air is trapped by the circular contact line and eventually forms a bubble, which occurs within a hundred microseconds after initial contact. The air bubble entrapment process has been visualized through ultrafast x-ray phase-contrast imaging (Lee et al. Reference Lee, Weon, Je and Fezzaa2012) or high-speed interferometry technology (Li & Thoroddsen Reference Li and Thoroddsen2015; van der Veen et al. Reference van der Veen, Tuan, Lohse and Sun2012). Numerically, Mehdi-Nejad, Mostaghimi & Chandra (Reference Mehdi-Nejad, Mostaghimi and Chandra2003) used the volume of fluid (VOF) method to track the drop interface and successfully simulated the air bubble entrainment process of water and n-heptane drops impacting on a steel surface and a thin liquid film, respectively. Xiong & Cheng (Reference Xiong and Cheng2018) and Shukla et al. (Reference Shukla, Kumar, Kumar, Singh and Kumar2019) each proposed a new model to simulate the air bubble entrainment process in the molten drop after its impact on the cold smooth surface. Therefore, numerical simulation provides a useful approach for studying the air entrapment and bubble formation processes (Li et al. Reference Li, Zhang, Zheng and Tian2017a; Jian et al. Reference Jian, Channa, Kherbeche, Chizari, Thoroddsen and Thoraval2020; Kumar et al. Reference Kumar, Shukla, Kumar and Kumar2020).
Schematic of the drop before it impacts on the substrate. (a) The conventional bottom dimple shape of the drop without the electric field. (b) Conical tip shape at the bottom of the drop in the electric field.

Generally, air bubble entrapment is undesirable in many drop deposition applications (Huang et al. Reference Huang, Wu, Xiao, Duan, Zhu, Bian, Ye and Yin2019; Oratis et al. Reference Oratis, Bush, Stone and Bird2020), such as inkjet printing (Minemawari et al. Reference Minemawari, Yamada, Matsui, Tsutsumi, Haas, Chiba, Kumai and Hasegawa2011) and droplet-based additive manufacturing (Stringer et al. Reference Stringer2016; Wu et al. Reference Wu, Tian, Luo, Zhu, Duan and Huang2020). The voids in the printed device become defects and harm the structural integrity and quality of the functional material (Derby Reference Derby2010; Ligon et al. Reference Ligon, Liska, Stampfl, Gurr and Mulhaupt2017). Li et al. (Reference Li, Langley, Tian, Hicks and Thoroddsen2017b) proposed that the size of the bubbles can be shrunk by reducing the ambient pressure, and the double contact phenomenon can be observed when the compressibility parameter exceeds  ${\sim }25$. However, creating vacuum is not always feasible in many cases. The microstructure has been introduced on the substrate surface to form channels for gas to escape and avoid air bubble entrapment (Antonini et al. Reference Antonini, Lee, Maitra, Irvine, Derome, Tiwari, Carmeliet and Poulikakos2014; Liu, Tan & Xu Reference Liu, Tan and Xu2015). In addition, Hicks & Purvis (Reference Hicks and Purvis2010) mentioned that no bubbles will be trapped when drops impact with an oblique surface (García-Geijo, Riboux & Gordillo Reference García-Geijo, Riboux and Gordillo2020) or a horizontally moving surface. These methods focused on reducing the lubrication pressure of the air to avoid trapping bubbles, while some other ways were proposed to adjust the interface profile at the bottom of the drop. Vo & Tran (Reference Vo and Tran2021) performed an interdigital electrode substrate which can deform the drop by the electrophoretic effect, inducing controlled rupture of the air film and creating a channel for air to escape, while it is not convenient enough to modify the electrode on the substrate. Gao et al. (Reference Gao, Yi, Qi, Qiao and Deng2019) proposed a way to charge the drop to a critical charge level so that the bottom of the drop exhibits a microtip deformation, which results in puncturing the air disc to achieve point contact, thus avoiding the air entrapment. A similar double contact state can also be observed in some cases. However, in most practical applications (Singh et al. Reference Singh, Haverinen, Dhagat and Jabbour2010), the drops are electroneutral, and the substrate is horizontal static, flat and smooth. Therefore, it is quite desirable to propose a convenient approach to eliminate the air bubble entrapment without altering the microstructure of the substrate surface or the properties of the drop.
A non-invasive and easy-to-control way to induce drop deformation can be achieved by applying an external electric field (Yang et al. Reference Yang, Duan, Li and Deng2014; Vlahovska Reference Vlahovska2019; Wang et al. Reference Wang, Tian, Zhang, Wang and Deng2021). The external electric field polarizes the drop interface due to the difference in dielectric constant and conductivity on both media, and electrical stress will be generated at the interface (Zhang, Zahn & Lin Reference Zhang, Zahn and Lin2013; Sengupta, Walker & Khair Reference Sengupta, Walker and Khair2017). The drop will stretch and deform along the direction of the electric field, and even become atomized (Collins et al. Reference Collins, Sambath, Harris and Basaran2013), depending on the strength of the electric field and the fluid characteristics (density, viscosity, permittivity and conductivity) (Gawande, Mayya & Thaokar Reference Gawande, Mayya and Thaokar2020; Taylor Reference Taylor1966; Wagoner et al. Reference Wagoner, Vlahovska, Harris and Basaran2020). Such electrohydrodynamic (EHD) deformation of the suspended drop under electric fields has been extensively studied (Santra, Mandal & Chakraborty Reference Santra, Mandal and Chakraborty2018). However, there is little research reported on the dynamic process of drop impact on the flat solid substrate in an electric field, and even less on the EHD behaviour of air entrapment, which is a fresh EHD subject. The drops are subjected to deformation by electrical stress in an electric field, which may fundamentally change the impact dynamics, air film formation and the bubble entrapped behaviour.
In this study, we numerically and experimentally investigated the EHD behaviour of the air entrapment in a charge neutral drop impact in an external electric field. We show that as the drop approaches the substrate with a separation of  ${<}1\ {\rm mm}$, the polarized surface charges at the bottom of the drop, causing the bottom electrical stresses to increase rapidly with the inverse square of the distance
 $\delta$ between the drop and substrate. The electric stress cancels part of the retarding effect of the lubrication pressure, resulting in a changed drop surface shape before the contact with the substrate, thereby regulating the evolution of the subsequent air film entrapment and the initial contact radius, as shown in figure 1(b). The internal flow and the electric force field at the bottom of the drop during the air entrapment altered by the electric field are revealed through simulations. A scaling law of the critical external electric field for eliminating air entrapment is derived based on a dipole charge mirror model.
The paper is organized as follows. The experimental set-up and numerical model are presented in § 2. In § 3, we discuss the difference of the drop impact and air entrapment in external electric fields and explain the effect mechanisms of the electric field. In § 4, we give a theoretical expression of a critical external electric field, in which no bubble is trapped by analysing the competition of the forces on the drop. In § 5, we provide the conclusions of our work.
2. Experimental set-up and numerical model
2.1. Experimental set-up
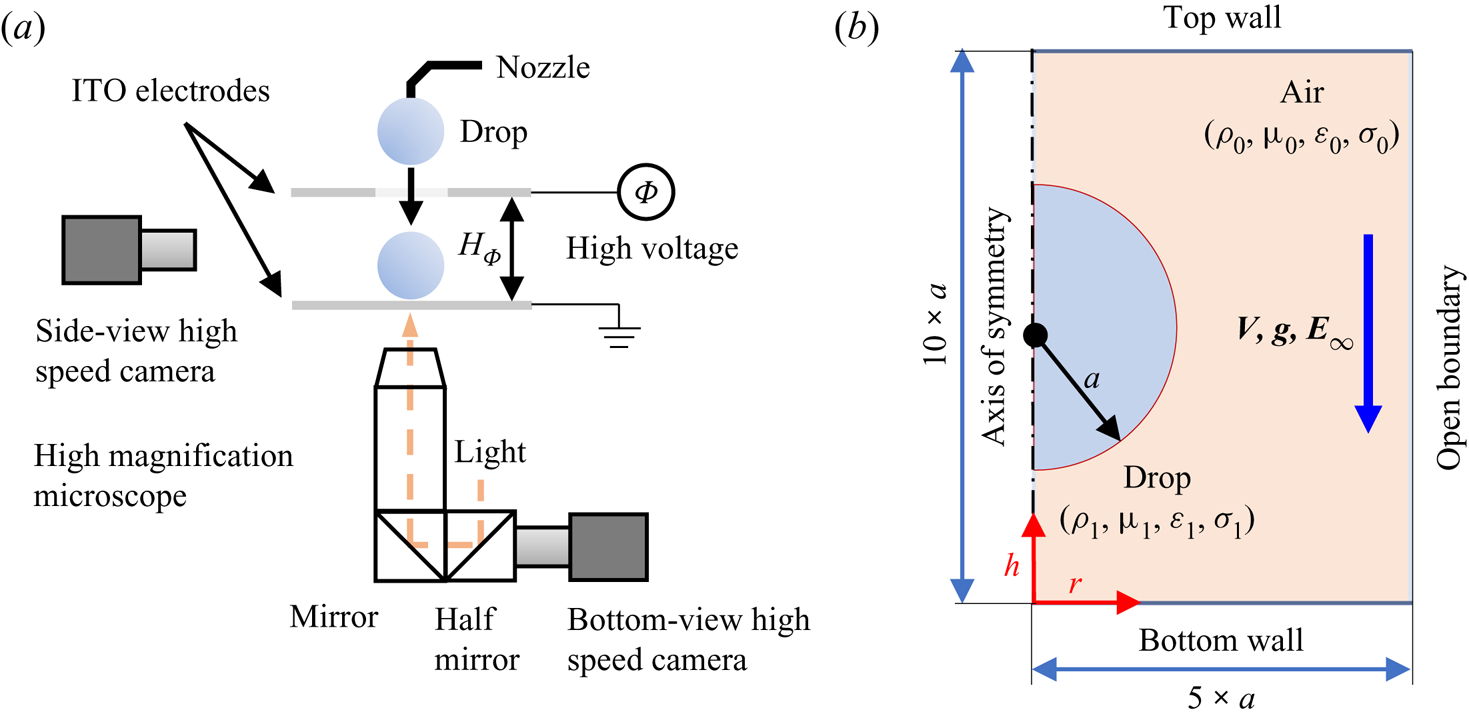
The experimental set-up is shown schematically in figure 2(a). The domain of interest is between the top electrode and the grounded substrate. The voltage difference  $\varPhi$ and separation
 $H$ between the top electrode and substrate define an approximately uniform electric field
 ${\boldsymbol {E}}_\infty = \varPhi /H_{\varPhi }$. A circular hole is laser drilled in the top electrode, to allow the drop released from a nozzle to enter the electric field. Both the electrode and the substrate are glass slides coated with indium tin oxide (ITO), providing both electrical conductivity for the electric field and optical transparency for bottom-view illumination. The specific size of glass slides is
 $75\times 25\times 0.7\ {\rm mm}^3$ and the thickness of ITO coating is
 $125\,{\rm nm}$. A
 $500\,{\rm nm}$-thick polymethyl methacrylate film is spin coated on the ITO substrate and modified with octadecyltrichlorosilane, which avoids charging the drop and ensures the contact angle of the water is
 $90^{\circ }$. We use a high-speed video camera (i-SPEED 726, iX Cameras) at frame rates up to 272 251 fps with a high-intensity coaxial white light to capture the fast initial contact. The resolving power is up to
 $1.35\, \mathrm {\mu }{\rm m}\,{\rm pixels}^{-1}$ and the exposure time is down to 289 ns. The impacting events from the side view are recorded with an i-SPEED 220 camera. Deionized water is used as the liquid and drops are generated by pumping the liquid pneumatically through a stainless steel capillary with an outer diameter of
 $160\, \mathrm {\mu }{\rm m}$, resulting in an equivalent spherical radius of
 $a = 1.25\pm 0.01\ {\rm mm}$. Both the capillary and the bottom ITO are grounded to prevent the drops from carrying charges. The release heights between the nozzle and the substrate are 15–200 mm, corresponding to the impact velocities
 ${\boldsymbol {U}} = 0.5{-}2$ m s
 $^{-1}$. All the experiments are carried out at ambient pressure with room temperature. The experimental parameters are shown in table 1.
(a) Schematic of the experimental set-up. (b) Schematic of a leaky dielectric drop impacts in an electric field.

Properties of the air and drop used in the experiments and numerical simulations. Here  $a$ is the radius of the drop;
 $\rho$ is the liquid density;
 $\mu$ is the dynamic viscosity;
 $\sigma$ is electrical conductivity;
 $\varepsilon _r$ is the relative permittivity;
 $\varepsilon _0 = 8.85\times 10^{-12}$ is the dielectric constant of vacuum. The subscripts 0 and 1 represent air and drop, respectively.

2.2. Numerical model
The drop impact process in the electric field can be simplified by using a two-dimensional axisymmetric model (figure 2b). The size of the computational domain is set to  $5a\times 10a$. A numerical model combines the finite volume method and the leaky dielectric model (LDM) is used here. The VOF method is adopted to track the interface of the liquid by the volume fraction
 $\alpha$ in a computational cell with its value in [0, 1], where 0 and 1 represent air and liquid, respectively. The interface of the air and drop is described by a thin layer of discrete basic computational volumes (Herrada et al. Reference Herrada, Lopez-Herrera, Ganan-Calvo, Vega, Montanero and Popinet2012). The LDM assumes that the charge is only distributed at the liquid interface of the two-phase because the charge relaxation time (
 ${t}_{E } = {\varepsilon }/{\sigma }$) is much shorter than the viscous time of fluid motion (
 ${{t}_{\mu }} = {\rho {{a}^{2}}}/{\mu }$) (Saville Reference Saville1997). The continuity and momentum equations are
 \begin{gather} \boldsymbol{\nabla} \boldsymbol{\cdot} {\boldsymbol{U}}=0, \end{gather}
 \begin{gather} \frac{\partial (\rho {\boldsymbol{U}})}{\partial t}+\boldsymbol{\nabla} \boldsymbol{\cdot} (\rho {\boldsymbol{UU}}) ={-}\boldsymbol{\nabla} p+\boldsymbol{\nabla} \boldsymbol{\cdot} ( \mu [ \boldsymbol{\nabla} {\boldsymbol{U}} +\boldsymbol{\nabla} {{{\boldsymbol{U}}}^{\text{T}}} ] )+\rho \boldsymbol{g}+{\boldsymbol{f}}_{st}+{\boldsymbol{f}}_{es}, \end{gather}
 \begin{gather} {{{{\boldsymbol{f}}}}_{st}} = \gamma \kappa \left( \boldsymbol{\nabla} \alpha \right),\kappa = \boldsymbol{\nabla} \boldsymbol{\cdot} \left( \frac{\boldsymbol{\nabla} \alpha }{\left| \boldsymbol{\nabla} \alpha \right|} \right), \end{gather}
where the additional terms  $\boldsymbol {f}_{st}$ and
 $\boldsymbol {f}_{es}$ are the surface tension stress and the electric stress acting at the interface of two phases, respectively. Surface tension stresses
 $\boldsymbol {f}_{st}$ are obtained according to the continuous-surface-force model, where
 $\kappa$ is the local curvature of the interface. The electric field (
 $\boldsymbol {E}$) is irrotational and we have
 \begin{equation} \boldsymbol{\nabla} \times \boldsymbol{E} = 0,\quad \boldsymbol{E} ={-}\boldsymbol{\nabla} \varPhi . \end{equation}
The charge density ( ${\rho }_{e}$) can be solved by Gauss's theorem:
 \begin{equation} {{\rho}_{e}}=\boldsymbol{\nabla} \boldsymbol{\cdot} \left( \varepsilon {\boldsymbol{E}} \right) ={-}\boldsymbol{\nabla} \boldsymbol{\cdot} \left( \varepsilon \boldsymbol{\nabla} \varPhi \right). \end{equation}
Therefore, the electric stress  ${\boldsymbol {f}}_{es}$ is
 \begin{equation} \boldsymbol{f}_{es} = {{\rho }_{e}}{\boldsymbol{E}}-\tfrac{1}{2}{{{\boldsymbol{E}}}^{2}}\boldsymbol{\nabla} \varepsilon. \end{equation}
Here the framework of OpenFOAM is chosen to implement the EHD model (Roghair et al. Reference Roghair, Musterd, van den Ende, Kleijn, Kreutzer and Mugele2015). A second-order implicit algorithm is used in the non-stationary term and the QUICK format is used in convection items. The diffusion term adopts the central difference format. An adaptive time step is used here to improve computational efficiency and the minimum time step is  $10^{-7}\,{\rm s}$. To ensure numerical continuity and stability, the Courant number is set to be
 ${<}0.5$, which represents the relative relationship between the time step and the grid size. Convergence of the solution is confirmed by checking the grid independence of the calculation results. For the bottom air film evolution area, the grid is further refined into
 $0.2\, \mathrm {\mu }{\rm m}$ (see supplementary figure S1 available at https://doi.org/10.1017/jfm.2022.439). It should be noted that the contact angle changes dynamically with the speed of the free surface advancing or retreating in reality (Snoeijer & Andreotti Reference Snoeijer and Andreotti2013). To simplify the model and focus on the effect of the electric field, a static contact angle of
 $90^{\circ }$ (also consistent with experimental conditions) is selected in this study. There is a slight difference in time between the simulation and the experiment due to the imperfect substrate and the static contact angle model, which does not affect the key deformation behaviour of the drop before contact.
Generally, the impact processes are first characterized by the Weber number and the capillary number, defined with the liquid properties as
 \begin{equation} We=\frac{\rho_1 2a{{\boldsymbol{U}}^2}}{{\gamma }},\quad Ca_g = \frac{{{{\mu }_{0}}{\boldsymbol{U}}}}{{\gamma }}, \end{equation}
where  $Ca_g$ is defined based on the air viscosity. The Taylor limit of critical field (
 ${\boldsymbol {E}}_T$) is the maximum electric field strength, at which the drop can maintain a stable shape without spraying or fragmentation in an external electric field (Grimm & Beauchamp Reference Grimm and Beauchamp2005):
 \begin{equation} {{{\boldsymbol{E}}}_{T}} = \frac{c}{2{{\left({\rm \pi} \right)}^{{1}/{2}}}} \left(\frac{\gamma }{{{{\varepsilon }_{0}}a}}\right)^{{1}/{2}}. \end{equation}
For water in the air, Basaran & Scriven (Reference Basaran and Scriven1989) gave the value of  $c$ as 1.625 by fitting the experimental parameters. A dimensionless electric field intensity level is defined to quantify the intensity of the electric field (
 ${\boldsymbol {E}}_\infty$):
 \begin{equation} \varGamma_{{E}} = {{{{\boldsymbol{E}}}_{\infty }}}/{{{\boldsymbol{E}}_{T}}}. \end{equation}
Hicks et al. (Reference Hicks, Ermanyuk, Gavrilov and Purvis2012) gave the theoretical prediction of the initial contact radius ( $L_0$) of the drop deposited on the substrate based on an incompressible model,
 \begin{equation} {{L}_{0}} = 3.8\left(\frac{{4{{\mu }_{0}}}}{{{\rho }_{1}}{{\boldsymbol{U}}}}\right)^{{1}/{3}}{{a}_{B}}^{{2}/{3}}, \end{equation}
where  ${a}_B$ is the local radius of curvature at the bottom of the drop. The simulation results of
 $L_0$ for drop deposition without electric field at different velocities are verified in supplementary figure S2.
3. Experimental and numerical results
3.1. The drop impact behaviour in an electric field
The drop impact event is observed from a side view and bottom view synchronously, and the simulation results complement the limitations of experiment (such as features less than the resolving power of the imaging system and unobservable physical field information). We use the bottom view to observe the film interference fringes (i.e. Newton's ring) caused by light transmission and reflection between the drop interface and glass surface, which provides quantitative information of the air film radius.
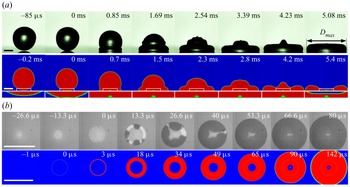
Figure 3(a) shows the typical process of neutral drop impact on the substrate ( $\varGamma _E = 0$,
 $We = 8.6$) from experiment and simulation. A dimple appears at the bottom of the drop right before the drop impacts the substrate. Then the dimple widens and a ring contacts with the substrate, resulting in an air disc being captured, whose radius and thickness are
 $253.6\, \mathrm {\mu }{\rm m}$ and
 $8\,\mathrm {\mu }{\rm m}$, respectively (
 $t = 0\,{\rm ms}$). During the subsequent spreading of the drop, the air disc shrinks into a small bubble at the bottom of the drop. The bottom-view images in experiment and the simulation images in figure 3(b) show the evolution of air film after the drop contacts with the substrate. Before the drop contacts the substrate, a small white spot appears caused by the reflection from the drop bottom surface due to the dimple deformation at the bottom of the drop (
 $t = -26.6, -13.3\,\mathrm {\mu }{\rm s}$). Next, the substrate is wet inward from the circumference position of the Newton's ring at
 $t = 0\,\mathrm {\mu }{\rm s}$. However, the substrate surface is not free of contamination or particles, the liquid usually wet from the random points of the circumference. At
 $t = 66.6\,\mathrm {\mu }{\rm s}$, the wetting region is closed, suggesting the air film is trapped at the bottom of the drop. The trapped bubble is sealed on the substrate inside the drop, similar to typical images reported in the literature (Liu, Tan & Xu Reference Liu, Tan and Xu2013).
(a) Without electric field ( $\varGamma _E = 0$), the spreading processes of the normal drop impacting on a smooth dry substrate from experiment and simulation, where a bubble is entrapped underneath. (b) The air entrapment is observed from the bottom-view image and the slices images in the simulation. The substrate is wet from the edge air film which subsequently shrinks into a bubble. The drop impacts the substrate at
 $We = 8.6$ (
 $Ca_g = 1.23\times 10^{-4}$). The scale bar is 1 mm. See supplementary movie 1.

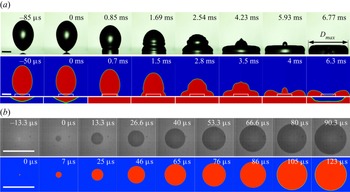
Figure 4(a) shows a very different drop impact process when an electric field of  $\varGamma _E = 0.77$ is applied. The drop becomes ellipsoidal with the electric field (
 $t = -85\,\mathrm {\mu }{\rm s}$). Right before the drop contacts the substrate (
 $t = 0\,{\rm ms}$), the top half of the drop is still spherical while the bottom half forms a conical tip and makes centre touchdown without trapping any air bubble. This is also observed from the bottom view in figure 4(b), where the dark circular disc instead of interference fringes appears. Compared with the phenomenon of drop impact without electric field, it takes more time for the drop to spread to reach the maximum radius when the electric field is present, while the maximum radius is similar in both cases. The experimentally observed phenomena are consistent with simulations.
(a) With the electric field ( $\varGamma _E = 0.77$), the spreading processes of the drop impacting on a smooth dry substrate from experiment and simulation. A Taylor conical is formed at the bottom of the drop, which results in a point contact and eliminates the formation of compressed air film and air bubble entrapment. (b) The interference fringe and air disc have both disappeared and are replaced by a growing dark circular disc. It means that the wetting area expands from the central spot to an outward spot, and the air film avoids being entrapped. The drop impacts the substrate at
 $We = 8.6$ (
 $Ca_g = 1.23\times 10^{-4}$). The scale bar is 1 mm. See supplementary movie 2.

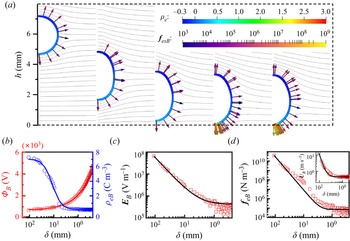
Figure 5(a) shows the spatial electric potential ( $\varPhi$), the polarization charge density (
 $\rho _e$) and the vector of electric stress (
 ${\boldsymbol {f}}_{es}$) at the interface as the drop approaches the substrate. The same number of negative and positive charges are distributed on the top and bottom half of the drop surface, respectively. The electrical stress is generated at the interface by the electric field, which deforms the drop. The peak electric field and the maximum electric stresses are all located at both poles of the drop along the vertical direction. The electric stresses deform the drop into an ellipsoid with a vertical long axis. Notably, the charge density (
 $\rho _e$) at the bottom of the drop increases drastically right before the drop touches the substrate, resulting in the enhancement of the electric field (
 ${\boldsymbol {E}}_B$) and the electric stress (
 ${\boldsymbol {f}}_{es}$). Such substantial increase in
 ${\boldsymbol {E}}_B$ and
 ${\boldsymbol {f}}_{es}$ only occurs within a 1 mm space between the drop to the substrate (
 $\delta <1\ {\rm mm}$). Figure 5(b) shows that the
 $\rho _B$ increases rapidly from
 $0.1$ to
 $7.2\,{\rm C}\,{\rm m}^{-3}$, or 72-fold, as
 $\delta$ decreases from
 $1\ {\rm mm}$ to
 $10\, \mathrm {\mu }{\rm m}$, while
 ${\boldsymbol {E}}_B$ and
 ${\boldsymbol {f}}_{esB}$ increase from
 $3.5\times 10^5$ to
 $6.5\times 10^7\,{\rm V}\,{\rm m}^{-1}$ (200-fold) and from
 $7.4\times 10^4$ to
 $4\times 10^{10}\,{\rm N}\,{\rm m}^{-3}$ (
 $1\times 10^6$-fold), respectively. The dramatic increase in
 ${\boldsymbol {f}}_{esB}$ accelerates the velocity of the drop bottom (
 ${\boldsymbol {U}}_B$) from
 $0.5\,{\rm m}\,{\rm s}^{-1}$ to nearly
 $10\,{\rm m}\,{\rm s}^{-1}$ before contact. The intense electric stress also causes a conical tip and leads to a point contact of the drop on the substrate without trapping any bubble.
(a) Diagram of the spatial electric potential ( $\varPhi$), polarization charge density (
 $\rho _e$) distribution and vector of electric stresses (
 ${\boldsymbol {f}}_{es}$) at the interface during the drop falling. (b) The potential (
 $\varPhi _B$) and polarization charge density (
 $\rho _{eB}$), (c) electric field strength (
 ${\boldsymbol {E}}_{B}$), (d) electric stresses (
 ${\boldsymbol {f}}_{esB}$) and velocity (
 ${\boldsymbol {U}}_B$) of the bottom point of the drop vary with the distance
 $\delta$ between the drop and substrate. The drop impacts the substrate at
 $We = 8.6$ (
 $Ca_g = 1.23\times 10^{-4}$) in an electric filed
 $\varGamma _E = 0.77$. See supplementary movie 3.

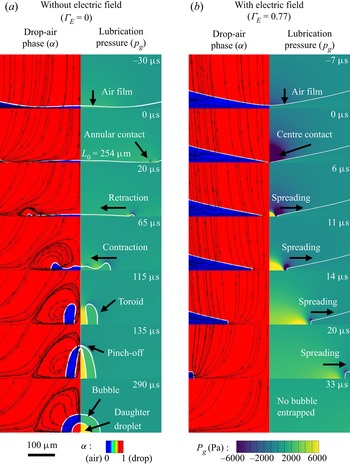
The evolution of the local streamline and pressure field are compared in detail during the contact process. In the absence of electric field ( $\varGamma _E = 0$), the left-hand subpanel of figure 6(a) shows that the streamline within the drop is downward before contact as the whole drop descends with the same impact velocity. Next, the bottom streamlines are deflected outward due to the deceleration of the drop bottom and increase of the air film pressure. The initial contact radius (
 $L_0$) is
 $253.6\, \mathrm {\mu }{\rm m}$ when the drop touches the substrate, and the pressure peaks at the initial contact position as shown in the right-hand subpanel of figure 6(a). Here the gauge pressure is used. At
 $t = 115\,\mathrm {\mu }{\rm s}$, the air film recoils into a toroidal bubble, which converges rapidly to the centre and is pinched off at
 $t = 135\,\mathrm {\mu }{\rm s}$, generating a tiny secondary (daughter) drop on the substrate. The bubble process is consistent with the experimental phenomenon in Thoroddsen et al. (Reference Thoroddsen, Etoh, Takehara, Ootsuka and Hatsuki2005) and Lee et al. (Reference Lee, Weon, Je and Fezzaa2012).
Comparison of evolution sequence diagrams of local streamline and pressure field at the bottom of the drops with and without an electric field. The white curves in the diagrams are the profile of the air film. (a) When no external electric field is applied ( $\varGamma _E = 0$), due to the deformation of the bottom and the subsequent contraction of the air film, the streamline begins to bend towards the centre. With the evolution of the air film, capillary waves appear, resulting in local vortices in the internal flow field. At the same time, the generation of capillary waves leads to local pressure peaks. Here the gauge pressure is used. (b) When an external electric field is applied (
 $\varGamma _E = 0.77$), the internal flow field of drops always follows the direction from the centre to the periphery, and local pressure peak appears only at the wet edge due to excessive local curvature. The drop impacts the substrate at
 $We = 8.6$ (
 $Ca_g = 1.23\times 10^{-4}$). The scale bar is
 $100\, \mathrm {\mu }{\rm m}$. See supplementary movie 4.

With the external electric field ( $\varGamma _E = 0.77$) in figure 6(b), the streamlines begin to converge towards the contact centre when a conical tip is formed. Due to the intense electric stress that pulls the bottom surface to form the conical tip, a zone of negative gauge pressure is formed near the contact centre, and the local pressure gradient gives rise to the flow velocity near the conical tip. After the contact, the substrate is gradually wetted from the centre to the periphery and the pressure is higher near the contact line due to the excessive local curvature. It is worth noting that during the spreading process, there is no whirlpool at the centre.
3.2. The air entrapment varying under different  ${E}$$_\infty$


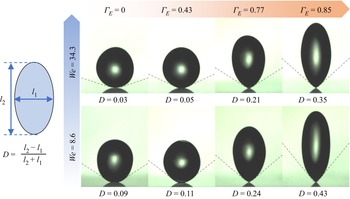
The drop undergoes an ellipsoidal deformation accompanied with weak oscillations caused by electric stresses when falling through the electric field. At the moment of initial contact, the drop deformation aspect ratio  $D$ is defined as
 $D=({l_2-l_1})/({l_2+l_1})$ (Ha & Yang Reference Ha and Yang2000), where
 $l_1$ and
 $l_2$ are the lengths of the vertical and parallel axis of the deformed drop relative to the electric field, respectively (see figure 7). For the same
 $We = 34.3$, as the external electric field increases, the drop is elongated more seriously with higher aspect ratio
 $D$ (from 0.03 at
 $\varGamma _E = 0$ to 0.35 at
 $\varGamma _E = 0.85$). At the same electric field
 $\varGamma _E = 0.85$, as the velocity of the drop decreases, the aspect ratio
 $D$ increases from 0.35 at
 $We = 34.3$ to 0.43 at
 $We = 8.6$. The larger deformation occurs with lower
 $We$ and higher
 $\varGamma _E$, which results in the bottom of the drop becoming sharper and the conical tip being formed more easily. This can be explained as follows. First, there is less time for a faster descending drop to respond to the electric field and deform. Second, a higher pressure of the air film is generated with a larger velocity for the drop, which works against the deformation caused by the electric field.
Ellipsoidal drops with different deformation aspect ratios  $D$ at the moment of initial contact in various electric fields. As the external electric field increases (
 $\varGamma _E$ varies from 0 to 0.85),
 $D$ becomes higher, from 0.03 to 0.35 (
 $We = 34.3$)(
 $Ca_g = 2.46\times 10^{-4}$) and from 0.09 to 0.43 (
 $We = 8.6$) (
 $Ca_g = 1.23\times 10^{-4}$), respectively. See supplementary movie 5.

Figure 8(a) shows the initial contact radius  $L_{0E}$ shrinks with the increase of
 $\varGamma _E$, and the contact moment is identified by the appearance of dark spots, which are caused by the reduced light reflection after the drop wets the ITO substrate. As
 $\varGamma _E$ increases, three representative distinct contact modes can be observed sequentially from the bottom view, which bears certain similarity to the contact states of charged drop (Gao et al. Reference Gao, Yi, Qi, Qiao and Deng2019) and under reduced air pressure (Li et al. Reference Li, Langley, Tian, Hicks and Thoroddsen2017b), respectively. (i) Annular contact with reduced air disc radius (annular contact mode): at
 $\varGamma _E = 0.12$, the initial contact radius
 $L_{0E} = 41\, \mathrm {\mu }{\rm m}$ is only
 $1/6$ of the normal initial radius
 $L_0$. The air disc retracts into a small bubble subsequently in figure 8(b). (ii) Multiple contact with concentric circular air rings (multiple contact mode): at
 $\varGamma _E = 0.14$, the centre contact appears (
 $L_{0E} = 0\, \mathrm {\mu }{\rm m}$) while there is also a second outer contact trapping a circular air ring, which is pinched off and shrinks into small bubbles. The outer contact occurs multiple times at the wetting edge subsequently, resulting in small bubbles distributed in concentric circles in figure 8(c). (iii) Centre contact without any air bubble trapped (centre contact mode): at
 $\varGamma _E = 0.15$, only the centre contact occurs and the wetting area expands from the central spot to a growing dark circular disc without any air bubble bigger than
 $1.35\, \mathrm {\mu }{\rm m}$ being captured in figure 8(d). Varying as the external electric field
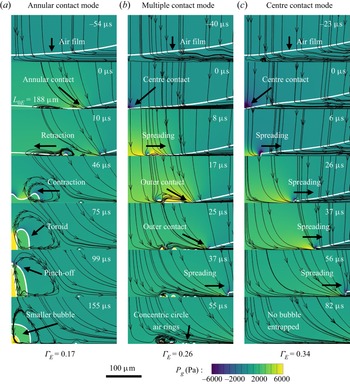
 $\varGamma _E$ in numerical simulation, three representative contact modes can also be obtained in figure 9, which are the same as the experiment. With some precision, there is a relatively quantitative agreement between experiments and simulations using the two-dimensional axisymmetric model, although a completely precise agreement is not achievable due to the three-dimensional effects and the impossibility of accurately modelling solid substrate conditions. For example, the gas film at contact is slightly elliptical (possibly due to the drop oscillations during falling and the substrate is not perfectly horizontal) and the circularly distributed small bubbles formed at the secondary contact. In the following, we explain the EHD mechanism of the three contact modes mentioned above in an external electric field.
Bottom-view images for representative contact states with different electric field strengths  $\varGamma _E$. (a) The initial contact radius
 $L_{0E}$ reduced with the increase in
 $\varGamma _E$. (b) Annular contact with reduced air disc radius when
 $\varGamma _E = 0.12$. (c) Multiple contact with concentric circular air rings when
 $\varGamma _E = 0.14$. (d) Centre contact without any air bubble trapped when
 $\varGamma _E = 0.15$. The shape of the drop bottom surface is schematically illustrated on the left-hand side. The drop impacts the substrate at
 $We = 8.6$ (
 $Ca_g = 1.23\times 10^{-4}$). The scale bar is
 $200\, \mathrm {\mu }{\rm m}$. See supplementary movie 6.

Comparison of evolution sequence diagrams of local streamline and pressure field at the bottom of the drops with different  $\varGamma _E$ in numerical simulations. The white lines in the diagrams are the profile of the air film. (a) Annular contact mode when
 $\varGamma _E = 0.17$. (b) Multiple contact mode when
 $\varGamma _E = 0.26$. (c) Centre contact mode when
 $\varGamma _E = 0.34$. The drop impacts the substrate at
 $We = 8.6$ (
 $Ca_g = 1.23\times 10^{-4}$). See supplementary movie 6.

The key parameters of the profile of the drop bottom are compared in figure 10. The time interval between data sets is  $20\,\mathrm {\mu }{\rm s}$. Figure 10(a–c) shows that the drop bottom begins to deform by the thin air cushion beneath for
 $h = 20\, \mathrm {\mu }{\rm m}$ at
 $\varGamma _E = 0.17$. This is because the pressure at the bottom centre is highest, which decelerates the bottom surface of the drop. Then the drop deformation develops into a dimple with the air disc expanding further and the peak pressure location moving to the contact line. Meanwhile, the charge density increases at the edge of the air disc due to the higher curvature, thus producing large electric stresses there. This leads to the increase of the instantaneous velocity of the drop surface at the edge of the air disc. Compared with the drop impact without electric field, the earlier touchdown reduces the air disc's further expansion and leads to a smaller contact radius.
Comparison of the key parameters of the profile of the drop bottom surface in representative contact states before the touchdown. (a–c) Annular contact mode at  $\varGamma _E = 0.17$. (d–f) Multiple contact mode at
 $\varGamma _E = 0.26$. (g–i) Centre contact mode at
 $\varGamma _E = 0.34$. Panels (a,d,g) show the profiles of the bottom of the drop. Panels (b,e,h) show the lubrication pressure distribution on the profiles. Panels (c, f,i) show the electric field stress distribution on the profiles, whereas the inset shows the velocity distribution on the profiles. Here the drop impacts the substrate at
 $We = 8.6$ (
 $Ca_g = 1.23\times 10^{-4}$). The time interval is
 $20\,\mathrm {\mu }{\rm s}$.

When the electric field increases to  $\varGamma _E = 0.26$, the bottom of the drop sharpens up before
 $h = 20\, \mathrm {\mu }{\rm m}$ (see figure 10d–f). The polarized charges accumulate at the lowest surface of the bottom and dramatically increase the electric stresses (
 ${\boldsymbol {f}}_{esB}$), which accelerates the drop bottom surface to higher velocity (
 ${\boldsymbol {U}}_{B}$). Meanwhile the bottom of the drop forms a dimple around the centre in figure 10(d–f). This is because the wetting area does not expand sufficiently quickly (
 ${\boldsymbol {U}}_B = 2.5\,{\rm m}\,{\rm s}^{-1}$ at
 $\varGamma _E = 0.26$) and the air around the contact centre is still compressed by the falling drop, and the lubrication pressure peaks at
 $r =50\, \mathrm {\mu }{\rm m}$. Consequently, a secondary contact is formed and an air toroid is entrapped. The evolution of the trapped air film is shown in supplementary figure S4(b,d).
With the electric field further increased to  $\varGamma _E = 0.34$, the radius of the curvature of the drop bottom decreases due to the more concentrated polarized charges and associated enhancement in electric stresses (see figure 10g–i). Therefore, the air film at the bottom remains connected to the open space, without trapping any air. In addition, the speed of the expending contact line is relatively high (
 ${\boldsymbol {U}}_B = 4\,{\rm m}\,{\rm s}^{-1}$ at
 $\varGamma _E = 0.34$) and no subsequent contact occurs, which is defined as a centre contact mode. (Specific data of
 $\rho _e$ and
 ${\boldsymbol {E}}$ of the profile of the drop bottom in the three contact modes mentioned above are provided in the supplementary figure S5.)
Figure 11(a) shows the profiles of the drop bottom at the contact moment with  $We = 8.6$ with different
 $\varGamma _E$. The initial contact radius (
 $L_{0E}$) decreases as
 $\varGamma _E$ increases, leading to the change of the contact mode from the annular contact mode to the multiple contact mode or centre contact mode. This is confirmed by the bottom-view images (see supplementary figure S3). Figure 11(b) shows the dimensionless initial contact radius (
 $Z = {L_{0E}}/{L_0}$) at various
 $\varGamma _E$ with different impact velocities. The data can be fitted by
 $Z = 1-{c_1}{\varGamma _{{{E}}}^{c_2}}$, where
 ${c_1}$ and
 ${c_2}$ depend on the impact velocity;
 $Z$ decreases with stronger
 $\varGamma _E$. However, the effect of
 $\varGamma _E$ is not as significant for higher
 $We$. This confirms the experimental finding that the bottom of the drop is determined by both
 ${\boldsymbol {U}}$ and
 $\varGamma _E$.
(a) The contour of the drop bottom surface at the moment of the contact with  $We = 8.6$ (
 $Ca_g = 1.23\times 10^{-4}$) in different external electric field intensities. (b) The dimensionless initial contact radius when varying the electric field strength with different impact velocities. The trend curves are obtained by fitting the data points.

4. Scaling law of critical electric field
4.1. Mirror charge model
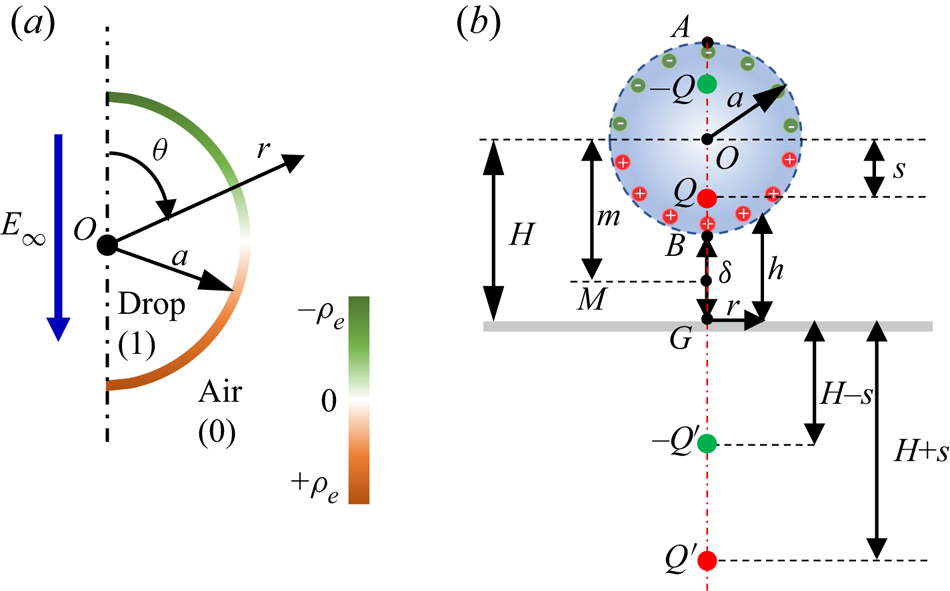
The surface charge induced by the electric field affects the electric field in the domain simultaneously, due to the coupling between the charge and the electric field. Taylor (Reference Taylor1966) gave an analytical solution to the electric field of a suspended drop in the electric field when the drop deformation is small (see figure 12a). The spatial potential  $\varPhi _0$ in polar coordinates (
 $r, \theta$) is
 \begin{equation} {{\varPhi }_{0}} = \left(r+\frac{1-R}{2+R}\frac{{{a}^{3}}}{{{r}^{2}}}\right){{{{\boldsymbol{E}}}}_{\infty }}\cos \theta, \end{equation}
where  $R={{{\sigma }_{1}}}/{{{\sigma }_{0}}}$ is the electrical conductivity ratios. The electric field along the radius direction (
 $r$) is
 \begin{equation} {{{{\boldsymbol{E}}}}_{0r}} ={-}\frac{\partial {{\varPhi }_{0}}}{\partial r}={-}\left[ 1+\frac{2(R-1)}{2+R}\frac{{{a}^{3}}}{{{r}^{3}}} \right]{{{{\boldsymbol{E}}}}_{\infty }}\cos \theta. \end{equation}
Based on Gauss's theorem ( ${{\rho }_{e}} = -\varepsilon {{{{\boldsymbol {E}}}}_{r}}$), the amount of electric polarization charge can be obtained by integrating the
 ${\rho }_{e}$ on the top or bottom hemispherical surface,
 \begin{equation} {{Q}} = 2{\rm \pi}\int_{0}^{{\rm \pi}/{2}} {{\rho }_{e}}{r}^{2}\sin \left(\theta \right)\,\text{d}\theta ={-}3{\rm \pi} {{\varepsilon }_{0}}{{a}^{2}}{{{{\boldsymbol{E}}}}_{\infty }}, \end{equation}
where the negative sign (‘ $-$’) means that the electrical properties of the polarized charge (
 $Q$) is opposite to
 ${\boldsymbol {E}}_{\infty }$. The polarized charge obtained numerically (
 $Q_{Simulation}$) shows good agreement with that by theory (see supplementary figure S7), qualitatively supporting the notion that the surface polarized charge of the drop is unchanged when the drop approaches the substrate.
(a) Schematic representation of  ${\rho }_{e}$ distribution in polar coordinates. (b) Schematic diagram of the mirror charge model when the drop is close to the grounded substrate, which is simplified by the charge dipole.

The separation of polarized surface charge allows us to treat the drop as a charge dipole. We further use the mirror charge model of this dipole to qualitatively explain the rapid growth of the  ${\boldsymbol {E}}_B$ and
 ${\boldsymbol {f}}_{esB}$ at the bottom of the drop. As shown in figure 12(b), we assume the following. (i) The drop is approximated as a sphere that could quantify the surface charge using Taylor's solution. We note that for
 $\varGamma _E < 0.43$, the deformation of the drop is small (with
 $D < 0.11$) (see figure 7), and the spherical assumption is reasonable. (ii) The charge polarization is a much more rapid process than the drop deformation (
 ${t}_{E } \ll \textit {t}_{\mu }$), therefore the charge separation has completed before the deformation. (iii) The charge is distributed equally on the top and bottom of the drop hemisphere. (iv) The internal electric field of the drop is negligible. (v) The substrate is a conductive plane of zero potential. The electric field of the non-uniformly distributed induced charges can be equivalent to that generated by point charges located on the central axis of the drop. We assume the distance from the centre of the drop (point O) to the point charge is
 $s$. Here
 $H$ is the distance between O and the substrate (point G). According to the method of mirror charge (Papadopoulos Reference Papadopoulos1963), there is a point charge with opposite charges at a symmetrical position on the lower side of the grounded conductive substrate. The space electric field formed by the surface charge can be replaced by four equivalent point charges. First, the potential at point A on the upper of the drop is
 \begin{equation} \varPhi_{{A}} = \frac{1}{4{\rm \pi} {{\varepsilon }_{0}}}\left( \frac{-Q}{a-s}+\frac{Q}{a+s}+\frac{-{{Q}^{'}}}{2H+a-s}+\frac{{{Q}^{'}}}{2H+a+s} \right). \end{equation}
The electric potential at point B at the lower part of the drop is
 \begin{equation} \varPhi_{B} = \frac{1}{4{\rm \pi} {{\varepsilon }_{0}}}\left(\frac{-Q}{a+s}+\frac{Q}{a-s}+\frac{-{{Q}^{'}}}{2H-a-s}+\frac{{{Q}^{'}}}{2H-a+s} \right). \end{equation}
Because the electric field inside the drop is approximately 0,
 \begin{equation} {\varPhi _{A}} = {\varPhi _{B}}. \end{equation}
The distance between the drop and the substrate is  $\delta = H-a$. Substituting that into (4.4), (4.5) and (4.6), the location of charge centre (
 $s$) is
 \begin{equation} s = \sqrt{-{{a}^{2}}-2a{\delta }-2a H+4{{{H}}^{2}}}. \end{equation}
Equation (4.7) suggests that  $s$ approaches
 $a$ with the decrease of
 $\delta$, and the charge on the surface of the drop is concentrated at point B when the drop contacts the substrate. The electric field at point B is
 \begin{equation} {{{{\boldsymbol{E}}}}_{B}} = \frac{Q}{4{\rm \pi} {{\varepsilon }_{0}}}\left( \frac{1}{{{\left( a+s \right)}^{2}}}-\frac{1}{{{\left( a-s \right)}^{2}}}-\frac{1}{{{\left( 2H-a-s \right)}^{2}}}+\frac{1}{{{\left( 2H-a+s \right)}^{2}}} \right), \end{equation}
which can be simplified by substituting (4.7) into the above equation:
 \begin{equation} {{{{\boldsymbol{E}}}}_{B}} = \frac{Q}{4{\rm \pi} {{\varepsilon }_{0}}}\left( \frac{-1}{a\delta } \right)=\frac{3a}{4\delta }{{E}_{\infty }}. \end{equation}
Equation (4.9) suggests that the  ${\boldsymbol {E}}_B$ at the bottom of the drop increases sharply as
 $\delta$ decreases. The characteristic electric field stress
 ${\boldsymbol {f}}_{esB}$ is
 \begin{equation} {{{{\boldsymbol{f}}}}_{{esB}}} = \frac{1}{2}{{\varepsilon }_{0}}{{{{\boldsymbol{E}}}}_{B}}^{2}=\frac{9{{\varepsilon }_{0}}{{a}^{2}}}{32{{\delta }^{2}}}{{\boldsymbol{E}}}_{\infty }^{2}. \end{equation}
Therefore, the scaling law of  ${{{\boldsymbol {E}}}_{B}}$ and
 ${\boldsymbol {f}}_{esB}$ versus
 $\delta$ can be obtained,
 \begin{equation} {{{{\boldsymbol{E}}}}_{B}}\sim \frac{a}{\delta }{{{\boldsymbol{E}}}_{\infty }},\quad {{{{\boldsymbol{f}}}}_{{esB}}}\sim \frac{{{\varepsilon }_{0}}{{a}^{2}}}{{{\delta }^{2}}}{{\boldsymbol{E}}}_{\infty }^{2}. \end{equation}
The (4.11a,b) can describe the rapid growth of the  ${{{\boldsymbol {E}}}_{B}}$ and
 ${\boldsymbol {f}}_{esB}$ when the external electric field is within a suitable range, which is verified by the numerical simulation results (see supplementary figure S6). When
 $\varGamma _E < 0.26$, the drop is concave; when
 $\varGamma _E < 0.68$, the drop undergoes significant ellipsoidal deformation. The assumption (i) in both cases is no longer precise, resulting in a noticeable deviation from the scaling law (4.11a,b).
4.2. Scaling law for critical electric field to introduce conical tip formation
Klaseboer, Manica & Chan (Reference Klaseboer, Manica and Chan2014) showed that for the charge neutral drop impact, the profile of the drop bottom surface is governed by the balance between drop inertia and lubrication pressure. While exposed in an electric field, the additional electric stress may become comparable to the lubrication pressure. The air film is mainly affected by the combined effects of gravity, Laplace pressure ( ${{p}_{\gamma }} = {2\gamma }/{a}$), the lubrication pressure (
 $p_g$) and the electric stress (
 ${\boldsymbol {f}}_{esB}$). Here the gravity and surface tension are relatively small and can be neglected.
The airflow is assumed to be incompressible because  $p_g$ is much smaller than the ambient pressure (
 $P_{0} = 10^5\,{\rm Pa}$) in this study, which is also confirmed by the compressibility factor
 $\epsilon \equiv P_{0} /(a \mu _{0}^{-1} {{\boldsymbol {U}}}^{7} \rho _{1}^{4})^{1 / 3}$ criteria. For
 $\epsilon ^{-1} < 3$, no significant compression of the air disc is expected (Mandre et al. Reference Mandre, Mani and Brenner2009; Li & Thoroddsen Reference Li and Thoroddsen2015). In this work,
 $\epsilon ^{-1}$ is in the range of 0.08–2 for the drop velocity (0.5–2 m s
 $^{-1}$), which suggests the incompressible flow assumption is still valid. The lubrication pressure field at the bottom of the drop can be obtained by the lubrication approximation of the Reynolds equation in an axisymmetric form (Chan, Klaseboer & Manica Reference Chan, Klaseboer and Manica2011),
 \begin{equation} \frac{1}{r}\frac{\partial }{\partial r}\left( \frac{{{h}^{3}}}{12{{\mu }_{0}}}r\frac{\partial p}{\partial r} \right)=\frac{\partial \left( h \right)}{\partial t}, \end{equation}
where  $h$ is a function of
 $r$:
 $h = \delta +a-\sqrt {{{a}^{2}}-{{r}^{2}}}$. Integrating both sides and rewriting the equation, we obtain
 \begin{equation} p_{g}(r)={-}3{{\mu }_{0}}\frac{\delta +a-2\sqrt{{{a}^{2}}-{{r}^{2}}}}{{{(\delta +a-({{a}^{2}}-{{r}^{2}}))}^{2}}} \frac{\partial H}{\partial t}-3{{\mu }_{0}}\frac{1}{a}{\boldsymbol{U}}. \end{equation}
Recognizing the air viscosity is relatively small at the position of the drop axis (when  $r=0$),
 $p_g$ can be simplified as
 \begin{equation} {{p}_{g}} = \frac{3{{\mu }_{0}}a}{{{\delta }^{2}}}{\boldsymbol{U}}. \end{equation}
The scaling law of the  $\varGamma _E$, the critical value that is sufficient to induce the formation of the conical tip, is obtained by comparing
 ${\boldsymbol {f}}_{esB}$ and
 $p_g$ of the drop:
 \begin{equation} {{{\boldsymbol{f}}}_{{esB}}}\sim {{p}_{g}}\Rightarrow {{\boldsymbol{E}}}_{\infty }^{2} \sim \frac{{{\mu }_{0}}{\boldsymbol{U}}}{{\varepsilon }_{0}a}\Rightarrow {{\varGamma }_{E}}\propto \sqrt{C{{a}_{g}}}. \end{equation}
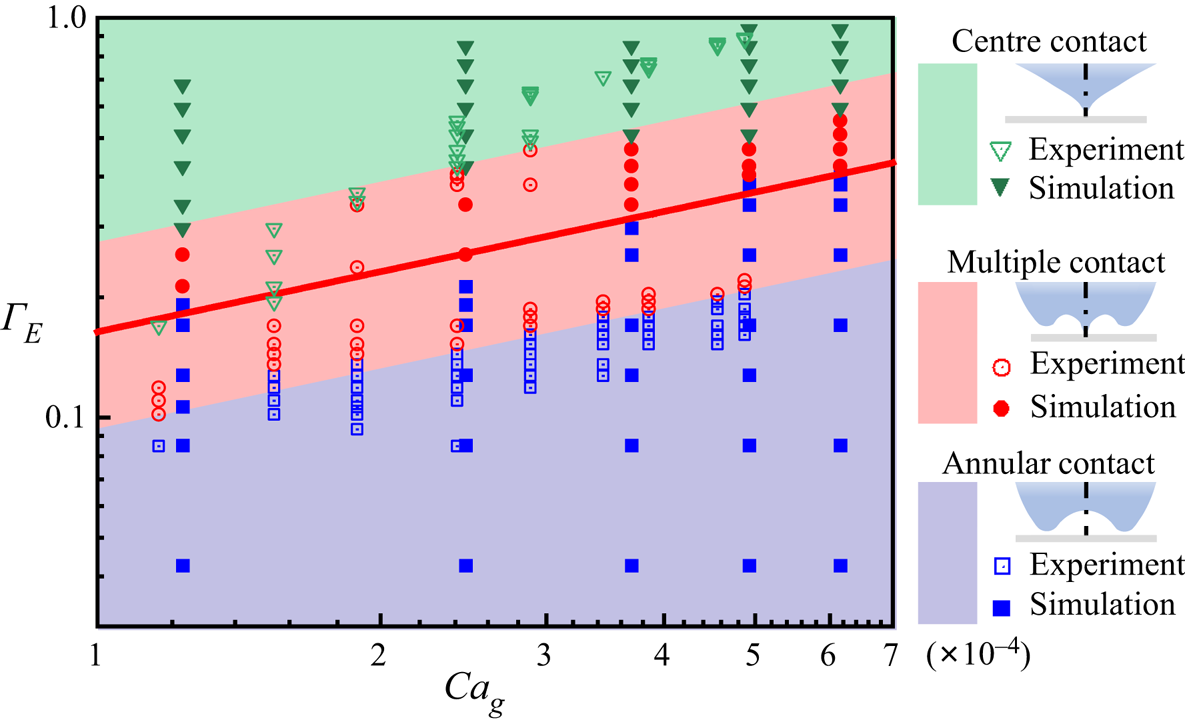
The numerical and experimental data for different  $\varGamma _E$ and
 $Ca_{g}$ are plotted in figure 13, together with the critical dimensionless strength of electric field (solid line) predicted by fitting equation (4.15). Both the numerical and experimental data are in good agreement with (4.15), which shows a positive correlation between
 $\varGamma _E$ and
 $Ca_{g}$. Even with relatively high
 $Ca_{g}$, the electric field is well below the Taylor limit of critical field, which is not a harsh requirement to achieve the goal of regulating the impact dynamics and avoiding the air entrapment.
Experimental data and simulation data versus the critical dimensionless electric field strength. The solid curves are the critical dimensionless electric field strength predicted by (4.15).

5. Conclusions
The EHD behaviour of air entrapment when a neutral drop impacts onto a flat solid surface under an external electric field is investigated experimentally and numerically. The electric field may entirely change the behaviour of air entrapment by altering the initial contact state during the drop impact on a flat smooth surface. The electric field introduces the polarized charge that is concentrated at the bottom poles of the drop. Notably, the electric stress at the bottom of the drop ( ${\boldsymbol {f}}_{esB}$) increases rapidly due to the locally intensified charge density at the surface when the distance between the drop and the substrate is within one millimetre. In this very short time and small space,
 ${\boldsymbol {f}}_{esB}$ dominates the subsequent air entrapment and the contact state of the drop with the substrate. Three representative contact modes (annular contact mode, multiple contact mode and centre contact mode) and subsequent air film evolution processes with different level of dimensionless electric field (
 $\varGamma _E$) are studied. Two key factors that determine the contact mode can be obtained: the bottom shape of the drop and the instantaneous velocity
 ${\boldsymbol {U}}_B$, both of which depend on the
 $\varGamma _E$.
As the  $\varGamma _E$ is raised above a critical value, the electric stress counteracts the effect of the lubrication pressure and forms a conical tip at the bottom of the drop quickly instead of a dimple. The centre contact of the tip on the substrate generates a circular contact line moving outwards with the air film still connecting to the external atmosphere, resulting in no air bubble trapped. The critical
 $\varGamma _E$ only depends on the square root of capillary number based on the air viscosity (
 ${{\varGamma }_{E}}\propto \sqrt {C{{a}_{g}}}$), which is built based on the dipole mirror charge model. This scaling law of the critical electric field is verified experimentally and numerically. This work brings insights for mitigating bubbles and voids defects into applications such as inkjet printing and droplet-based additive manufacturing.
Supplementary material and movies
Supplementary material and movies are available at https://doi.org/10.1017/jfm.2022.439.
Funding
This work was supported by the National Key Research and Development Program of China (no. 2021YFB3200700), the National Natural Science Foundation of China (grant nos. 11932009 and 51906073), the Natural Science Foundation of HuBei Province (2020CFA028) and the Academic Frontier Youth Team of Huazhong University of Science and Technology (2017QYTD05). The computation is completed in the HPC Platform of Huazhong University of Science and Technology.
Declaration of interests
The authors report no conflict of interest.
Author contributions
Y. Tian and Y. Liu contributed equally to this work.