The American Political Science Association's (APSA) Task Force on Inequality
and American Democracy (2004) asserts that
inequality is on the rise in the U.S., and democracy's future may be dim.
These assertions are allegedly supported by empirical evidence.
The report's analyses of public opinion and political participation, however,
are flawed. To establish this, I draw on American National Election Studies
(ANES) between 1964 and 2004.1
American
National Election Studies are conducted by the University of
Michigan's Center for Political Studies, and the data are made
available by the Inter-University Consortium for Political and
Social Research. I am responsible for all analyses and
interpretations.
Those parts of the report dealing with
institutional politics and public policy are beyond my ken.
Attitudes about Government and Other Institutions
The Task Force interprets shifting attitudes about government
trustworthiness and responsiveness to mean that “Americans are
increasingly worried about disparities of participation, voice, and
government responsiveness.” Americans are said to believe that
government is in thrall to well-to-do “special interests” (2004, 5).
Changes in Americans' trust and confidence in government, and feelings
that government is attentive and responsive to public opinion are a
thicket, threatening to entangle the unwary. Alford (2001, 46) noted that “we have not yet adequately explained
large scale over-time variation in levels of trust” (see also Citrin and Luks 2001).2
Some of what seems to be declining faith in elections
may be artifactual. According to Bartels (2002, 76), once changes in the order that queries
about government attentiveness to public opinion are taken into
account, faith in elections “has been remarkably durable.”
Changing question format complicates over-time comparisons even
more. For example, the ANES items tapping what is now called
external political efficacy, a disposition often equated with
perception of governmental responsiveness, were originally
dichotomous: agree, disagree. Since 1988, however, these items
have had multiple response categories: strongly agree, agree
somewhat, neither agree nor disagree, disagree somewhat,
strongly disagree.
Most of the decline in public trust
in government occurred between the mid-1960s and 1980 (
Alford 2001;
Citrin and Luks
2001), when the Task Force claims that income inequality was
low (
2004, 3).
Even more troublesome for the Task Force's interpretation of growing
cynicism are findings that income had virtually no impact on trust in
government or confidence in government leaders (Alford 2001, 36–38). The 2000 and 2004 ANES showed virtually
no relationship between family income and a four-item Trust in
Government Scale, and a very anemic association between income and a
two-item indicator of external political efficacy.
Two other factors vex the Task Force's explanation for declining trust in
government. First, Americans lost confidence in politicians and the
leaders of “institutions of opposition”—such as the press, television,
and organized labor—at the same time (Cook and Gronke
2005, 792). Second, Blendon and his associates' (1997) report of why Americans don't trust
government casts even more pall on the Task Force's interpretation.
According to Blendon et al., when asked why they distrusted the
government in 1995, “the main reason Americans gave revolved around the
way the federal government spends money” (1997, 210). Inefficiency, or “spending on the wrong things”
exceeded “special interests too influential” as reasons why people
distrusted the federal government (see Blendon et al. 1997, Figure 8.4, 210).
Political Participation and Equality
The heart of the Task Force's report (2004,
5–11) deals with several facets of political participation. There are
several problems with this section, including the premise that activism
matters, which may not be true (see Weissberg
2005).
As have others, Ginsberg (1986, 48–50) warned
that, unlike spontaneous riots, voting and other forms of
election-related activity tend to be top-down mechanisms for elite rule,
and not a way for common folk to demand additional government services.
As Ginsberg put it (1986, 48–49), “With the
advent of the election, control over the agenda for the expression of
political opinion passes from the citizen to the state” (see also Weissberg 2005).
The Task Force notes that the wealthy turn out on Election Day and
perform more demanding political activities at higher rates than do the
poor (2004, 5–8). The report also argues that
since the well-to-do participate at higher rates than those from lower
income groups, these “Disparities in participation ensure that ordinary
Americans speak in a whisper while the most advantaged roar” (2004, 11). “Unequal voice[—created by class
“disparities in participation”—] matters because the advantaged convey
very different messages to government officials than do average citizens
or those who are the least well off” (11). Apparently George Soros'
policy attitudes are closer to Richard Mellon Scaiffe's than they are to
Cindy Sheehan's.
Scholars have long known that the wealthy participate at higher rates
than the middle- and working-classes. A more important question asks
whether non-voting contributes to skewed public policies. A number of
studies have not found large differences between the presidential
preferences and policy attitudes of voters and nonvoters (Leighley 1995 summarizes this evidence).
The 2000 and 2004 ANES reveal no statistically significant differences
between voters' and non-voters' attitudes about gun control, the death
penalty, protecting homosexuals against job discrimination, government
assistance to Blacks, and government spending for defense.3
On the Government Assistance to Blacks, Defense
Spending, and the Welfare State Scale, lower scores signify
liberal stances, higher scores designate conservative points of
view.
All questions were identical.
4 In order to maintain the same categories, it was
necessary in 2000 to utilize only those cases interviewed in
person. Respondents interviewed by telephone were not offered
the same range of categories as those interviewed in person for
the following issues: government aid to blacks, defense
spending, government responsibility for jobs and living
standards, public versus private health insurance programs, and
government spending for domestic social services.
Voters' and non-voters' attitudes about abortion and the welfare
state
5 The Welfare State Scale was
built from three items: attitudes about government
responsibility for jobs and living standards, attitudes about
government versus private health insurance programs, and
attitudes about government spending for domestic social
services. The scale ranged from 1 (very supportive of the
welfare state) to 19 (very opposed to the welfare state). The
scale's coefficient alpha was .60 in 2000 and .72 in
2004.
were significantly different, although none of
the Kendall's tau-c values was higher than .16, and the rest were lower
than .10. Non-voting might skew the “voices” heard by public officials
concerning abortion and the welfare state, but not for other issues.
Even in the cases of abortion and the welfare state, any policy skew
would be slight.
Consider just one other type of participation: donating to campaigns.
According to the Task Force, “Campaign contributors are the least
representative group of citizens,” (2004, 7),
because the wealthy are much more likely to donate to campaigns than are
the poor and middle class. Although the relationship between family
income and campaign contributing was statistically significant in 2000
and 2004, the relationships were weak. In 2000, the point-biserial
correlation coefficient for the relationship between family income and
donating to a party or candidate was rpb = .20. Four years
later, the same relationship was rpb = .18.
There is no gainsaying the fact that wealthy persons contribute
disproportionately to American campaigns, probably for the reason noted
by Weissberg (2004–2005, 34). Someone making
$20,000 a year might find better ways to spend her money than making a
small contribution to a campaign, while multi-millionaires would not
miss seven-figure donations.
The report also notes that, even though many groups representing the
“previously unorganized” have been created lately, “Interest Groups for
the Well-Off Dominate Washington” (2004, 8–9),
which may be unassailable.6
The 1996 ANES
asked about involvement in political issue groups, civic groups,
liberal or conservative groups, and party or candidate groups.
The point-biserial correlation coefficient for the relationship
between family income and involvement with at least one
political group was rpb = .10. The 2000 and 2004 ANES
asked about membership “in any organization,” which could
include either political or non-political organizations. In
2000, the point-biserial correlation coefficient for the
relationship between family income and membership in an
organization was rpb = .18. In 2004, the same
coefficient was rpb = .25.
But, is this new?
In
1960, E. E. Schattschneider wrote that “the
pressure system has an upper-class bias” (32). This was just before the
U.S. sought greater equality for Blacks and Lyndon Baines Johnson
launched “the Great Society.”
The Task Force contends that political parties, once the vehicles for
mobilizing masses of ordinary citizens, have now become agents of what
Schier (2000, 1), whose work is cited in the
report, calls the politics of “activation,” or “identifying and
activating the small segment of citizens most likely to ‘get their
message’ and vote or lobby government.” What is worse, from the Task
Force's point of view, the two major parties “intensify the skewed
participation in U.S. politics by targeting many of the resources on
recruiting those who are already the most privileged and involved”
(2004, 10).
The Task Force's focus on parties' penchant for activating mainly their
well-to-do adherents occasions three comments. First, as Schier noted
(2000), the strategy of activation is a
rational response by the parties to their weakened condition. At that,
however, the link between family income and reports of being contacted
by one of the parties is weak. In 2000, the point-biserial correlation
coefficient for the relationship between family income and respondents'
reports of being contacted by one of the parties during the campaign was
rpb = .12. Four years later, the same coefficient was
rpb = .20.
Finally, the parties may have become very dependent on wealthy
contributors, but they remain far apart on issue after issue. Some
wealthy persons are on the “left” side of the political spectrum, others
are on the “right” side.
Income and Public Opinion
The Task Force evidently assumes that persons from society's lower social
orders have fundamentally different, and conflicting, interests with
those from the higher rungs of the economic ladder.7
The Task Force repeatedly refers to wealthy persons as
“the privileged” or “the advantaged.” Evidently, it does not
matter whether one was born into great wealth, such as Ted
Kennedy, or rose from humble origins, such as Janice Rogers
Brown.
The Task Force seems to assume that the type of
“class conflict” that may have existed during the 1930s and 1940s still
exists, or at least should.
The 2000 and 2004 ANES do not suggest that the poorest and wealthiest
segments of society are at loggerheads on key policies: gay people's
rights, the death penalty, abortion, government assistance to African
Americans, defense spending, and the welfare state. (These are the same
policies considered in the section above.) Family income is broken into
quintiles.
It would be mistaken to assert that family income is orthogonal to the
attitudes depicted in the table but the relationships are generally
quite small. Indeed, as estimated by chi-square (χ2), several
are not significant at ρ = .05.
The exceptions are for the relationships between family income and
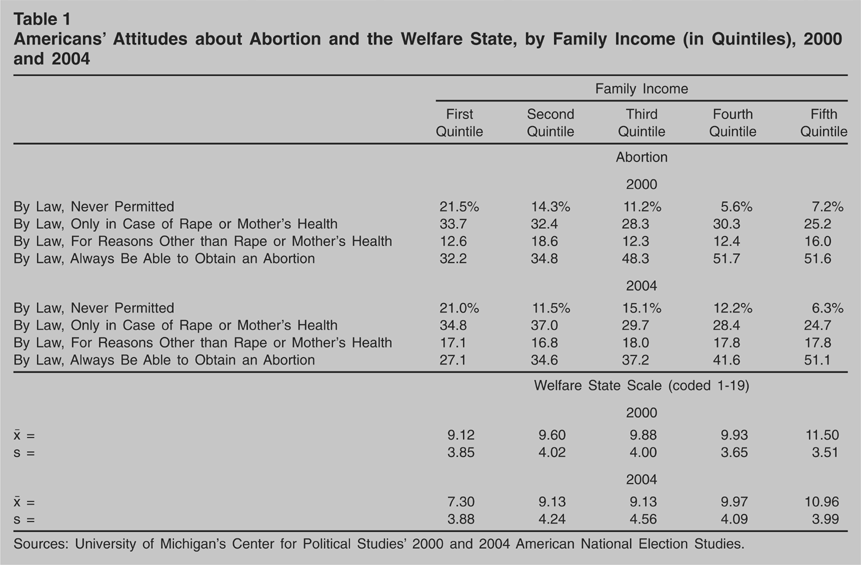
attitudes about abortion and toward the welfare state. Table 1 displays the relationships shown by
χ2 to be statistically significant. For abortion, the
table displays each income quintile's attitudes about the issue. For the
Welfare State Scale, the table depicts each income quintile's mean score
and standard deviation. Even when the χ2 values indicate
statistical significance, the values of Kendall's tau-c are typically
quite modest. Even the association between income and attitudes about
the welfare state was not strong. In 2000, the value of Kendall's tau-c
was .16; four years later it was .21.
Americans' Attitudes about Abortion and the Welfare State, by
Family Income (in Quintiles), 2000 and 2004
It should also be noted that the correlations between income and
partisanship and ideology are generally weak. In 2000, for example, the
value of Kendall's tau-c for the relationship between family income and
ideology was .05. The same statistic for the association between family
income and party identification was .11. Four years later, the value of
tau-c for the relationship between family income and ideology was .07,
while the tau-c for the relationship between family income and
partisanship was .12. Controlling for race reduced the strength of these
relationships.
Finally, the 2000 and 2004 ANES do not show strong correlations between
income and presidential voting. Looking at just George W. Bush vs. Al
Gore in 2000 and Bush vs. John Kerry in 2004, the relationships were
statistically significant, but the value of Kendall's tau-b was .11 in
2000 and .16 four years later. Moreover, controlling for race weakened
the relationships.
Conclusions
The Task Force's report relies on a single survey, the 1990 Citizen
Participation Study which, by 2004, was 14 years old. Surveys are akin
to “snap shots,” freezing phenomena, and quickly get out of date. One
would have expected more recent data and multiple observations as the
basis for generalizations about the American public. Furthermore, the
way in which the Task Force presented data from the 1990 Citizen
Participation Study tends to accentuate differences between Low and High
Income groups on several civic activities (see 2004, Figure 2, 6). If the panoply of income categories had
been included, instead of just those at the bottom and the top, would
differences between them have been as striking?
There is also a tendency to over-generalize, to make global conclusions
when even the data presented by the Task Force indicate greater nuance
than often seems appreciated. Certainly the data from the 2000 and 2004
ANES indicate less global generalizations need to be made.
Those parts of the report dealing with public opinion and political
participation are disappointing. Additional data should have been
assessed, and more balanced conclusions drawn. The American public is
wondrously, sometimes maddeningly, complex, but this is all-too-often
over-looked or ignored.