

NOMENCLATURE
- Bi
Biot number, Bi = (Lc h)/k
- H
heat transfer coefficient
- K
turbulent kinetic energy or thermal conductivity
- Lc
characteristic length, defined as the volume divided by the surface area
- M
Mach number
- P
pressure
- T
temperature
- X
horizontal ordinate
- Y
vertical ordinate
- y+
non-dimensional wall boundary parameter,
 ${\sqrt{\tau _{w}/\rho}\,y\,/\,\upsilon}$
- y
distance to the wall boundary
- Z
longitudinal ordinate
- ε
turbulence dissipation rate
- ω
specific dissipation rate
- ν
kinematic viscosity
- ρ
density
- τw
wall shear stress

1.0 INTRODUCTION
To achieve high thrust, the first-stage nozzle guide vanes (NGVs) of gas turbine engines are always exposed to a high-temperature harsh environment and recognised as one of the most failure-prone components(Reference Saravanamuttoo, Rogers and Cohen1,Reference Graeme, Cheeseman, Maxwell, Davison and Patnaik2) . Their service life is strongly dependent on temperature(Reference Salvadori, Montomoli, Martelli, Chana, Qureshi and Povey3). It is known that the temperature distribution at the combustor exit or turbine inlet is not uniform, particularly for some engines. The hot-streaks from the combustor can have a significant impact on the NGV service time(Reference Salvadori, Montomoli, Martelli, Chana, Qureshi and Povey3,Reference Jenkins and Bogard4) .
Due to the difficulties to accurately predict the hot-streak effect under engine flight conditions, engine designers have to budget for hot streaks in the cooling system design(Reference Qureshi, Beretta and Povey5). The cooling system is conventionally designed for a higher mainstream temperature than the mean gas temperature, which imposes a considerable performance penalty. An improper cooling budget can result in either component life reduction or unnecessary performance penalty. Therefore, it is necessary to perform experimental and numerical studies of the hot-streak effect on the aerodynamics and heat transfer of NGVs.
Qureshi et al.(Reference Qureshi, Beretta and Povey5) carried out an experimental and numerical investigation on the inlet temperature distortion (hot-streaks) effect on a high-pressure (HP) unshrouded NGV. The NGV was operated as part of a full HP turbine stage in an annular rotating turbine test facility, and the temperature distortion generator gave a temperature variation in a range of 300–550 K They found that significant span-wise heat flux variations arose with the inlet temperature distortion. For the pronounced temperature profile considered, substantial changes were observed in the Nusselt number up to 17%. Their numerical predictions were generally in good agreement with their experimental data. Khanal et al.(Reference Khanal, He, Northall and Adami6) numerically investigated the combined effect of hot-streaks and swirl on the same HP NGV, and the experimental conditions and data obtained from the previous paper were used in the simulations. The results revealed that distinctive radial migrations of hot fluid in the NGV and rotor flow passages had substantial impact on the aerothermal environment, and the aerofoil heat transfer characteristics could be strongly affected by the swirl direction and clocking position. Barigozzi et al.(Reference Barigozzi, Mosconi, Perdichizzi and Ravelli7) experimentally and numerically studied hot-streak migration in a linear cascade with showerhead film cooling at an inlet turbulence intensity of 9%, inlet temperature distortion from 284 to 306 K and an exit Mach number of 0.4. A superposition approach was used to assess the effects of mixing and coolant interaction on the hot-streak reduction, and it was found that the accuracy was within 12% on the leading-edge region in the central section of the vane span.
There are a number of difficulties encountered when numerically investigating the hot-streak effect on high-fidelity air-cooled NGVs and shrouds with well-defined boundary settings under flight conditions. First, the geometry of practical NGVs and shrouds is complicated, particularly for internal cooling flow passages. Second, for accurate heat transfer prediction, a fine mesh is required near the walls(Reference Jiang, Wu and Zhong Zhang8), and as a result, the mesh size is rather large even for a single NGV and shrouds assembly. Third, it is difficult to obtain relevant boundary conditions since both the combustor and secondary air-cooling flow fields are involved. As mentioned by Harsqama et al.(Reference Harsqama, Burton and Chana9), the secondary air-cooling flow has significant effect on the end-walls of an air-film cooled NGV. Fourth, to adequately study the hot-streak effect, a single high-fidelity NGV simulation is no longer suitable since the flow passing over each NGV is no longer the same. As a result, the periodic boundary condition for the single NGV simulation cannot be assumed, and the NGV sector simulation is required.
The present investigation follows two steps: one for a combustor sector with simplified ten NGVs and three thermocouples attached; and the other for the NGV sectors where each sector consists of one high-fidelity NGV and nine dummy NGVs. The first step identifies which NGV has the highest thermodynamic load and provides the inlet flow parameters for the second step. The high-fidelity computational fluid dynamics models, numerical methods, engine operating conditions, boundary conditions, results, and conclusion are discussed in the following sections.
2.0 HIGH-FIDELITY CFD MODELS
2.1 Computational domain and mesh of combined combustor-NGVs
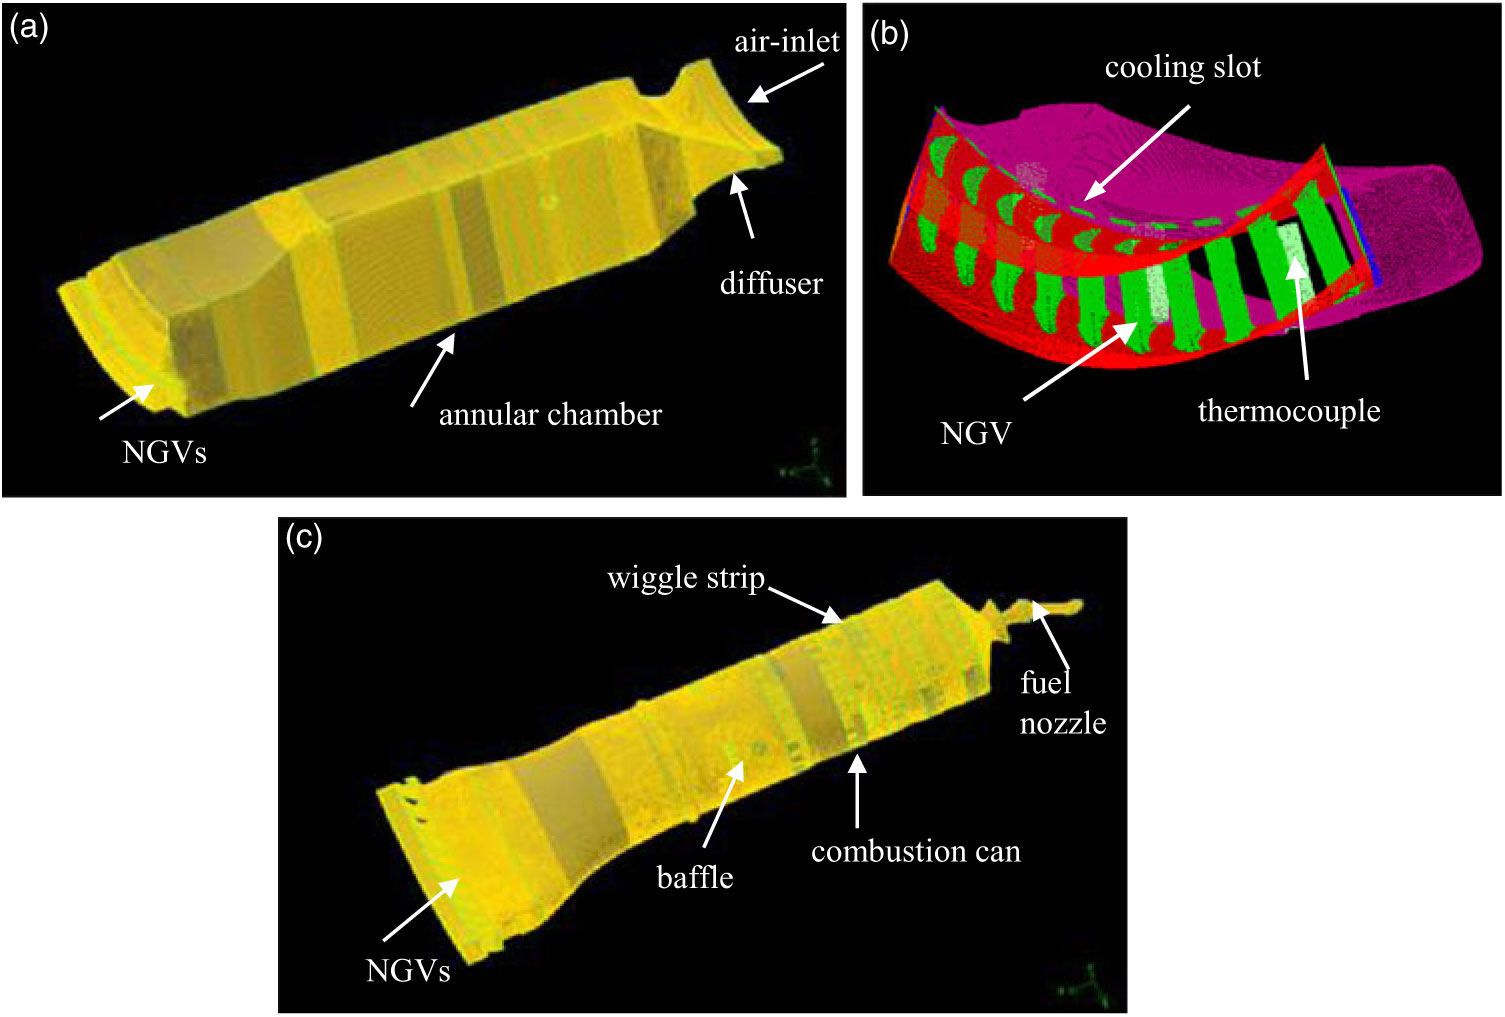
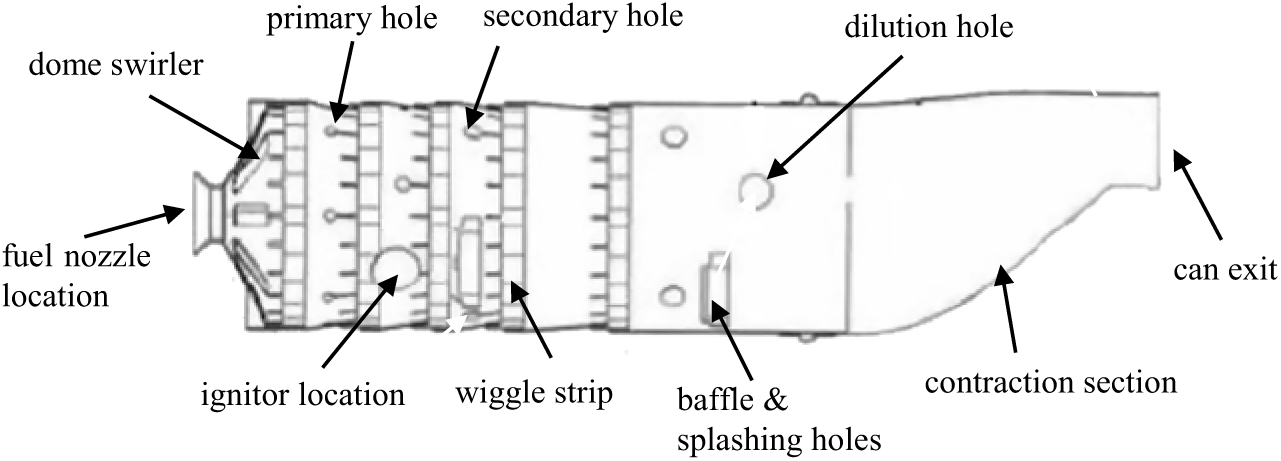
The computational domain and mesh of a 60° sector of a conventional can-annular gas turbine combustor, with simplified ten NGVs and three thermocouples, is shown in Fig. 1. The whole mesh is illustrated in Fig. 1(a), the zoomed view of the three thermocouples, ten NGVs and ten NGV cooling air supply slots at the end of the annular chamber is presented in Fig. 1(b), and the high-fidelity combustion can mesh is displayed in Fig. 1(c). Figure 2, a combustion can sketch, shows the can components meshed in Fig. 1(c), including the dome swirler, fuel injector, ignitor body, wiggle strips, primary, secondary and dilution holes, baffles and baffle splashing holes (beneath baffles). For the simplified NGVs, only the external surfaces were meshed, and the internal cooling flow passages and solid bodies were not considered in this piece of work. To compensate the NGV cooling effect, the mean cooling flux from the simulation of a single high-fidelity NGV(Reference Jiang, Wu and Zhong Zhang8) was defined at the NGVs external surfaces. More details of the mesh and mesh independent study can be found in Jiang et al.(Reference Jiang and Corber10). A mesh with 17.4 million cells was used for the simulation.
Computational domain and mesh of a 60° sector of the combustor-NGVs: (a) the whole mesh, (b) the NGV and thermocouple surface mesh and (c) the can, NGVs and thermocouples mesh.

The combustion can sketch.

As illustrated in Fig. 1, compressed air enters the annular chamber through a narrow annulus and then flows over and enters the combustion can through air-management elements around the can or liner. Inside the can, fine fuel droplets from an air-assist fuel nozzle evaporate, mix with air and then burn. Eventually, the combustion mixture reaches the thermocouples and NGVs.
2.2 Computational domain and mesh of the NGV sector
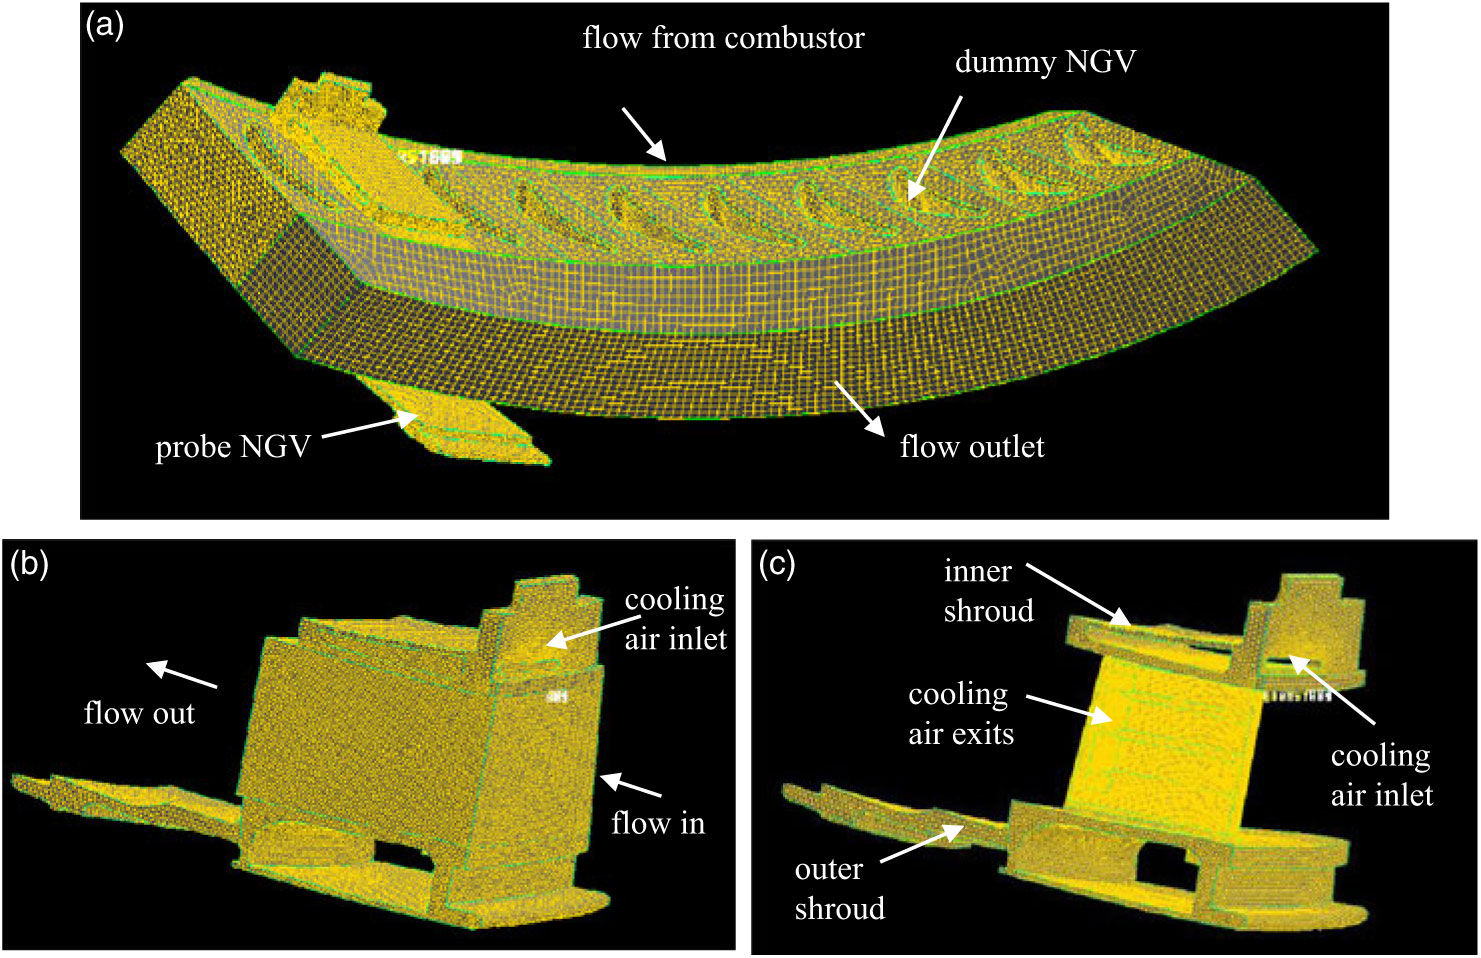
The computational domain and mesh of a 60° NGV sector with the high-fidelity NGV (probe NGV) located at the second position, looking upstream from left, and nine dummies is illustrated in Fig. 3(a). The probe NGV and its metal region meshes are given in Fig. 3(b) and (c), respectively. The computational domain of the NGV sector begins at the middle cross section between the thermocouples and NGVs, as shown in Fig. 1, and is extended to half of the NGV chord length in the downstream direction. Fine node distributions were laid near the probe NGV internal and external walls, cooling air slot, holes and cooling fins in order to properly resolve the conjugate heat transfers; while coarse node distributions were used in the flow regions away from the probe NGV walls. Coarse meshes were also applied to the dummy NGVs. More details of the probe NGV mesh and y+ value consideration can be found in Jiang et al.(Reference Jiang, Wu and Zhong Zhang8). The sector mesh with the probe NGV at the second position had 6.55 million cells, where 6.09 million cells were used for the probe NGV.
NGV-2 sector domain and mesh: (a) the whole mesh, (b) the probe NGV mesh and (c) the probe mesh in metal regions.

Among the ten NGVs behind the combustion can, the NGV at the second position (NGV-2) experiences the highest thermal load, and the NGV at the ninth position (NGV-9) has the lowest thermal load (please see Section 4.1). For comparison, the NGV-9 sector mesh was also generated, and the mesh was similar to that shown in Fig. 3 in terms of node arrangement and mesh size.
As observed in Fig. 3, the high-temperature combustion products from the combustor flow through the NGV sector domain; while the cooling air from the annular chamber of the combustor (Fig. 1) enters the probe NGV body through the cooling air inlet of the inner shroud, passes through the internal cooling flow passages, exits at the four rectangular outlets, then merges with the main flow and flows out of the NGV sector. There are a number of cooling fins on either side of the cooling chamber inside the probe NGV to enhance the heat transfer between the cooling air and NGV body, although they are not shown here. By means of impingement and convection, the cooling air absorbs heat from the NGV walls and lowers metal temperature.
3.0 NUMERICAL METHODS
3.1 Numerical approach and physical models
In the first step, the traditional Eulerian-Lagrangian approach was used to solve the two-phase, steady, turbulent, compressible, reacting flows; and for the second step, steady, turbulent, compressible flows were considered(Reference Stiesch11,12) . The Favre-averaged conservation equations for mass, momentum, species and total enthalpy were solved in both cases. For the conjugate or coupled heat transfer between the metal and flow fields, both fluid and solid regions were solved together. In the solid regions, only heat conduction was involved, so the energy transport equation became much simpler than those for fluid regions.
For closure of the flow conservation equations, the turbulence transfer terms, species and energy sources had to be adequately modelled. For the combined combustor-NGVs simulations, the realizable k-ε model was selected for turbulence momentum and scalar transfers, and the eddy dissipation (EDS) combustion model and discrete ordinates radiation model was used to account for species and energy source terms. These physical models have been systematically validated against a comprehensive experimental database obtained from a model combustor(Reference Jiang and Campbell13–Reference Jiang and Konstantin15). The predicted air distribution over the combustion can is closely correlated to the dataset obtained from the improved semi-empirical correlations for passage discharge coefficients(Reference Jiang and Corber10). For the NGV sector simulations, the SST k-ω model (the shear-stress transport-model) was applied. It has illustrated major improvements in the prediction of adverse pressure gradient and separation flows over the standard k-ω and k-ε models(Reference Menter16) and has been successfully applied to the heat transfer calculation of a film cooled linear cascade, showing good agreement with the measured experimental data(Reference Charbonnier, Ott, Jonsson, Th and Cottier17).
3.2 Engine operating and boundary conditions
The engine operating conditions at take-off were considered in the present study(Reference Oechsle, Ross and Mongia18). For the combined combustor-NGVs case, the combustor inlet airflow rate, fuel flowrate, pressure and temperature were used as boundary conditions. An estimated turbulence intensity of 5% and the hydraulic diameter of the inlet annulus were used to estimate the turbulent kinetic energy and dissipation rate at the air inlet. Periodic boundaries were defined at the side surfaces of the 60 sector. For fuel spray, the size and velocity of fuel droplets along the nozzle radial direction were from the experimental data measured at the National Research Council of Canada’s High-Pressure Spray Facility using a phase Doppler particle analyser(Reference Jiang and Corber10). The fuel mass flux distributions along the nozzle radial direction were from Rizk et al.(Reference Rizk, Oechsle, Ross and Mongia19), where a mechanical patternator was used in a high-pressure rig at Purdue University, Indiana. Fourteen spray cones with 1,800 droplets each were specified, giving a total of 25,200 fuel droplets. At the domain exit, a radial equilibrium pressure distribution was ensured to account for the effect of flow tangential velocity on the exit pressure distribution.
For the NGV sector case, the total pressure, total temperature, velocity direction, turbulence kinetic energy and turbulence dissipation rate at the middle cross section between the NGVs and thermocouples from the combined combustor-NGVs simulation were used as the inlet boundary conditions. The specific dissipation rate, ω, required for the SST turbulence model at the inlet was calculated from the following equation:
 \begin{equation} \omega = \varepsilon \, / \left(0.09\,{\rm k}\right)\end{equation}
where k and ε are turbulence kinetic energy and dissipation rate, respectively(Reference Wilcox20). The mass flow rate was maintained by slightly adjusting the domain exit pressure, which was obtained from the combined combustor-NGVs simulation, and the radial equilibrium pressure distribution was also applied at the domain exit. The cooling air flowrate was 2.5% of the total inlet airflow. Periodic boundaries were defined at the side surfaces of the 60° NGV sector. The thermal boundaries on the external surfaces of shrouds were assessed based on the information of the Mach number and flow temperature of the secondary airflow from Snedden et al.(Reference Snedden, Roos and Naidoo21). For a detailed assessment, please refer to Jiang et al.(Reference Jiang, Wu and Zhong Zhang8).
To have an overview of the NGV heat transfer processes, the Biot number of the NGV was calculated by the following expression:
 \begin{equation}Bi = \frac{L_{c}h}{k}\end{equation}
where h is the heat transfer coefficient averaged over the NGV aerofoil external surface, Lc stands for the NGV aerofoil characteristic length, which is defined as the volume divided by the surface area, and k is the thermal conductivity of the aerofoil body. The NGV is made of the X-40 alloy(Reference Brown and Setlak22) with the thermal conductivity of 22.8W/m-K evaluated at 900 K, density of 8,610 kg/m3 and specific heat of 411J/kg-K. The Biot number is 0.03 for the NGV-2 case, much smaller than 0.1, which means that the heat transfer resistance of the conduction within the NGV body is substantially less than that of convection across the NGV/flow interfaces(Reference Incropera and DeWitt23).
3.3 Solution methods
A commercial code, ANSYS CFD Premium (Fluent), was used in the present work(12). A coupled (pressure-based) solver with a second-order accurate scheme was selected to resolve the flow fields. At convergence, the scaled residuals were less than 4×10⁻⁵ for velocity components and scalar items and about 6×10⁻⁴ for turbulent variables. The monitored flow parameters remained unchanged for the first four digits, which ensured that the flow field reached steady condition. One node of a LINUX cluster with 12-cores and 64GB RAM was used to carry out all the simulations.
4.0 RESULTS AND DISCUSSION
4.1 Results of combined combustor-NGVs simulation
A large amount of information has been obtained for the combined combustor-NGVs simulation. The major parameter distributions and complex vortex structures across the dome swirler, primary, second and dilution holes, wiggle strips, baffles and baffle splashing holes, and along the mid-longitudinal plane, are described in Jiang et al.(Reference Jiang and Corber24). To give an overall picture, a few flow parameter contours along the longitudinal plane are presented here. Moreover, as required for the NGV sector simulations, the flow parameter distributions at the middle cross section between NGVs and thermocouples are discussed.
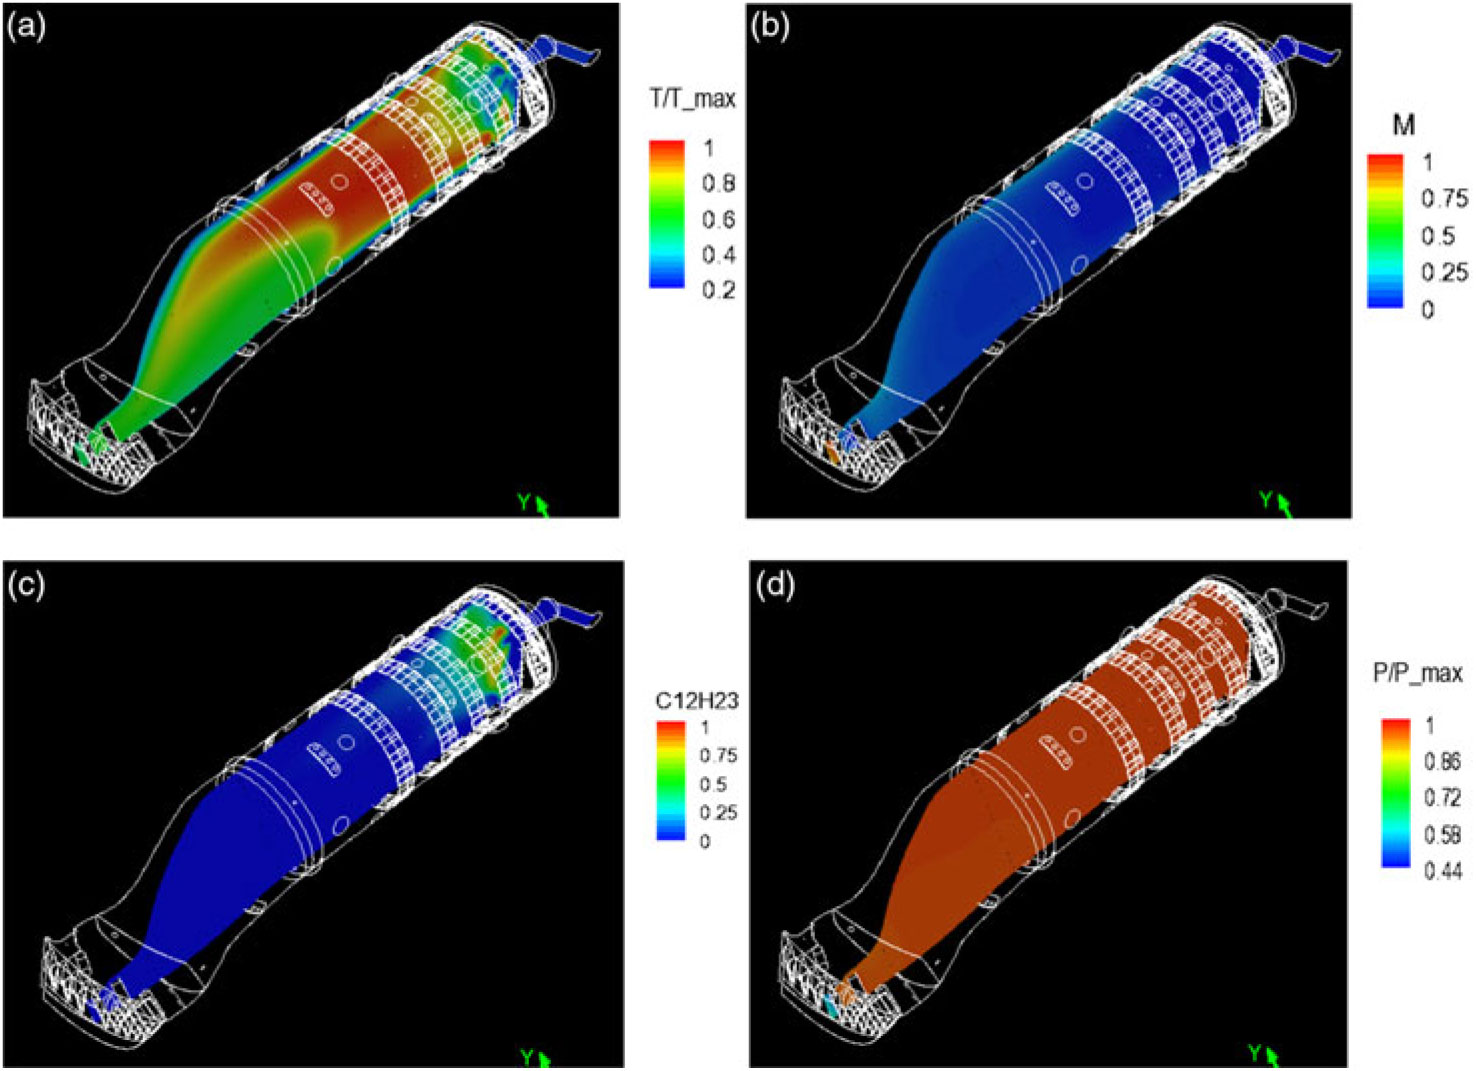
Figure 4 displays the distributions of static temperature, Mach number, fuel mass fraction and static pressure along the mid-longitudinal plane of the combustion can, where the temperature and pressure are normalised by their maxima, respectively. As shown in Fig. 4(a), the temperature is high in the upstream region and relatively low in the downstream region. The Mach number is given in Fig. 4(b). It is low in most of the can region, increases gradually in the contraction section and quickly reaches a maximum value in the NGV section. As displayed in Fig. 4(c), the fuel, C12H23, is mainly located in the one-third upstream region of the combustion can, which means the chemical reaction mainly takes place in this upstream region. Figure 4(d) indicates that the pressure remains nearly constant in most of the can region and decreases rapidly in the NGV section due to flow acceleration.
Flow parameter contours along the mid-longitudinal plane: (a) the normalised static temperature, (b) the Mach number, (c) the C12H23 mass fraction and (d) the normalised static pressure.
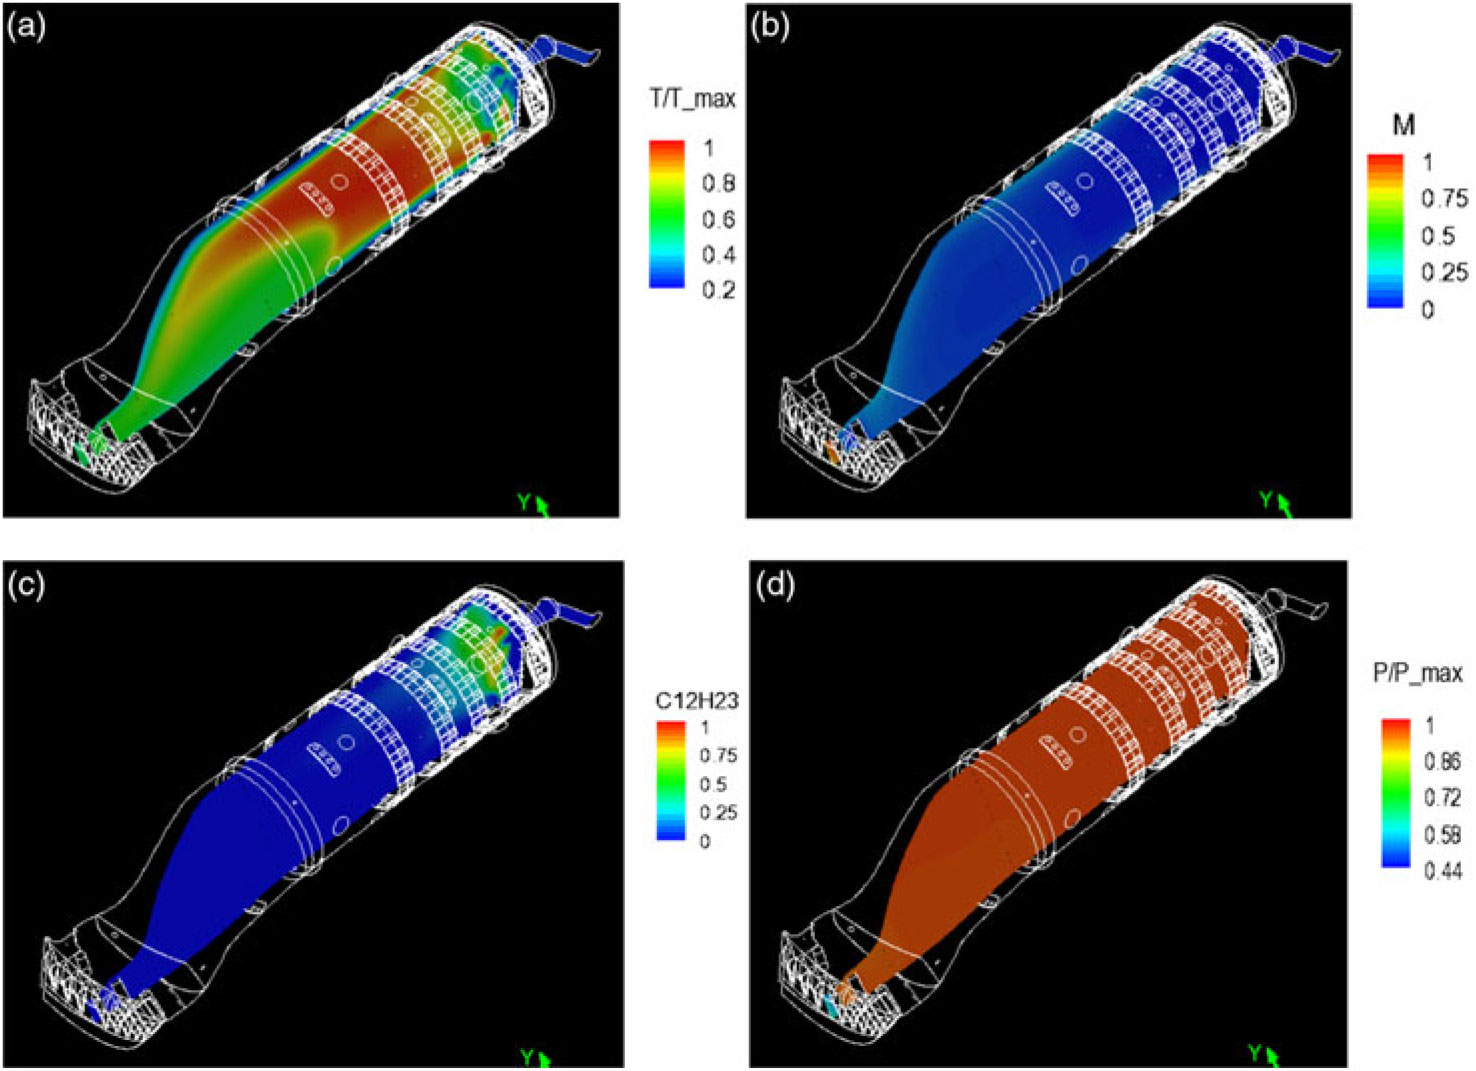
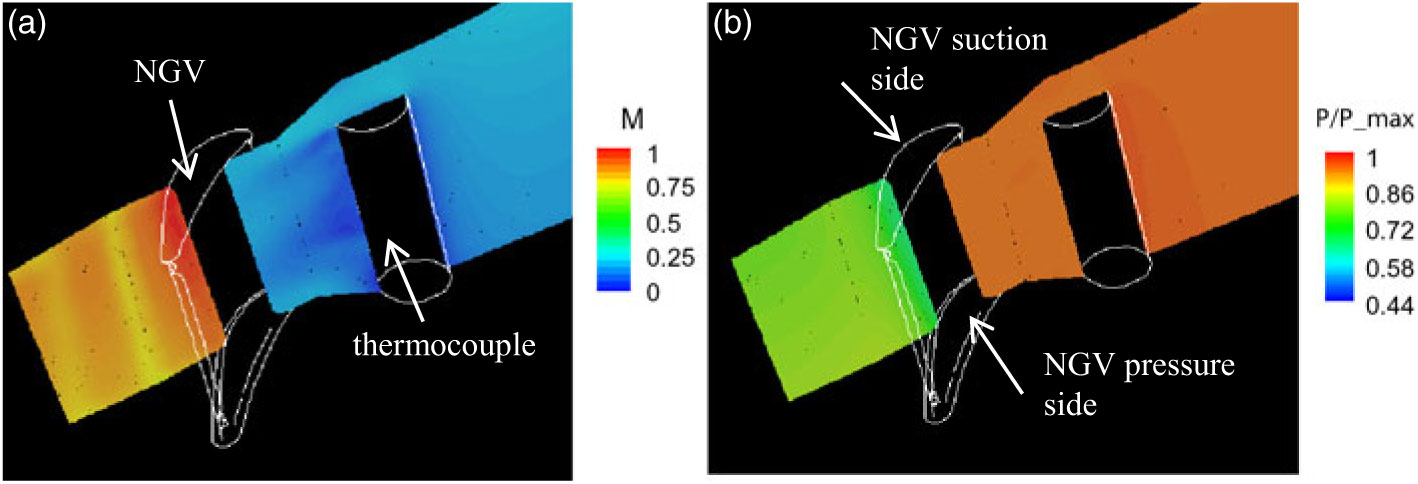
Figure 5(a) and (b) are the zoomed views of Figs 4(b) and 3(d) near the NGV section, and the mid-longitudinal plane cuts through one NGV and one thermocouple. As expected, the Mach number is low near the thermocouple stagnation point and in the wake-flow region behind the thermocouple, and the pressure near the thermocouple stagnation point is somewhat higher than that in the wake-flow region. For the flow near the NGV, the typical NGV flow features are illustrated: the Mach number is low on the pressure side and high on the suction side; while the pressure is high on the pressure side and low on the suction side due to flow acceleration.

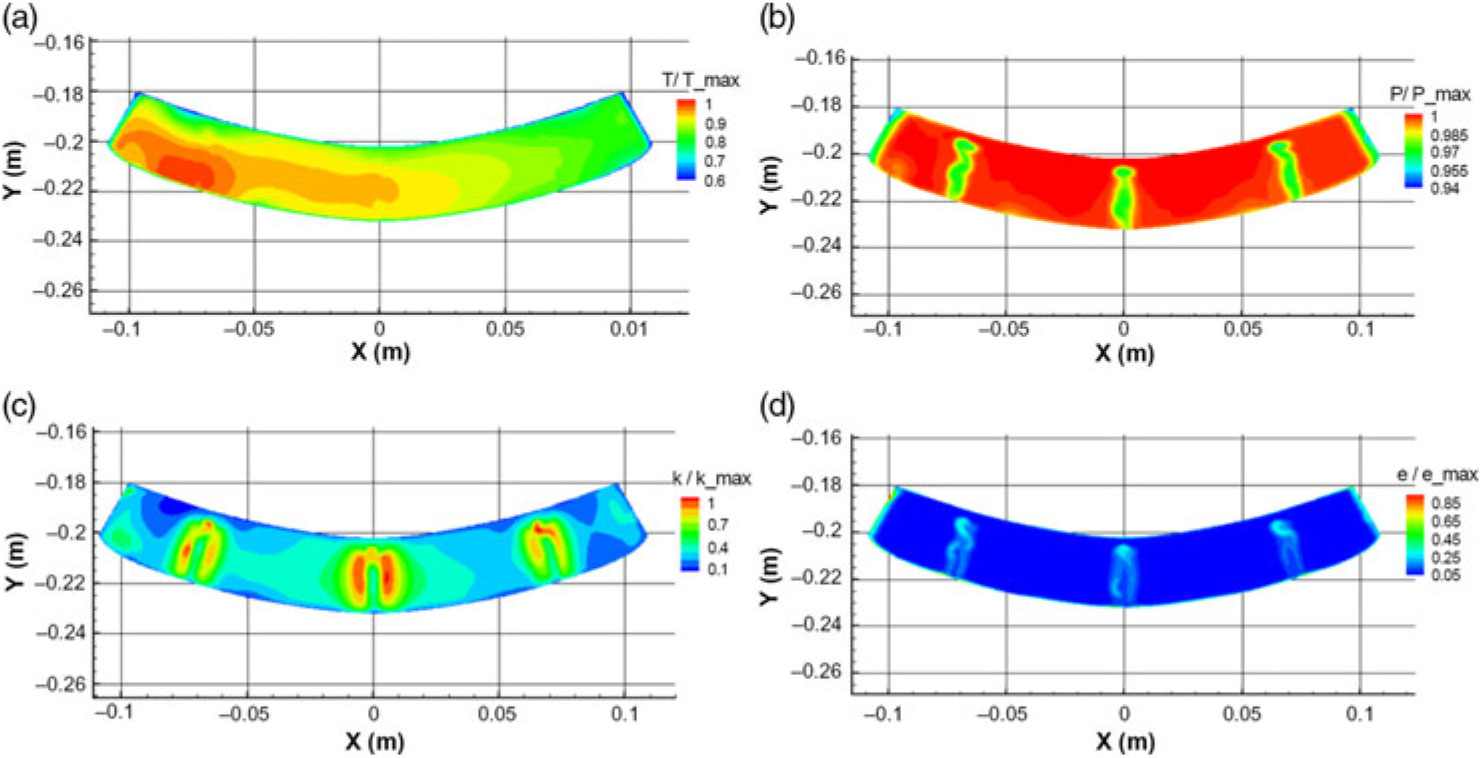
Figure 6 presents the distributions of total temperature, total pressure, turbulence kinetic energy and turbulence dissipation rate at the middle cross section between the NGVs and thermocouples, where the flow parameters are normalised by their section maxima, respectively. The hot streaks, or temperature distortions, are clearly observed in Fig. 6(a), and the normalised temperature varies from 0.61 to 1.0 with an average value of 0.888. These values are in excellent agreement with the experimental data at the take-off condition, T_average = 0.886 and T_max = 1.0025(Reference Rizk, Oechsle, Ross and Mongia19). The differences in the mean and maximum temperature are less than 0.5%. This provides a solid basis for the hot-streak effect investigation.
Normalised flow parameter distributions at the cross section between the NGVs and thermocouples: (a) the total temperature, (b) the total pressure, (c) the turbulence kinetic energy and (d) the turbulence dissipation rate.

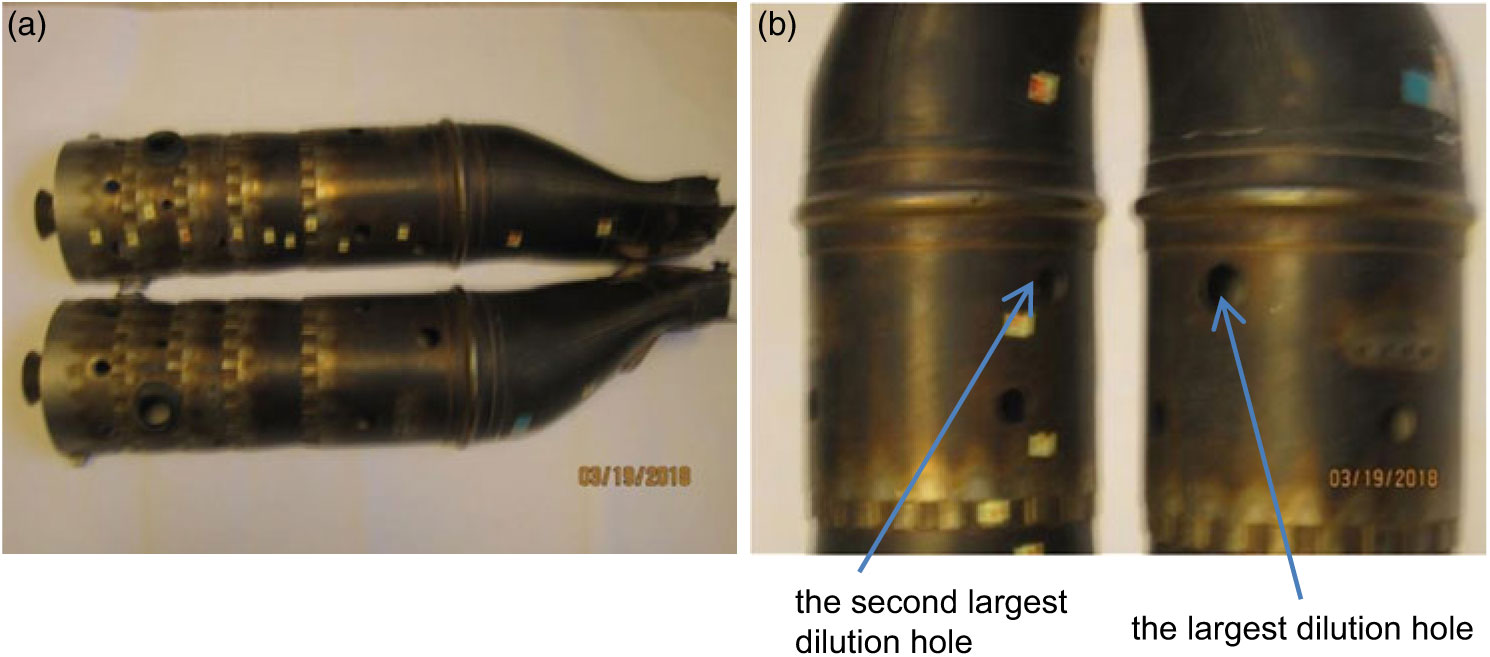
The observed hot streaks at the combustion can exit can be readily explained by its geometry, as displayed in Fig. 7. The largest and second largest dilution holes just before the contraction section are highly non-symmetric with respect to the can mid-longitudinal plane, which is the main cause of the temperature distortion at the combustion can exit.
Combustion can: (a) two halves and (b) the two dilution holes before the contraction section.

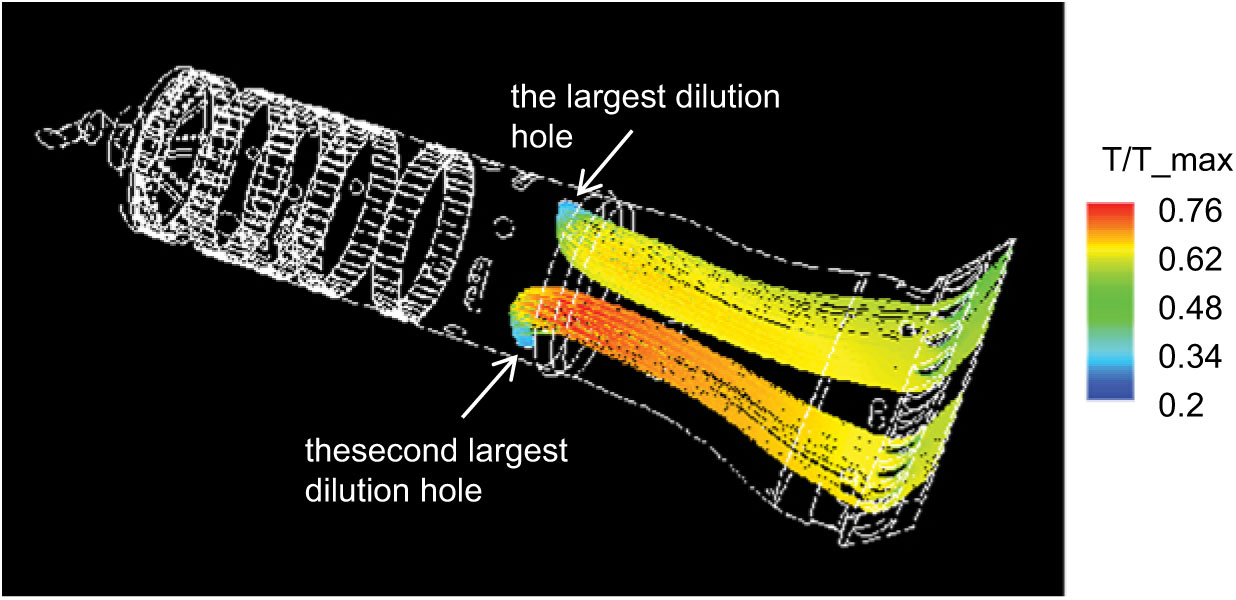
The flow path lines from the largest and second largest dilution holes are illustrated in Fig. 8, where the path lines are coloured by temperature. As displayed in the figure, the temperature of the path lines from the largest dilution hole is lower than that from the second largest dilution hole. Moreover, the air mass flowrate through the largest hole is 1.67 times higher than that through the second largest hole. As a result, the temperature at the combustion can exit is high on the left-hand side and low on the right-hand side, looking upstream.
Flow path lines from the largest and second largest dilution holes before the contraction section.

As displayed in Fig. 6(b), there are three narrow relatively low total pressure regions at the cross section. This reveals the effect of the wake flows downstream of the three thermocouples. Moreover, the total pressure near the two side boundaries is also low. This is mainly due to the flow passage increase in the circumferential direction in order to accommodate the two side NGVs. Figure 6(c) and (d) indicate that the turbulence kinetic energy and dissipation rate are high in the wake-flow regions downstream of the thermocouples. It is interesting to see the rotating vortices in these local regions, starting a short distance away from the can internal wall to the can external wall. The gaps between the thermocouples and the can internal wall (please see Fig. 1(b) or Fig. 5) play a major rule in this phenomenon. As expected, the turbulence dissipation rate is very high near the surrounding walls.
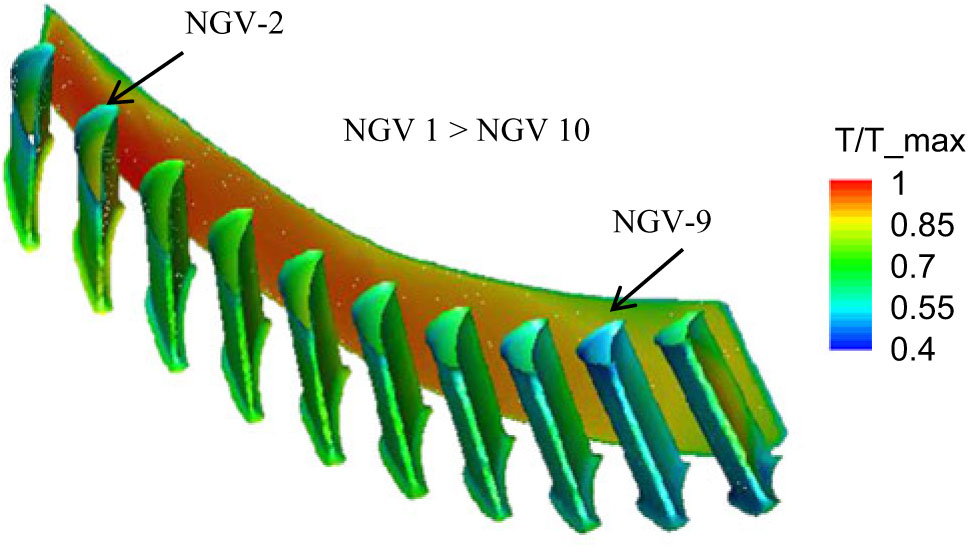
The temperature contours at the external surfaces of the simplified ten NGVs and at the middle cross section between the NGVs and thermocouples are displayed in Fig. 9. By comparing the temperature variation and mean temperature of these NGVs, it is found that NGV-2 has the highest surface maximum and mean temperature among the ten NGVs, and NGV-9 has the lowest maximum and mean temperature. This reveals that NGV-2 is most vulnerable under the flight condition, which is consistent with the field-observed NGV damage pattern.(Reference Robertson, Seo, Lupandina and Carregie25)
Normalised static temperature contours at the external surfaces of the simplified NGVs and at the middle cross section between the NGVs and thermocouples.

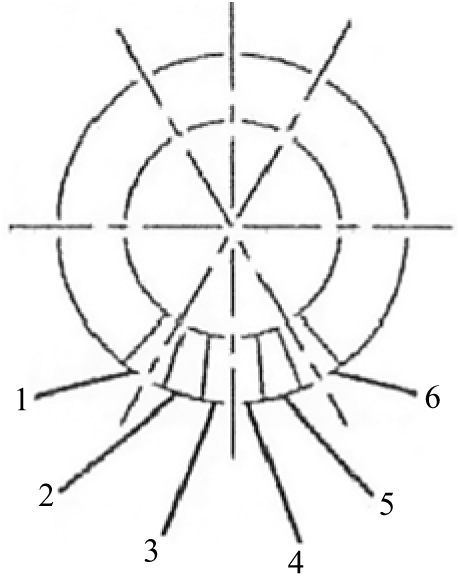
Figure 10 describes the locations of six NGV units relative to the combustion can exit. Two dashed lines form a 60° sector, and the area overlapped with the annulus is where the combustion can exit is located. Each NGV unit has two NGVs, where the leading NGV and trailing NGV are defined counter clockwise, looking upstream. Note that the trailing NGV of Unit 1 and the leading NGV of Unit 6 are within the can exit domain. That is, all together there are ten NGVs behind each combustion can. Most of the failures are Unit-2, while few are Unit-1 or Unit-6, the neighbour of Unit-2.
The locations of six NGV units relative to the combustion can exit, looking upstream.

4.2 Results of NGV sector simulations
The features of the complicated flow field, impingement and convection heat transfer, NGV and cooling fin surface temperature and heat flux inside and outside of the NGV/shrouds are thoroughly described in Jiang et al.(Reference Jiang, Wu and Zhong Zhang8). In this paper, only some of the results for the probe NGV at the second position (NGV-2), NGV-2 with the mean inlet boundary conditions and the ninth position (NGV-9) are presented. For the mean inlet boundary conditions, the flow parameters shown in Fig. 6 were averaged over the cross section, and the normalised values are listed in Table 1.
The mean inlet boundary conditions

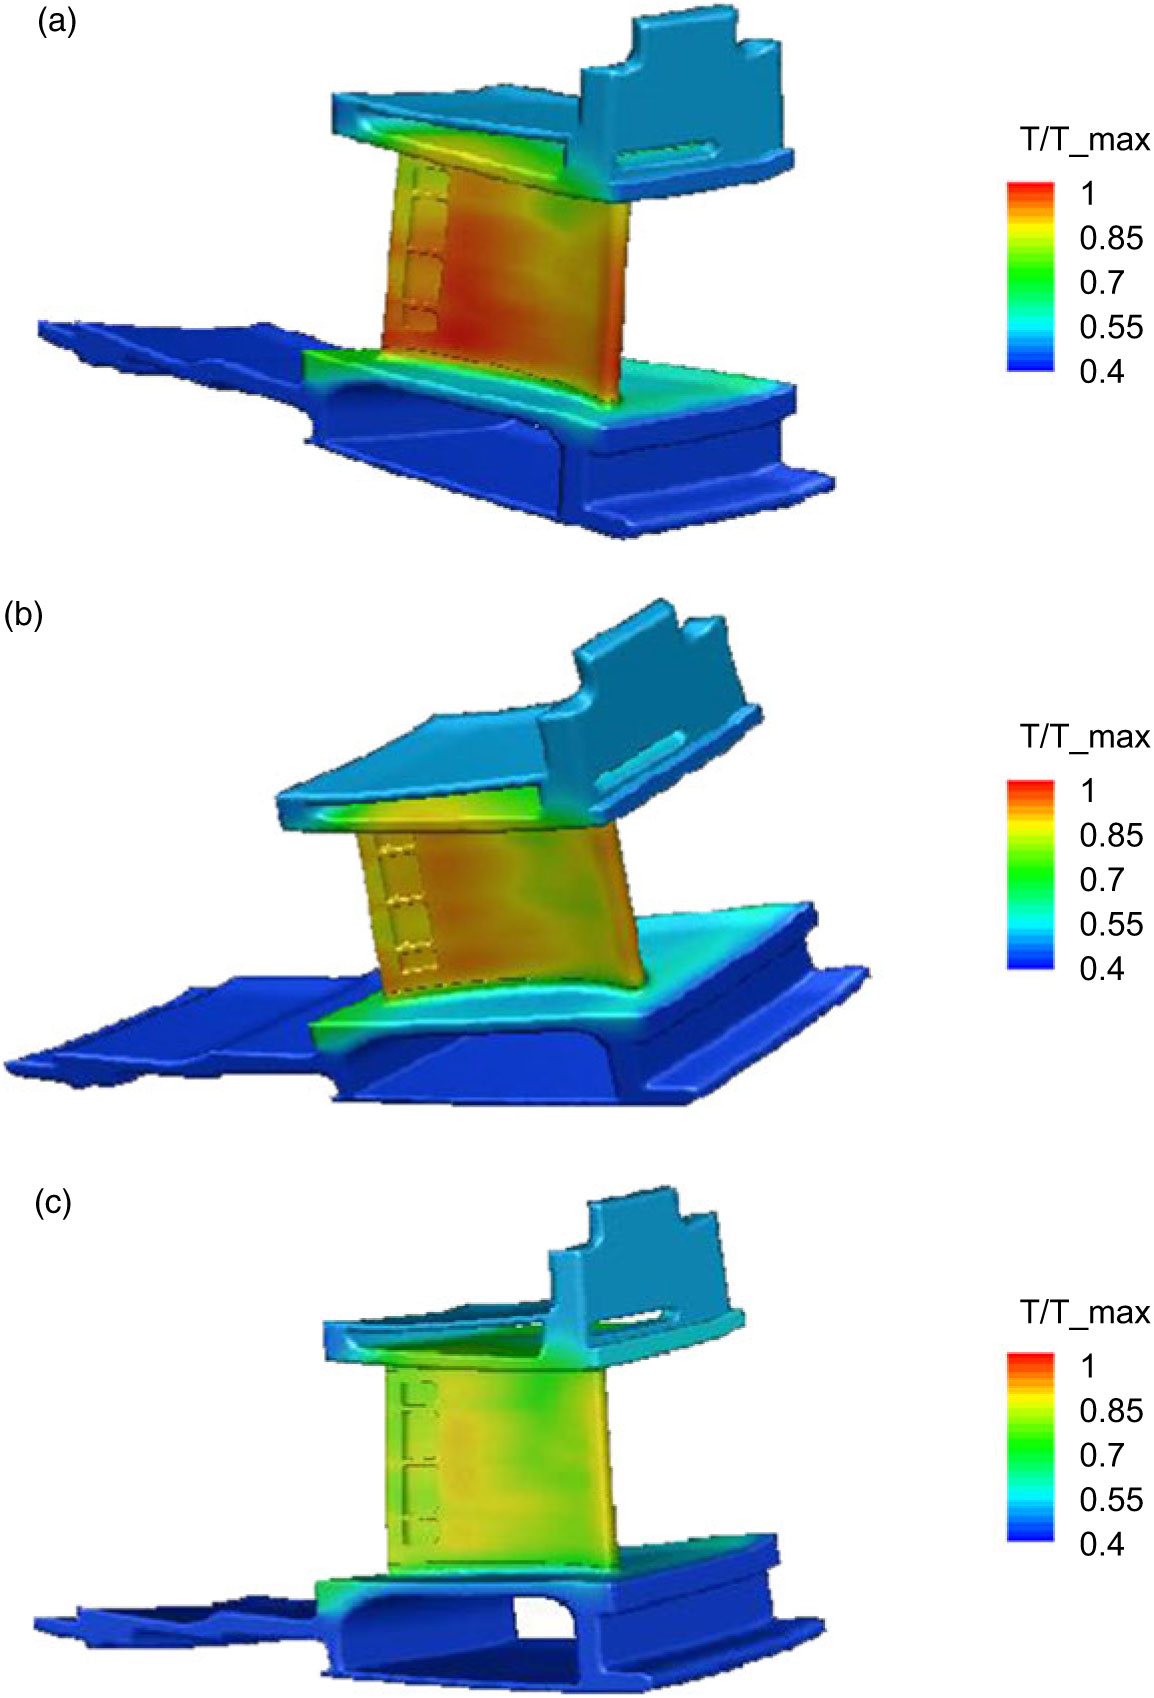
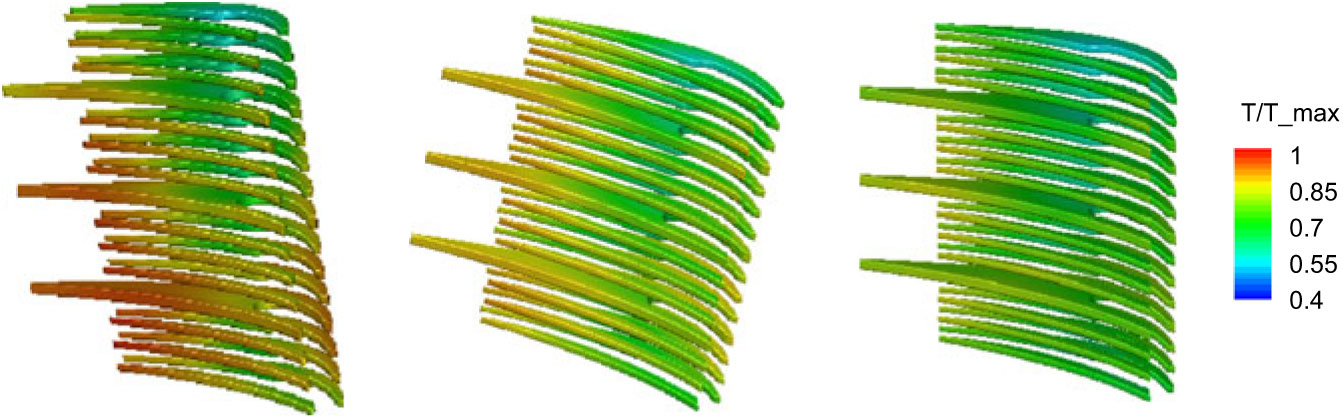
Figures 11 and 12 display the external surface static temperatures of the NGV/shrouds and cooling fins for the three cases, where the temperatures are normalised by the maximum surface temperature of NGV-2. For the sake of comparison, the same temperature scale, 0.4–1.0, is used in these plots. In the first case, the maximum temperature reaches 1.0 at the NGV external surface and 0.982 at the cooling fin surface. In the second case, the maximum surface temperature is 0.916 for the NGV surface and 0.901 for the cooling fins. In the third case, the maximum surface temperature is 0.859 for the NGV and 0.847 for the cooling fins. In short, NGV-2 has the highest thermal load. Its maximum temperature is 8.4% higher than NGV-2, but with the mean inlet boundary conditions, and 14.1% higher than NGV-9.
In order to extend the service life of these vulnerable NGVs, some protection methods should be considered such as applying thermal barrier coatings (TBC) to NGV-2 and improving internal cooling arrangement. Consequently, the service time of these NGVs would be more or less the same as the other NGVs.
Normalised static temperature contours at the NGV/shrouds external surfaces for (a) NGV-2, (b) NGV-2 but with the mean inlet parameters and (c) NGV-9.

Normalised static temperature contours at the cooling fins external surfaces for NGV-2, NGV-2 but with the mean inlet parameters, and NGV-9.

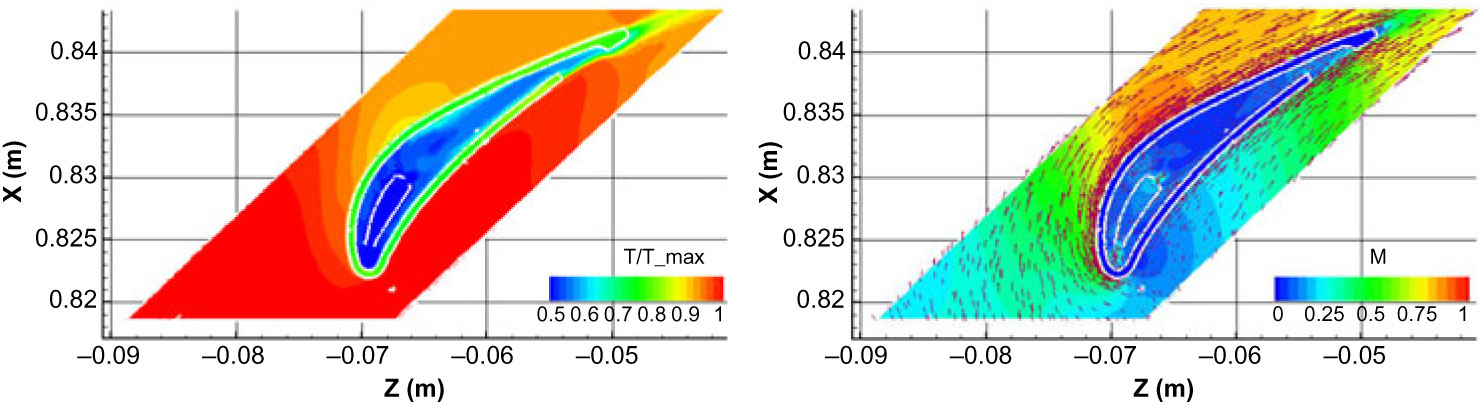
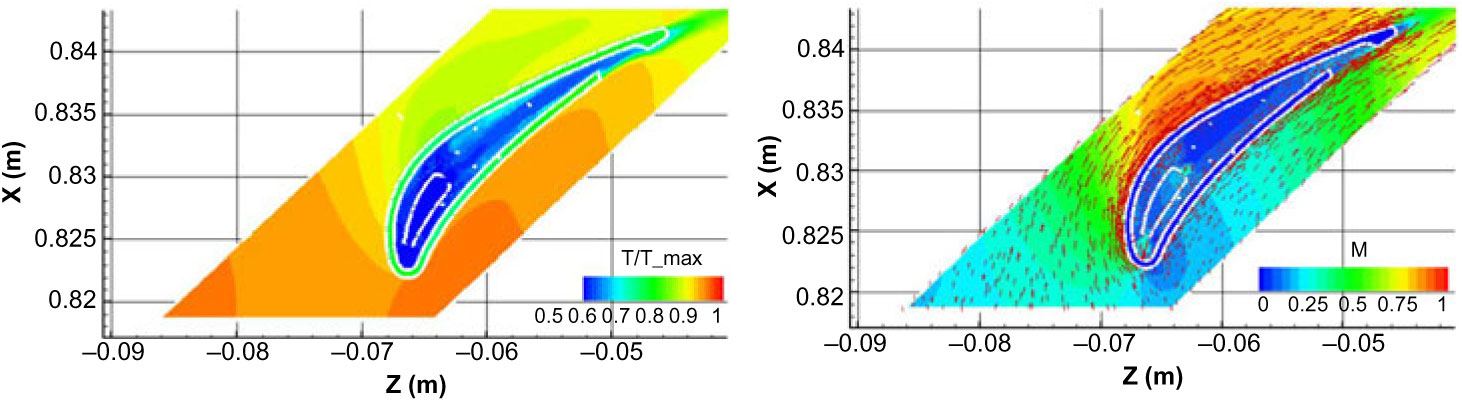
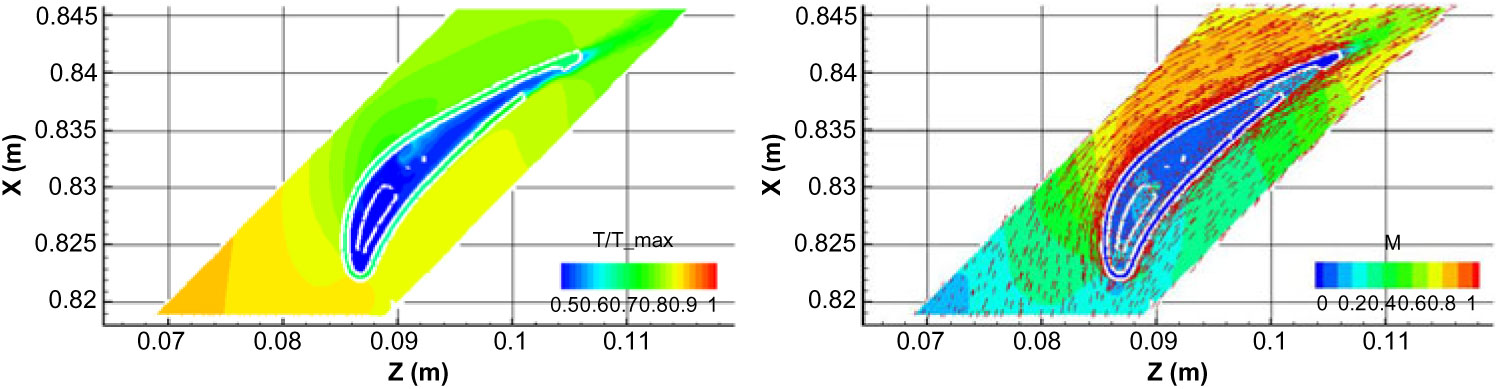
Figures 13 to 15 present the distributions of static temperature, Mach number and velocity vectors at the section across the trailing-edge cooling hole and one leading-edge cooling hole for the three cases, respectively, where the temperatures are normalised by the maximum value in Fig. 13. The maximum incoming temperature is 1.0 for the first case, 0.92 for the second case and 0.89 for the third case. These figures show the typical NGV flow features. The temperature is high on the NGV pressure side and gradually decreases along the suction side; the Mach number is low around the leading edge, gradually increases along the pressure side, and increases and then decreases along the suction side. The impingement cooling is clearly illustrated by the velocity vectors from the leading-edge cooling hole, and the convection cooling is indicated by the velocity vectors along the NGV internal and external surfaces.
Normalised temperature and Mach number contours, and velocity vectors at the section across the trailing-edge cooling hole and one leading-edge cooling hole for NGV-2.

Normalised temperature and Mach number contours and velocity vectors at the section across the trailing-edge cooling hole and one leading-edge cooling hole for NGV-2 but with the mean inlet boundary conditions.

Normalised temperature and Mach number contours and velocity vectors at the section across the trailing-edge cooling hole and one leading-edge cooling hole for NGV-9.

5.0 CONCLUSION
The two-phase, turbulent, compressible, reacting flow field of the 60° combustor sector with the simplified ten NGVs and three thermocouples has been successfully solved with the systematically validated physical models from a model combustor. The predicted mean and maximum temperature at the combustion can exit are in excellent agreement with the experimental data, and the deviations are less than 0.5%. These provide a solid basis for studying the hot-streak effect on the flow field and thermal load of NGVs.
With the boundary conditions from the combined combustor-NGVs simulation and the popular turbulence model for turbomachinery, the turbulent, compressible flow fields of the NGV sectors of internally air-cooled NGVs and shrouds have been successfully carried out. The probe/dummy NGV approach has been proved as an effective method to study the hot-streak effect.
The results indicate that the second NGV, looking upstream from the left, has the highest thermal load. Its maximum surface temperature is 8.4% higher than that for the same NGV, but with the mean inlet boundary conditions, and 14.1% higher than the ninth NGV, based on the maximum surface temperature of the second NGV. Most importantly, this finding is consistent with the field-observed NGV damage pattern.
In order to extend the service life of these vulnerable NGVs, some protection methods should be considered such as application of thermal barrier coatings (TBC) and improvement of internal cooling arrangement. As a result, the service life of these NGVs would be more or less the same as the other NGVs and then the maintenance cost can be greatly reduced.
ACKNOWLEDGEMENTS
The authors are grateful to the Department of National Defence of Canada, the Air Defence System Program and Gas Turbine Laboratory, Aerospace Research Centre, the National Research Council of Canada for funding and supporting this research project. Also, many thanks go to Dr Francois Fortin and the editorial board of The Aeronautical Journal for the valuable comments and suggestions in the preparation of the manuscript.