





Introduction
Dissolved organic matter (DOM) is a ubiquitous component of the Earth’s biosphere, atmosphere, hydrosphere, lithosphere and cryosphere, constituting approximately 63% of the total organic carbon pool in global river systems (Liu and others, Reference Liu2024). However, its proportion can exceed 95% in certain tropical rivers and boreal lakes (Drake and others, Reference Drake2023; Zhou and others, Reference Zhou2023b). Owing to its chemically reactive nature, DOM plays a vital role in the material and energy exchange across these environments. The storage and cycling of DOM within the cryosphere are regulated by unique cold-region conditions (Schmidt and others, Reference Schmidt2011). Glaciers and ice sheets are now recognized as dynamic ecosystems that harbor diverse habitats (Anesio and Laybourn-parry, Reference Anesio and Laybourn-parry2011), which significantly influence the composition and abundance of DOM in meltwaters (Musilova and others, Reference Musilova, Tranter, Wadham, Telling, Tedstone and Anesio2017). The recent climate warming has accelerated cryospheric dynamics, particularly in mountain glacier-fed stream systems, consequently altering their microbial communities and associated biogeochemical processes. For example, since the 1950s, the Qinghai-Tibet Plateau (QTP) has experienced significant warming, with mean annual air temperature increasing at a rate of 0.36°C per decade—approximately three times the global average (Zhou and others, Reference Zhou, Yao, Fan, Yin, Meng and Lin2022). The storage and annual release of dissolved organic carbon (DOC) from Asian mountain glaciers have been estimated at 8.8–13.8 Tg C and 0.19 Tg C yr−1, respectively (Li and others, Reference Li, Yongjian, Jianzhong, Xiaobo and Tianding2018b). Accordingly, the current release of DOC from these glaciers is far more substantial than previously recognized, leading to significant alterations of biogeochemical processes in snow, ice and glacier systems, ultimately reshaping regional and global biogeochemical cycles. Therefore, DOC release must be incorporated into future evaluations of the global carbon cycle.
Glacial DOM originates from multiple sources, including biological production, terrestrial inputs, atmospheric deposition and in situ chemical formation (McNeill and others, Reference McNeill2012). Rich in carbon, nitrogen and phosphorus, DOM is a key component in the biogeochemical cycling within glacial ecosystems, thereby playing a fundamental role in the material and energy fluxes of surface glacier environments (Singer and others, Reference Singer2012). Studies have shown that DOM in surface snow and ice is predominantly composed of aliphatic and protein-like compounds (Antony and others, Reference Antony, Grannas, Willoughby, Sleighter, Thamban and Hatcher2014; Feng and others, Reference Feng, An, Xu and Kang2018; Feng and others, Reference Feng, An, Xu, Li, Jiang and Liao2020), although snow metamorphism can alter or deplete these DOM pools (Feng and others, Reference Feng, An, Xu, Li, Jiang and Liao2020). Variations in glacial DOM composition are further influenced by microbial communities and anthropogenic inputs (Guo and others, Reference Guo2022). On the QTP, in situ microbial activity dominates DOM dynamics, as evidenced by Cyanobacteria driving transformation in snow and heterotrophic taxa playing key roles in ice (Guo and others, Reference Guo2025). From July–September, ice-derived DOM accounts for 50–65% of glacier runoff, exceeding the contribution from snow-derived DOM during the same period (Guo and others, Reference Guo2025). However, DOM sources and transformation processes are complex. They are shaped by heterogeneous glacier surfaces, microbial activity (Liu and others, Reference Liu2009; Guo and others, Reference Guo2022) and terrigenous inputs, and are also modulated by hydrological regimes, sediment transport and biogeochemical changes associated with glacial shrinkage (Milner and others, Reference Milner2017).
Beyond glacier-fed streams, proglacial lakes serve as critical transition zones between glaciers and downstream ecosystems (Zhang and others, Reference Zhang2025). In alpine catchments, these lakes can significantly modulate both hydrological flow and DOM fluxes (Slemmons and others, Reference Slemmons, Saros and Simon2013). Key processes, such as water residence time and thermal stratification, influence the photochemical and microbial reworking of DOM. Such transformations alter DOM’s chemical composition and bioavailability, ultimately affecting the nutrient cycling and integrity of aquatic ecosystems (Slemmons and others, Reference Slemmons, Saros and Simon2013). Consequently, proglacial lakes play a pivotal role in shaping the biogeochemical characteristics of downstream waters, making them ideal systems for studying DOM dynamics along glacier–lake–stream continuums (Holt and others, Reference Holt2021; Zhou and others, Reference Zhou2023a). Both photochemical processes and microbial activities are recognized as playing critical and complementary roles in the molecular transformation of DOM along the glacial continuum. Under ultraviolet (UV) light exposure, photolabile species—including lignin, polyphenolic and polycyclic aromatic compounds—are photodegraded into smaller, more bio-labile molecules, such as aliphatics (Holt and others, Reference Holt2021). Concurrently, extended UV exposure on glacier surfaces accelerates the photodegradation of DOM, causing a significant decrease in the relative abundance of photo-sensitive aromatic compounds (Stubbins and others, Reference Stubbins2010). When microbial activity is involved, this transformation process is markedly enhanced. Surface ice and glacier-fed streams harbor a diverse array of microorganisms. Particularly in surface ice and cryoconite systems, spatial constraints and elevated organic carbon concentrations create microenvironments highly favorable for microbial colonization (Liu and others, Reference Liu2017; Xing and others, Reference Xing, Liu, Ji, Chen and Liu2024). In these nutrient-rich settings, sufficient light penetration facilitates bursts of photoautotrophic activity by algae and cyanobacteria, which exhibit notably high metabolic rates (Liu and others, Reference Liu2009, Reference Liu2017). Their presence and metabolic reworking significantly reorganize both the concentration and composition of DOM by actively releasing biolabile aliphatic and peptide-like compounds associated with amino acids (Antony and others, Reference Antony2017; Zhou and others, Reference Zhou2019). Despite these insights, the sources and transformation of DOM along glacier–lake–stream continuums, particularly in alpine regions, remain understudied due to the remoteness and heterogeneity of these extreme environments.
QTP is a focal region for research on DOM dynamics in glacial environments, as it harbors the largest expanse of glaciers outside the polar regions (Yao and others, Reference Yao2022). The glaciers here constitute critical water sources for major rivers and lakes across South and East Asia, profoundly influencing regional hydrology and ecology (Yao and others, Reference Yao2012, Reference Yao2022). In recent decades, warming-induced glacial retreat has significantly altered local and regional biogeochemical cycles (Chen and others, Reference Chen2013). The southeastern QTP, a hotspot for temperate glaciers (Zekollari and others, Reference Zekollari2025), is characterized by rapid retreat rates, high precipitation, intense melt rates, low equilibrium-line altitudes and abundant proglacial lakes (Li and others, Reference Li, Chen, Kang, Li, Li and Wen2018a). However, research on DOM dynamics in the temperate glaciers of the southeastern QTP remains limited, particularly regarding the evolution of DOM along glacier–lake–stream continuums. This knowledge gap hinders a comprehensive understanding of the role of glacial DOM and its subsequent biogeochemical impacts on downstream ecosystems. Recent studies have begun to address this gap, with Guo and others (Reference Guo2025) showing that Tibetan glaciers transform DOM into refractory molecules for downstream export, and Mu and others (Reference Mu2025) finding that in proglacial lakes, microbial composition interacts strongly with DOM, where carbohydrate metabolism fosters microbial growth. Building on these findings, we investigated the optical, chemical and molecular composition of DOM along the glacier–lake–stream continuum of the Dagu Glacier on the southeastern QTP. The glacier–lake–stream continuum refers to a hydrologically and biogeochemically coupled system in which meltwater from glacial ice flows sequentially into a downstream lake and then into a stream network. In this study, the continuum is treated not as a mere descriptive sequence of landscape elements, but as an integrated functional unit for tracking transformations in DOM derived from glacial sources. By employing advanced analytical techniques, we assessed DOM dynamics during both the peak (July) and late (October) melt seasons of 2021 along the glacier–lake–stream continuum. Additionally, we conducted in situ bio-incubation experiments to evaluate the microbial and photochemical processing of DOM within snow and ice meltwater. We aimed to characterize organic carbon concentrations and DOM chemical composition across the glacier terminus, the proglacial lake and the downstream stream, and to elucidate the chemical, physical and biological changes in DOM during its transport through the continuum, while identifying the potential mechanisms underlying these. Given the highly biolabile nature of aliphatic and peptide-like compounds, we hypothesize that microbial degradation drives a progressive downstream decrease in their relative abundance along the continuum.
Materials and methods
Study site, sampling and in situ incubation
The Dagu Glacier (32.21° N, 102.76° E), a representative temperate glacier, is situated on the eastern margin of the QTP within the transitional zone of the Hengduan Mountains between the QTP and the Sichuan Basin. The regional climate is classified as a northern subtropical mountain climate, with a mean annual precipitation of 699.5 mm (Zhao and others, Reference Zhao, Li, Li, Zhang and Liu2018), including approximately 38 annual snow days at elevations above 5000 m a.s.l. Since 2001, the glaciers in this region covered an area of ∼4.56 km2 (Zhang and others, Reference Zhang, Li, Wu and Yang2002). The undulating topography promotes the formation of proglacial lakes, and ∼100 lakes are distributed across the glacial foreland and depressions (Zhao and others, Reference Zhao, Li, Li, Zhang and Liu2018). Moreover, according to observational data from the Dagu Glacier Administration, the regional tree line extends to an elevation of 4200 m, with forests covering ∼48% of the landscape.
During the peak (July) and late (October) melt seasons of 2021, we collected triplicate samples of fresh snow, surface ice, proglacial lake (from both inlet and outlet) and water from a downstream-linked stream (total n = 30). Sampling and in situ incubation sites for fresh snow and surface ice were established at an elevation of 4860 m on the Dagu Glacier. The proglacial lake sampling site (4797 m elevation) was positioned ∼500 m downstream of the glacier terminus, while stream sampling was undertaken further downstream at an elevation of 3610 m (Fig. 1). Snow and ice samples were collected using stainless steel scoops sterilized by combustion (500°C for 6 h). Lake water samples were collected from both inlet and outlet locations with comparable replication. Prior to collection, all sample bottles were rinsed three times with site-specific water. The samples were immediately transferred to pre-cleaned glass bottles (acid-washed with 10% HCl for 24 h, followed by rinsing with deionized water and drying), stored on ice during transport, and maintained at −20°C in laboratory freezers at Aba Teachers University until analysis.
Map of the study area showing sampling locations. The red star in the left panel indicates the location of the Dagu Glacier on the eastern Tibetan Plateau. The right panel shows a detailed map of the sampling sites where red points denote supraglacial snow and ice sampling sites, orange points denote proglacial lake sampling sites (inlet and outlet) and yellow points denote stream water sampling sites. The red triangle marks the in situ bio-incubation experiment site.

Figure 1 Long description
A) The left map shows the location of the Dagu Glacier on the eastern Tibetan Plateau, marked by a red star. B) The right map details sampling sites with symbols: red points for snow/ice samples, orange points for proglacial lake samples, yellow points for stream samples and a red triangle for the bio-incubation site. The glacier is outlined with blue hatching. The map includes coordinates 102 degrees 45′E to 102 degrees 47′E and 32 degrees 36′N to 32 degrees 37′N. A scale bar indicates distances up to 3 km. The spatial distribution shows snow/ice samples clustered near the glacier, lake samples near the proglacial lake and stream samples further downstream.
Incubation experiment design and constraints
Three incubation treatments were conducted at the glacier terminus (4860 m a.s.l.) to evaluate the relative roles of photochemical and microbial processing of DOM in snow and ice meltwater. All water samples were collected from surface snow and ice meltwater in the ablation zone, thoroughly mixed, and dispensed into 250 mL quartz Erlenmeyer flasks (pre-cleaned as described above), with 200–250 mL per flask. Each treatment comprised six parallel samples, incubated for 10, 20 and 30 days (two parallels per time point). The flasks were placed on the glacier surface and exposed to natural light and ambient temperature throughout. A weather station at the site recorded a temperature range of −3.9 °C to 6 °C (mean = 1.0 °C ± 2.6 °C) during the 30 day experiment. We did not actively control temperature, as the goal was to simulate realistic, fluctuating field conditions rather than isolate temperature as a variable. Consequently, microbial metabolic rates under these cold, variable conditions likely represent lower-bound estimates of transformation potential compared to laboratory optima.
The specific treatments were as follows: (1) Light-dominated (microbe-reduced) treatment: water samples were filtered through a 0.2 μm filter membrane (Thermo Scientific™ Nalgene Rapid-FlowTM 75 mm Filter Unit) to reduce microbial abundance. We emphasize that this filtration does not achieve sterility, especially in cold glacial environments where ultra-small bacteria (<0.2 μm), starved cells, or particle-attached cells may pass through. This treatment is therefore best described as microbe-reduced rather than microbe-free. The flasks were sealed with a culture sealing film. This treatment allows assessment of photochemical transformation under substantially reduced microbial interference; results must be interpreted conservatively. (2) Ambient (light + microbe) treatment: Unfiltered water was dispensed directly into flasks and sealed. This treatment retained the native microbial community and was exposed to natural light, simulating co-transformation by photochemistry and microorganisms under real surface conditions. (3) Dark-microbial treatment: Unfiltered water was dispensed into flasks, sealed and immediately wrapped in aluminum foil to exclude light. This treatment retained the native microbial community but excluded photochemical effects, allowing assessment of microbial transformation alone.
Sample handling and analytical filtration
All samples collected from glacial environments (and all incubated samples after retrieval) were thawed at 4 °C. For analyses of DOC concentration, ultraviolet-visible (UV-Vis) absorbance and EEM fluorescence, all samples were filtered through 0.45 μm capsule filters (Pall AquaPrep 600) to remove particles that could interfere with optical measurements. This post-incubation filtration was applied equally to all three treatment groups after the incubation period had ended. Because microbial degradation of DOM had already occurred during incubation, this filtration step does not alter the DOM that records microbial activity, nor does it bias cross-treatment comparisons of DOM composition. However, we acknowledge that the combined use of pre-incubation 0.2 μm filtration (only for the light-dominated treatment) and post-incubation 0.45 μm filtration (for all groups) adds complexity; the primary remaining limitation is the incomplete removal of microbes in the light-dominated treatment. These constraints are explicitly considered when interpreting the results.
Measurements of DOC concentration and DOM absorption
A 30 mL aliquot of the filtrate was collected for DOC concentration analysis. DOC concentrations were determined for all snow, ice, and water samples using a total organic carbon analyzer (Elementar, Hanau, Germany), following a previously established method (Xu and others, Reference Xu, Zhang, Wang, Yu, Ge and Qin2015). Detailed experimental procedures are provided in the Supplementary Material. To quantify the net loss of DOC from the glacial source areas to the downstream proglacial lake, we calculated the DOC removal efficiency. This metric represents the percentage decrease in DOC concentration from the glacial sources (i.e. the average of fresh snow and surface ice concentrations) to the proglacial lake inlet. The removal efficiency was calculated using the following equation:  $\frac{{\mathrm{DOC}_{\mathrm{Source}}}-{\mathrm{DOC}_{\mathrm{inlet}}}}{{\mathrm{DOC}_{\mathrm{Source}}}}\times 100\%$, which assumes that dilution effects are minimal or that the decrease is primarily driven by biogeochemical processing and sedimentation.
UV-Vis absorbance spectra for all samples and the daily Milli-Q water blank were obtained for all samples using a UV-2700 spectrophotometer (Shimadzu, Kyoto, Japan). The wavelength scan range was set from 200–800 nm with a 1 nm interval. Following measurements, the baseline was corrected by subtracting the absorbance value at 700 nm from the entire spectrum. The absorption coefficient (a λ) of DOM was calculated by multiplying the absorbance by 2.303/r, where r is the cuvette path length in meters. The specific UV absorbance at 254 nm (SUVA254, in L · mg · C−1 · m−1), calculated as the UV absorbance at 254 nm divided by the DOC concentration, is an indicator of DOM aromaticity, with higher values denoting greater aromaticity (Weishaar and others, Reference Weishaar, Aiken, Bergamaschi, Fram, Fujii and Mopper2003). The spectral slope (S 275–295), derived from nonlinear fitting of the absorbance spectrum over the 275–295 nm range, exhibits an inverse relationship with molecular weight and terrestrial DOM contribution, and lower values therefore indicate higher terrestrial input (Fichot and Benner, Reference Fichot and Benner2012).
Fluorescence measurement and parallel factor analysis
The EEMs of all snow, ice and water samples, as well as the daily Milli-Q water blank, were measured using a Hitachi F-7000 fluorescence spectrophotometer (Hitachi High-Tech Technologies, Tokyo, Japan) equipped with a 700-V xenon lamp, following the methodology described in a previous study (Zhang and others, Reference Zhang2010). Detailed experimental procedures, along with calculations and descriptions of the biological index (BIX) and humification index (HIX), can be found in the Supplementary Material. Fluorescence EEMs of all samples were analyzed using parallel factor analysis (PARAFAC), which is a three-way method applied to divide the DOM fluorescence into separate fluorescent signals (Stedmon and Bro, Reference Stedmon and Bro2008). This analysis was carried out with MATLAB 2024a software using the drEEM toolbox (Murphy and others, Reference Murphy, Stedmon, Graeber and Bro2013).
FT-ICR MS measurements and data processing
Due to the low DOC concentrations in the glacier samples, solid-phase extraction (SPE) was essential for desalting and concentrating DOM to enhance detection sensitivity for Fourier transform ion cyclotron resonance mass spectrometry (FT-ICR MS) analysis. We employed Agilent Bond Elut PPL cartridges (100 mg, 3 mL) for SPE, following the established protocol (Dittmar and others, Reference Dittmar, Koch, Hertkorn and Kattner2008). Briefly, 100–400 mL of filtrate (volume adjusted according to DOC concentration to achieve a carbon loading of ∼60 μg C) was passed through a 0.22 μm membrane filter and acidified to pH 2. PPL cartridges (Agilent Bond Elut) were pre-cleaned with 6 mL of ULC-MS grade methanol, sealed and soaked overnight with 1.5 mL methanol. Prior to sample loading, the cartridges were conditioned sequentially with 3 mL of 0.01 M HCl, 3 mL of methanol and another 3 mL of 0.01 M HCl. The calculated volume of acidified sample was then loaded onto the PPL cartridges at a flow rate of ∼5 mL min−1. After sample loading, the cartridges were rinsed twice with 0.01 M HCl to remove inorganic residues, dried under a stream of high-purity N2 gas (99.999%) and eluted with 1 mL of methanol to recover the DOM.
The SPE DOM samples and Milli-Q water blanks were diluted 1:1 (v/v) with Milli-Q water prior to direct infusion into an electrospray ionization source (Bruker Daltonik GmbH, Bremen, Germany) operated in negative ion mode. The samples were introduced using a syringe pump at a constant flow rate. Mass spectra were acquired using a 9.4 T FT-ICR MS (Solarix, Bruker, Bremen, Germany) over a mass-to-charge (m/z) range of 150–1200 Da. Molecular formulas were assigned to peaks exceeding six times the root mean square baseline noise, i.e. S/N ratio >6σ, within the elemental constraints of C4–60H4–80O1–30N0–4S0–2 (Fu and others, Reference Fu, Fujii, Watanabe and Kwon2021, Reference Fu, Fujii, Watanabe and Kwon2022). Formula assignment followed established protocols, with further methodological details provided in the Supplementary Material. The assigned molecular formulas were visualized using van Krevelen diagrams (Kim and others, Reference Kim, Kramer and Hatcher2003) and characterized using the modified aromaticity index (AImod). AImod, which quantifies the degree of DOM aromatization, was calculated as follows: AImod = (1 + C − 0.5O − S − 0.5 [N + P + H])/(C − 0.5O − N − S − P) (Koch and Dittmar, Reference Koch and Dittmar2016). Based on their van Krevelen coordinates (O/C and H/C ratios) and AImod values, molecular formulas were categorized into six major classes: i) highly aromatic compounds (AImod > 0.66); ii) polyphenolic compounds (AImod > 0.5 and ≤ 0.66); iii) lignins (O/C ≤ 0.5, H/C < 1.5); iv) carbohydrates (O/C ≥ 0.9, H/C ≥ 2.0); v) aliphatics (O/C ≤ 0.9, 1.5 ≤ H/C < 2.0, N = 0); and vi) peptide-like compounds (O/C ≤ 0.9, 1.5 ≤ H/C < 2.0, N > 0) (Supplementary Table S1) (Kellerman and others, Reference Kellerman2019).
Results
DOC concentration along the continuum
To assess seasonal dynamics, we compared DOC concentrations during the peak melting period (July) and the late ablation period (October). In July, glacier-fed streams exhibited an average water depth of 0.41 m; fresh snow had the lowest DOC concentrations; however, surface ice showed significantly higher DOC levels (P < 0.01). Downstream sites—including the proglacial lake inlet, outlet and stream—all showed significantly lower DOC concentrations than surface ice (all P < 0.05) (Fig. 2a, Table 1). By October (the late ablation period), stream depth had decreased to 0.26 m, accompanied by reduced runoff and turbidity. DOC concentrations showed significant seasonal shifts across all sample types compared to July (Fig. 2a, Table 1). Surface ice DOC remained highest but declined from peak summer values, while fresh snow DOC levels increased slightly. Downstream sites demonstrated a similar spatial pattern, with relatively elevated concentrations at the stream site. The DOC removal efficiency from the glacial sources to the proglacial lake inlet was 73% in July and 68% in October.
Spatial and seasonal variations in dissolved organic carbon (DOC) concentrations (a), specific UV absorbance at 254 nm (SUVA254) (b), spectral slope coefficients (S 275–295) (c) and the humification index (HIX) (d) for DOM collected from supraglacial snow, surface ice, the proglacial lake (inlet and outlet) and the downstream stream during the mid-ablation (July) and late-ablation (October) seasons of 2021. Error bars represent ±1 standard deviation (1σ).

Figure 2 Long description
Four bar graphs labeled a, b, c and d. a. The y axis label is, DOC, milligram C L superscript minus 1. The y axis range is 0 to 1.0. The x axis categories are Fresh snow, Surface ice, Proglacial lake intake, Proglacial lake outlet, Stream. Two bars per category are labeled July and October. Fresh snow: July about 0.10, October about 0.25. Surface ice: July about 1.05, October about 0.70. Proglacial lake intake: July about 0.18, October about 0.12. Proglacial lake outlet: July about 0.12, October about 0.10. Stream: July about 0.16, October about 0.35. b. The y axis label is, SUVA subscript 254, L milligram C superscript minus 1 meter superscript minus 1. The y axis range is 0 to 3. The x axis categories are Fresh snow, Surface ice, Proglacial lake intake, Proglacial lake outlet, Stream. Two bars per category are labeled July and October. Fresh snow: July about 1.3, October about 0.6. Surface ice: July about 1.4, October about 0.6. Proglacial lake intake: July about 1.4, October about 1.0. Proglacial lake outlet: July about 1.8, October about 1.6. Stream: July about 2.7, October about 1.6. c. The y axis label is, S subscript 275 dash 295, micro-meter superscript minus 1. The y axis range is 0 to 40. The x axis categories are Fresh snow, Surface ice, Proglacial lake intake, Proglacial lake outlet, Stream. Two bars per category are labeled July and October. Fresh snow: July about 18, October about 17. Surface ice: July about 34, October about 31. Proglacial lake intake: July about 17, October about 13. Proglacial lake outlet: July about 24, October about 17. Stream: July about 15, October about 15. d. The y axis label is, HIX. The y axis range is 0 to 3. The x axis categories are Fresh snow, Surface ice, Proglacial lake intake, Proglacial lake outlet, Stream. Two bars per category are labeled July and October. Fresh snow: July about 0.35, October about 0.12. Surface ice: July about 1.55, October about 0.20. Proglacial lake intake: July about 0.66, October about 1.02. Proglacial lake outlet: July about 0.74, October about 0.57. Stream: July about 2.41, October about 0.99.
Dissolved organic matter characteristics and optical properties of snow, ice and proglacial lake and stream samples along the glacier–lake–stream continuum in July and October.

Table 1 Long description
Measurements are listed for sampling time, sample type, DOC in mg C per liter, SUVA254 in L mg C per meter, S275 to 295 in per micrometer, BIX, and HIX. July values: fresh snow DOC 0.11, SUVA254 1.27, S275 to 295 18.48, BIX 0.82, HIX 0.35; surface ice DOC 1.08, SUVA254 1.38, S275 to 295 34.24, BIX 1.01, HIX 1.55; proglacial lake intake DOC 0.16, SUVA254 1.38, S275 to 295 16.84, BIX 0.88, HIX 0.66; proglacial lake outlet DOC 0.10, SUVA254 1.81, S275 to 295 23.67, BIX 1.06, HIX 0.74; stream DOC 0.16, SUVA254 2.74, S275 to 295 15.16, BIX 0.62, HIX 2.41. October values: fresh snow DOC 0.24, SUVA254 0.61, S275 to 295 16.86, BIX 1.10, HIX 0.12; surface ice DOC 0.71, SUVA254 0.56, S275 to 295 30.63, BIX 1.39, HIX 0.20; proglacial lake intake DOC 0.15, SUVA254 0.97, S275 to 295 13.04, BIX 0.98, HIX 1.02; proglacial lake outlet DOC 0.13, SUVA254 1.57, S275 to 295 17.39, BIX 1.06, HIX 0.57; stream DOC 0.36, SUVA254 1.55, S275 to 295 15.42, BIX 0.71, HIX 0.99. From July to October, DOC decreases for surface ice from 1.08 to 0.71 and increases for fresh snow from 0.11 to 0.24 and for stream from 0.16 to 0.36. SUVA254 decreases from July to October for fresh snow, surface ice, proglacial lake intake, proglacial lake outlet, and stream. S275 to 295 is highest for surface ice in both months, at 34.24 in July and 30.63 in October.
DOM absorbance and fluorescence along the continuum
Surface ice samples from both July and October showed a characteristic absorption peak between 250–300 nm (Supplementary Fig. S1a, b), indicative of π→π* transitions in small aromatic compounds with three or more conjugated double bonds (Santos and others, Reference Santos2012). Notably, the absorption coefficients in this spectral region were significantly higher in July than in October (P < 0.05). In July, SUVA254 increased slightly from fresh snow (1.27 ± 0.18 L mg C−1 m−1) to surface ice (1.38 ± 0.07 L mg C−1 m−1) (Fig. 2b, Table 1). The proglacial lake inlet maintained comparable values (1.38 ± 0.32 L mg C−1 m−1), showing a direct glacial source (Fig. 2b, Table 1). However, substantial increases were observed at the lake outlet (1.81 ± 0.44 L mg C−1 m−1) and in the downstream stream (2.74 ± 0.45 L mg C−1 m−1) (Fig. 2b, Table 1). SUVA254 values in October were significantly lower throughout the continuum. Fresh snow averaged 0.61 ± 0.35 L mg C−1 m−1, decreasing slightly in surface ice (0.56 ± 0.07 L mg C−1 m−1) (Fig. 2b, Table 1). The proglacial lake showed progressive humification, with values increasing from the inlet (0.97 ± 0.23 L mg C−1 m−1) to the outlet (1.57 ± 0.21 L mg C−1 m−1) and ultimately stabilizing downstream (1.55 ± 0.66 L mg C−1 m−1) (Fig. 2b, Table 1). Accordingly, S 275 −295 exhibited an overall decrease from surface ice to the stream in both July and October (Fig. 2c, Table 1).
The fluorescence EEMs revealed that protein-like peaks were more pronounced in surface ice than humic-like peaks in stream water (Supplementary Figure S1c–f), and subsequent PARAFAC analysis of all samples identified four components (Supplementary Fig. S2) validated by split-half analysis (Supplementary Fig. S3). The validated four-component PARAFAC model—comprising one humic-like (C1) and three protein-like (C2, C3, C4) components—was verified by high similarity (Tucker congruence coefficient >0.95) to confirmed components in the OpenFluor database (Murphy and others, Reference Murphy, Stedmon, Wenig and Bro2014) and corroborated by previous reports (Feng and others, Reference Feng, An, Xu, Li, Jiang and Liao2020; Zhai and others, Reference Zhai, An, Feng, Qin and Xu2022). Component C1 (Ex/Em = 230/428 nm) was characterized as a UVA humic-like substance, typically associated with microbially derived humic materials (Fellman and others, Reference Fellman, Hood and Spencer2010b). Components C2 (Ex/Em = 245/308 nm) and C3 (Ex/Em = 230(270)/300 nm) were both identified as tyrosine-like, whereas C4 (Ex/Em = 230/340 nm) was classified as tryptophan-like. These protein-like fluorophores, frequently observed in cryoconite (Feng and others, Reference Feng2016) as well as in glacial surface snow and runoff (Feng and others, Reference Feng, An, Xu, Li, Jiang and Liao2020; Zhai and others, Reference Zhai, An, Feng, Qin and Xu2022), are indicative of microbially derived, amino acid-like DOM. This class of compounds is characterized by its high bioavailability (Fellman and others, Reference Fellman, Spencer, Hernes, Edwards, D’amore and Hood2010a). Analysis of the July samples revealed that protein-like components (C2–C4) dominated all samples, accounting for, on average, 76.4% of total fluorescence (Fig. 3), demonstrating predominance of proteinaceous DOM during peak ablation. Surface ice had a significantly lower relative contribution of protein-like fluorescence (72.2%) than fresh snow (87.8%; P < 0.05) (Fig. 3). Concurrently, the microbial humic-like component (C1) increased progressively from the proglacial lake inlet (14.3%) to the stream (44.1%) (Fig. 3). This trend was accompanied by progressively increasing HIX values (0.66–2.41). Moreover, significantly higher HIX and lower BIX values were observed in the stream samples compared to the snow, ice and proglacial lake samples (Fig. 2d, Table 1). Protein-like components dominated all sample types in October, with particularly elevated proportions in snow and ice (>93.0%) compared to the proglacial lake and stream samples (76.9–88.4%) (Fig. 3).
Fluorescence characteristics of dissolved organic matter (DOM) along the glacier–lake–stream continuum. (a, b) Fluorescence intensity of the four parallel factor analysis (PARAFAC)-derived components identified in supraglacial snow, surface ice, proglacial lake (inlet and outlet) and downstream stream samples collected during (a) July (mid-ablation) and (b) October (late-ablation). (c, d) Relative abundance (%) of the four PARAFAC-derived components in the same suite of samples for (c) July and (d) October.

Figure 3 Long description
A July. Legend text: Terr. humic-like C1; Red-shifted tyrosine-like C2; Tyrosine-like C3; Tryptophan-like C4. Vertical axis label: Fluorescence intensity (R. U.). Vertical axis range: 0.0 to 0.6. Horizontal axis categories: Fresh snow; Surface ice; Proglacial lake inlet; Proglacial lake outlet; Stream. Stacked bars: Surface ice is the tallest bar, reaching about 0.6. Fresh snow is the next tallest, around 0.35. Proglacial lake inlet, Proglacial lake outlet and Stream are shorter, each around 0.2. In each bar, the C4 segment is the largest segment. b October. Vertical axis label: Fluorescence intensity (R. U.). Vertical axis range: 0.0 to 0.6. Horizontal axis categories: Fresh snow; Surface ice; Proglacial lake inlet; Proglacial lake outlet; Stream. Stacked bars: Surface ice is the tallest bar, around 0.45. Stream is the next tallest, around 0.4. Proglacial lake outlet is around 0.25. Fresh snow and Proglacial lake inlet are shorter, each around 0.15. The Surface ice bar has a large C3 segment. The Stream bar has a large C4 segment. c July. Legend text: C1; C2; C3; C4. Vertical axis label: Relative contribution (percent). Vertical axis range: 0 to 100. Horizontal axis categories: Fresh snow; Surface ice; Proglacial lake inlet; Proglacial lake outlet; Stream. Each stacked bar totals 100 percent. Fresh snow shows a small C1 segment and a large C4 segment. Surface ice shows a larger C1 segment than fresh snow and a large C4 segment. Proglacial lake inlet and Proglacial lake outlet show larger C2 and C3 segments than fresh snow and surface ice. Stream shows the largest C1 segment among the five categories. d October. Vertical axis label: Relative contribution (percent). Vertical axis range: 0 to 100. Horizontal axis categories: Fresh snow; Surface ice; Proglacial lake inlet; Proglacial lake outlet; Stream. Each stacked bar totals 100 percent. Fresh snow shows a small C1 segment and a large C4 segment. Surface ice shows a small C1 segment and a large C4 segment. Proglacial lake inlet, Proglacial lake outlet and Stream show larger C1 segments than fresh snow and surface ice, with C4 remaining the largest segment in each bar.
Molecular characterization of DOM
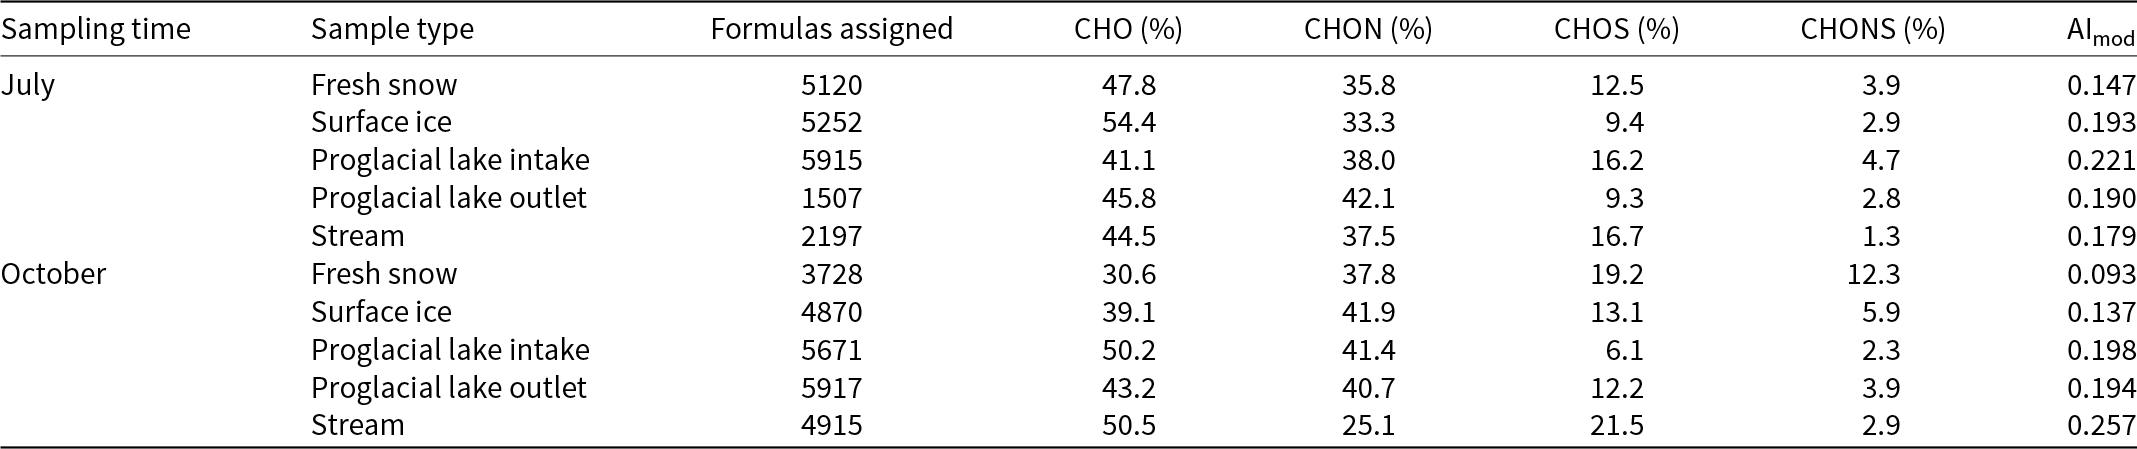
DOM composition was further analyzed using FT-ICR MS, which provides molecular-level information to assess DOM sources and transformation processes. In July, the glacial samples (snow and ice) displayed a higher relative abundance of CHO compounds (47.8–54.4%), whereas samples from the proglacial lake and stream were characterized by a greater proportion of heteroatom-containing compounds, particularly those containing CHON (37.5–42.1%) (Fig. 4; Table 2). The combined relative abundance of aliphatic and peptide-like molecules decreased from 52.7% in fresh snow to 36.2% at the proglacial lake inlet, increased slightly to 40.3% at the lake outlet and remained relatively stable in the stream (39.9%) (Fig. 4; Table 2). In contrast, in October, an opposite pattern to that in July occurred. The glacial samples exhibited a higher relative abundance of heteroatom-containing compounds (including CHON, CHOS and CHONS) (60.9–69.4%), while samples from the proglacial lake and stream were characterized by a higher abundance of CHO compounds (43.1–50.5%). Along the continuum, the relative abundance of aliphatic and peptide-like molecules declined sharply from 52.7% in fresh snow to 24.3% in the stream (Fig. 4; Table 2).
van Krevelen diagrams illustrating the molecular composition of dissolved organic matter (DOM) across the glacier–lake–stream continuum. (a, b) Molecular formulae assigned to DOM from fresh snow, surface ice, proglacial lake inlet, proglacial lake outlet and downstream stream samples collected during (a) July and (b) October. (c) Molecular formulae exhibiting significant Spearman rank correlations (p < 0.05) with key dissolved organic carbon (DOC) and optical properties: DOC concentration, specific UV absorbance at 254 nm (SUVA254), spectral slope coefficients (S 275–295), biological index (BIX) and humification index (HIX). The color scale in panel c represents the Spearman correlation coefficient (ρ) for each formula.

Figure 4 Long description
Van Krevelen diagrams illustrate the molecular composition of dissolved organic matter (DOM) across the glacier-lake-stream continuum. The diagrams are divided into three sections: (a) July, (b) October and (c) Spearman correlation with various properties. Each section contains five plots representing different sample types: Fresh snow, Surface ice, Proglacial lake intake, Proglacial lake outlet and Stream. The x-axis is labeled O over C ratio and the y-axis is labeled H over C ratio, both dimensionless, ranging from 0.0 to 1.0 and 0.0 to 2.0, respectively. In sections (a) and (b), the plots show the distribution of molecular formulae categorized by CHO, CHON, CHOS and CHONS compounds. In section (c), the plots display Spearman correlation coefficients with DOC, SUVA subscript 254, S subscript 275-295, BIX and HIX, with a color scale indicating the correlation strength from negative to positive. Notable patterns include a higher abundance of CHO compounds in July′s glacial samples and a shift to more heteroatom-containing compounds in October. Correlations show varying strengths, with some properties exhibiting strong positive or negative relationships with specific molecular formulae.
Number of molecular formulas identified, their relative abundances containing the heteroatoms nitrogen (N) and sulfur (S), and corresponding AImod values revealed by FT-ICR MS for dissolved organic matter in snow, glacier terminus ice and proglacial lake and stream samples collected downstream in July and October.

Table 2 Long description
Sampling time and sample type are listed with formulas assigned, percent CHO, percent CHON, percent CHOS, percent CHONS, and AImod. In July, formulas assigned are 5120 for fresh snow, 5252 for surface ice, 5915 for proglacial lake intake, 1507 for proglacial lake outlet, and 2197 for stream. July composition percentages are CHO 47.8, 54.4, 41.1, 45.8, and 44.5; CHON 35.8, 33.3, 38.0, 42.1, and 37.5; CHOS 12.5, 9.4, 16.2, 9.3, and 16.7; CHONS 3.9, 2.9, 4.7, 2.8, and 1.3, with AImod 0.147, 0.193, 0.221, 0.190, and 0.179. In October, formulas assigned are 3728 for fresh snow, 4870 for surface ice, 5671 for proglacial lake intake, 5917 for proglacial lake outlet, and 4915 for stream. October composition percentages are CHO 30.6, 39.1, 50.2, 43.2, and 50.5; CHON 37.8, 41.9, 41.4, 40.7, and 25.1; CHOS 19.2, 13.1, 6.1, 12.2, and 21.5; CHONS 12.3, 5.9, 2.3, 3.9, and 2.9, with AImod 0.093, 0.137, 0.198, 0.194, and 0.257. Across all rows, AImod ranges from 0.093 in October fresh snow to 0.257 in October stream.
All glacial samples were enriched in aliphatic and peptide-like molecular formulae (combined relative abundance 45.8–60.2%), with a minor contribution of polycyclic aromatic and polyphenolic compounds (combined 6.3–10.9%; Table 3). In both July and October, lignin compounds were the dominant component in the proglacial lake and stream samples (45.1–60.8%), followed by aliphatic compounds (17.9–26.8%) and peptide-like substances (5.3–22.4%) (Fig. 4; Table 3). We analyzed the covariance between the relative abundance of molecular formulae and various DOM-related parameters—including DOC concentration, SUVA254, S 275–295, BIX and HIX—using Spearman’s rank correlation analysis. Aliphatic and peptide-like compounds, which predominated in the glacial DOM pool, had a significant negative correlation with DOC concentration. In contrast, lignin, polyphenolic and polycyclic aromatic compounds showed a significant positive correlation with DOC concentration (Fig. 4c). Molecular formulae exhibiting a positive correlation with SUVA254 and a negative correlation with S 275–295 were primarily classified as lignin, polyphenolic and polycyclic aromatic compounds (Fig. 4c). Additionally, molecules showing a positive correlation with the BIX were predominantly aliphatic and peptide-like compounds. This indicates that glacial samples (snow and ice) with higher BIX values were indeed enriched in these bio-labile materials (Fig. 4c). Furthermore, molecules positively associated with the HIX were primarily identified as lignin, polyphenolic and polycyclic aromatic compounds, demonstrating that samples with higher HIX values (i.e. proglacial lake and stream samples) were enriched in lignin-derived and aromatic substances.
Relative abundances of molecular formulas assigned to each compound class, as revealed by FT-ICR MS, for dissolved organic matter in snow, glacier terminus ice and proglacial lake and runoff samples collected downstream in July and October.

Table 3 Long description
Percent relative abundances are listed for compound classes in dissolved organic matter by sampling time and sample type. Columns report Aliphatics, Peptides, Lignins, Carbohydrates, Polyphenolic, and Polycyclic condensed aromatics, all in percent. July values by sample type are: Fresh snow 31.1, 21.6, 40.8, 0.2, 3.9, 2.4; Surface ice 29.7, 16.1, 43.1, 0.3, 5.9, 5.0; Proglacial lake intake 23.0, 13.2, 49.0, 0.1, 8.1, 6.5; Proglacial lake outlet 17.9, 22.4, 47.6, 0.9, 7.3, 3.9; Stream 20.9, 19.0, 51.9, 0.3, 4.9, 3.0. October values by sample type are: Fresh snow 28.1, 32.0, 36.4, 0.5, 2.1, 0.9; Surface ice 26.5, 25.5, 42.1, 0.4, 3.4, 2.2; Proglacial lake intake 26.8, 17.2, 45.1, 0.1, 5.6, 5.3; Proglacial lake outlet 26.2, 16.3, 46.4, 0.1, 5.9, 5.0; Stream 19.0, 5.3, 60.8, 0.2, 11.3, 3.4. Carbohydrates are low in every row, from 0.1 percent to 0.9 percent. Polyphenolic ranges from 2.1 percent to 11.3 percent, and Polycyclic condensed aromatics ranges from 0.9 percent to 6.5 percent.
Molecular evidence of DOM transformation in glacier environments
An in situ bio-incubation experiment was conducted at the glacier terminus to study DOM transformation in snow and ice. In the light-dominated (microbe-reduced) treatment, the DOC concentration in the initial meltwater was 0.35 ± 0.05 mg C L−1; it increased to 0.56 ± 0.09 mg C L−1 after 10 days, peaked at 0.94 ± 0.03 mg C L−1 and then dropped to 0.39 ± 0.01 mg C L−1 after 30 days (Fig. 5a). The relative contribution of the humic-like fluorescence component decreased from an initial 54.0–12.3% after 30 days, whereas the protein-like component increased correspondingly. FT-ICR MS analysis showed that the relative abundances of major compound classes remained largely unchanged in this treatment. Given the residual microbial activity that likely persisted despite 0.2 μm filtration, these results suggest that photochemical processes alone had a limited impact on the gross molecular composition under the conditions tested. Under the combined influence of microbes and light (ambient treatment), the DOC concentration followed a trend similar to that observed under light exposure alone (Fig. 5b). However, the relative contribution of the protein-like fluorescence component increased from 46.0% on day 0 to 94.1% on day 10, before declining to 62.4% by day 30. The combined relative abundances of aliphatic and peptide-like compounds remained stable between day 0 (63.7%) and day 20 (67.6%) but decreased markedly to 45.5% by day 30. In the dark-microbial treatment, the DOC concentration increased from 0.35 ± 0.05 mg C L−1 on day 0 to 0.78 ± 0.41 mg C L−1 after 30 days (Fig. 5c). The fluorescence composition, however, exhibited a fluctuating trend over time. Similarly, the relative abundances of aliphatic and peptide-like compounds decreased from 63.7–36.6% within the first 10 days, increased to 56.3% by day 20 and experienced a slight decline to 47.0% on day 30.
Evolution of dissolved organic matter (DOM) composition during the in situ bio-incubation experiment. (a–c) Temporal changes in dissolved organic carbon (DOC) concentration (left axis), the relative contribution of parallel factor analysis (PARAFAC)-derived fluorescence components (stacked bars), and the relative abundance of major molecular compound classes, as determined by Fourier transform ion cyclotron resonance mass spectrometry (FT-ICR MS), in the (a) light-dominated (microbe-reduced), (b) ambient and (c) dark-microbial treatments. (d–f) van Krevelen diagrams illustrating molecular formulae (right axis) that were degraded (present on day 0, absent on day 30) or produced (absent on day 0, present on day 30) during the 30-day incubation for the (d) light-dominated (microbe-reduced), (e) ambient and (f) dark-microbial treatments.

Figure 5 Long description
Three sections labeled a Light-dominated microbe-reduced, b Ambient and c Dark-microbial. In a Light-dominated microbe-reduced, a bar chart has the vertical axis label, DOC mg C L minus 1 and the horizontal axis labels, C1, C2, C3, C4. The bars are approximately C1 0.35, C2 0.56, C3 0.94, C4 0.39. The highest bar is C3 at approximately 0.94. A stacked bar chart has the vertical axis label, Relative contribution percent and the horizontal axis labels, C1, C2, C3, C4. Each bar is split into two labeled segments, Humic-like and Protein-like. A stacked bar chart has the vertical axis label, Relative abundance percent and the horizontal axis label, Time Days, with tick labels 0, 10, 20, 30. Each time bar is split into labeled segments, Aliphatics, Peptides, Lignins, Carbohydrates, PCA and Polyphenolic. In b Ambient, a bar chart has the vertical axis label, DOC mg C L minus 1 and the horizontal axis labels, C1, C2, C3, C4. The bars are approximately C1 0.35, C2 0.95, C3 1.15, C4 0.40. The highest bar is C3 at approximately 1.15. A stacked bar chart has the vertical axis label, Relative contribution percent and the horizontal axis labels, C1, C2, C3, C4. Each bar is split into two labeled segments, Humic-like and Protein-like. A stacked bar chart has the vertical axis label, Relative abundance percent and the horizontal axis label, Time Days, with tick labels 0, 10, 20, 30. Each time bar is split into labeled segments, Aliphatics, Peptides, Lignins, Carbohydrates, PCA and Polyphenolic. In c Dark-microbial, a bar chart has the vertical axis label, DOC mg C L minus 1 and the horizontal axis labels, C1, C2, C3, C4. The bars are approximately C1 0.35, C2 0.55, C3 0.50, C4 0.78. The highest bar is C4 at approximately 0.78. A stacked bar chart has the vertical axis label, Relative contribution percent and the horizontal axis labels, C1, C2, C3, C4. Each bar is split into two labeled segments, Humic-like and Protein-like. A stacked bar chart has the vertical axis label, Relative abundance percent and the horizontal axis label, Time Days, with tick labels 0, 10, 20, 30. Each time bar is split into labeled segments, Aliphatics, Peptides, Lignins, Carbohydrates, PCA and Polyphenolic. The image B showing three scatter plots labeled d Light-dominated microbe-reduced, e Ambient and f Dark-microbial. Each scatter plot has the horizontal axis label, O slash C ratio, with tick labels 0.0, 0.2, 0.4, 0.6, 0.8, 1.0 and the vertical axis label, H slash C ratio, with tick labels 0.0, 0.5, 1.0, 1.5, 2.0. A legend shows two point categories labeled, Degraded and Produced. In each scatter plot, points appear across O slash C ratio from about 0.0 to 1.0 and H slash C ratio from about 0.0 to 2.0, with denser point clouds around mid-range values. Across the full figure, the bar charts provide DOC values for C1 to C4 in each treatment and the stacked bar charts and scatter plots show composition categories and point categories for the same treatment labels.
The differences in DOM signatures between the degraded (present on day 0, absent on day 30) and produced (absent on day 0, present on day 30) molecular classes during bio-incubation in the light-dominated (microbe-reduced) treatment (Fig. 5d) were primarily attributed to the preferential loss of lignin, polyphenolic compounds and polycyclic condensed aromatics (55.5%), alongside the concurrent production of aliphatic and peptide-like compounds (66.8% of the produced formulae). However, the overall DOM degradation and production rates remained relatively low, 3.5 and 5.5%, respectively. In the ambient treatment (Fig. 5e), the degraded DOM fraction was predominantly composed of aliphatic and peptide-like substances (50.9%), with the remainder consisting of lignin, polyphenolic and polycyclic aromatic compounds (49.1%). In contrast, the newly produced DOM fraction was overwhelmingly enriched in aliphatic and peptide-like compounds (64.1%). In the dark-microbial treatment (Fig. 5f), the composition of the transformed DOM showed a distinct pattern, where the degraded fraction was predominantly composed of aliphatic and peptide-like compounds (52.1%), whereas the produced fraction was mainly enriched in lignin, polyphenolic and polycyclic aromatic compounds (64.8%).
Discussion
Glacial sources export a distinct pool of labile, protein-dominated DOM
Our results confirm that the glacial system itself serves as a source of bioavailable DOM rather than merely acting as a passive conduit for atmospheric deposition. The significantly higher DOC concentrations in surface ice compared to fresh snow in both July and October (Fig. 2a, Table 1) indicate an in situ enrichment process, which is consistent with microbial production within the ice (Feng and others, Reference Feng, An, Xu, Li, Jiang and Liao2020). This biological origin is strongly corroborated by the molecular and optical characteristics of the glacial samples. The dominance of protein-like fluorescence components (C2–C4, accounting for 72.2–93.0% of total fluorescence; Fig. 3) and the high relative abundance of aliphatic and peptide-like molecular formulae (45.8–60.2%; Table 3) in snow and ice are clear indicators of autochthonous, microbially derived organic matter (Fellman and others, Reference Fellman, Spencer, Hernes, Edwards, D’amore and Hood2010a; Antony and others, Reference Antony, Grannas, Willoughby, Sleighter, Thamban and Hatcher2014). The low SUVA254 values (0.56–1.38 L mg C−1 m−1) associated with these signatures further suggest low aromaticity (Weishaar and others, Reference Weishaar, Aiken, Bergamaschi, Fram, Fujii and Mopper2003), confirming the highly biolabile nature of the DOM exported from the glacier.
Rapid and efficient removal of labile DOM in the proglacial zone
The most dramatic transformation occurs immediately upon export from the glacier. The 73% decline in DOC concentration from surface ice to the proglacial lake inlet in July (Fig. 2a) demonstrates exceptionally efficient removal over a short flow path. This removal rate is far higher than the 24% reported by Zhai and others (Reference Zhai, An, Feng, Qin and Xu2022), highlighting the role of the proglacial lake as a highly effective biogeochemical reactor. This is consistent with recent findings from other proglacial lakes on the QTP, where alterations in DOM composition were closely linked to microbial metabolism and associated biogeochemical processes (Mu and others, Reference Mu2025). The specific mechanism for this removal is illustrated by the molecular data: the sharp decrease in the combined relative abundance of aliphatic and peptide-like compounds from 52.7% in snow to 36.2% at the lake inlet (Fig. 4, Table 2) directly links the bulk DOC loss to the preferential consumption of these specific bio-labile compounds. The positive correlation of aliphatic and peptide-like compounds with BIX (Fig. 4c) further confirms that the samples enriched in these compounds (glacial sources) are also those with the highest potential for fresh biological input and, by extension, rapid microbial degradation.
Downstream shift toward terrigenous, aromatic DOM
As water flows from the proglacial lake outlet to the stream, the DOM pool revealed a gradually increasing terrigenous signature, evidenced by a series of consistent optical and molecular changes. SUVA254 values more than doubled from the lake inlet to the stream in July (1.38–2.74 L mg C−1 m−1) and increased significantly from the inlet to the outlet in October (0.97–1.57 L mg C−1 m−1) (Fig. 2b, Table 1). HIX gradually increased from the lake inlet to the stream (0.66–2.41), while the contribution of the microbial humic-like component C1 rose from 14.3–44.1% in July (Fig. 2d, Fig. 3). The dominant compound class in the proglacial lake and stream samples shifted to lignin compounds (45.1–60.8%; Table 3). These molecules, which are phenolic polymers derived from vascular plants, are known to be more recalcitrant (Ide and others, Reference Ide2017). The strong positive correlation of lignin, polyphenolic and polycyclic aromatic compounds with both DOC concentration and HIX (Fig. 4c) confirms that the downstream increase in DOC is driven by the input and accumulation of these more aromatic, soil-derived substances.
Seasonal variability reflects changing hydrological and biological drivers
A comparison of data from July (the peak ablation period) and October (the late ablation period) revealed how seasonal variations in hydrology modulated the dynamics of DOM. In October, glacial ice exhibited a higher relative abundance of heteroatom (N, S)-containing compounds and aliphatic/peptide-like molecules compared to July (Fig. 4, Table 2). This indicates that as melt rates decrease and the surface environment becomes more stable, there is a greater chance for in situ microbial activity to produce and accumulate a more nitrogen-rich, labile DOM pool on the glacier itself (Marshall and others, Reference Marshall2021), rather than having this material immediately flushed out. Although the pattern of DOM transformation along the continuum was similar in both seasons, the magnitudes differed. The lower SUVA254 values across all sites in October (Fig. 2b) indicate an overall less aromatic DOM pool. This loss of aromatic compounds is consistent with a mechanism involving reduced terrestrial runoff and increased water clarity, which has been shown to enhance photodegradation in similar systems (Cory and Kling, Reference Cory and Kling2018). The slight decrease in DOC removal efficiency from the ice to the proglacial lake inlet (73% in July to 68% in October) suggests that during lower flow, the system may be slightly less efficient at stripping the initial pulse of labile DOM, allowing more of it to persist further downstream.
Incubation experiment confirms microbial and photochemical drivers
The in situ incubation experiment provides direct and causal evidence for the transformation processes inferred from the field transect data. The results illustrate that the transition from a labile to a more refractory DOM pool is not simply a mixture of different sources but an active biogeochemical transformation. In the dark-microbial treatment, the degraded fraction was dominated by aliphatic and peptide-like compounds (52.1%), while the newly produced fraction was enriched in lignin, polyphenolic and polycyclic aromatic compounds (64.8%) (Fig. 5f). This suggests that microbial activity alone can convert bio-labile glacial DOM into more complex, aromatic-like molecules, likely through the production of microbial byproducts and cell material. The light-dominated (microbe-reduced) treatment showed minimal molecular change, primarily causing the loss of some aromatic compounds and a small production of aliphatics (Fig. 5d), implying that photochemistry alone is not the primary factor driving the observed downstream shift. However, the combined treatment involving both light and microbes produced the most dynamic transformation, with a high turnover of both aliphatic and aromatic compounds (Fig. 5e). This suggests that photochemistry likely pre-conditions the DOM, making it more susceptible to microbial degradation and enhancing the overall transformation rate (Ward and others, Reference Ward, Nalven, Crump, Kling and Cory2017). Similar patterns have been observed in glacier ice-algae habitats on the Greenland Ice Sheet, where dark heterotrophic degradation accounted for 35–50% of initial DOM loss, while light alone photodegraded only 6–16% (Rossel and others, Reference Rossel2025). This further supports our conclusion that microbial processing, rather than photochemistry alone, is the dominant driver of DOM transformation along the glacier–lake–stream continuum.
Having established the mechanistic drivers of DOM transformation at process scale, the findings carry profound implications for global biogeochemical cycles. As the accelerated ice melt from an estimated 275 000 glaciers worldwide profoundly alters the physicochemical properties of downstream waters, these molecular-level transformations directly affect essential ecosystem services—including drinking water supply, irrigation, hydropower generation and aquaculture—upon which over two billion people depend (Huss and others, Reference Huss2017; Rasul and Molden, Reference Rasul and Molden2019; Immerzeel and others, Reference Immerzeel2020). Given that glaciers discharge substantial amounts of minerals, nutrients and DOM to downstream ecosystems (Anderson, Reference Anderson2007; Li and others, Reference Li, Yongjian, Jianzhong, Xiaobo and Tianding2018b), future research should combine high-resolution DOM characterization with concurrent measurements of CO2 and CH4 fluxes along the glacial-proglacial continuum. Such an approach would elucidate the coupled mechanisms linking DOM composition—particularly the contrasting bioavailability of aliphatic and peptide-like compounds versus more refractory heteroatom-containing molecules—to microbial metabolic pathways and subsequent greenhouse gas production. By building directly upon the causal relationships established in this study, this integrative framework is especially valuable for understanding how seasonal shifts in DOM sources and transformation processes modulate carbon mineralization rates and the net carbon balance of these rapidly changing ecosystems.
Interpretation of incubation results within methodological constraints
Before discussing the broader implications, we explicitly acknowledge the constraints of our in situ design. The cold, fluctuating temperatures likely suppressed overall metabolic rates, meaning the observed transformation magnitudes represent minimum estimates of potential activity under more favorable conditions. Furthermore, the ‘light-dominated’ treatment contained residual microbes (as 0.2 μm filtration does not achieve sterility), which may cause a slight overestimation of photochemical effects and an underestimation of true microbial contributions. Despite these limitations, the consistent and treatment-specific molecular patterns—particularly the marked net loss of aliphatic and peptide-like compounds only in treatments that contained active microbial communities (ambient and dark-microbial)—provide strong weight of evidence that microbial processing is the dominant driver of DOM transformation along the glacier–lake–stream continuum.
Methodological limitations in context
As detailed in the Materials and methods section, the primary technical constraints are (i) incomplete microbial removal in the light-dominated treatment and (ii) uncontrolled temperature fluctuations. These limitations mean our conclusions regarding the relative roles of photochemistry vs. microbes are conservative. The key finding—that aliphatic and peptide-like compounds were preferentially lost only when live microbes were present—remains robust despite these constraints.
Conclusions
This study provides a comprehensive, source-to-sink assessment of DOM dynamics in a glacial system. The integrated dataset reveals that glacial DOM is intrinsically biolabile, with surface ice and snow consistently enriched in protein-like fluorescence components and aliphatic/peptide-like molecular formulae. This distinct compositional fingerprint, coupled with low SUVA254 values, confirms that the organic matter exported from glaciers is primarily autochthonous, microbial in origin and highly susceptible to rapid degradation. The proglacial zone functions as a highly efficient biogeochemical reactor, evidenced by a 73% decline in DOC concentration from the glacier snout to the proglacial lake inlet. This pattern demonstrates rapid and preferential removal of bioavailable DOM, which is linked to the consumption of aliphatic and peptide-like compounds. Downstream of the lake, a concurrent increase in SUVA254, HIX, humic-like fluorescence (C1) and lignin-derived molecular formulae provides clear evidence for the progressive accumulation of more recalcitrant, terrestrially sourced DOM. Our in situ incubation experiments, conducted under ambient field conditions with acknowledged methodological constraints (non-sterile filtration, fluctuating temperatures), provide evidence consistent with the hypothesis that microbial activity drives the conversion of labile aliphatic and peptide-like compounds into more complex molecular structures. Light exposure appeared to play a secondary, potentially synergistic role. Within the constraints of our experimental design, this coupled mechanism likely explains the observed spatial gradient from a protein-like to a humic-like DOM pool along the continuum.
Together, these findings demonstrate that the flux of organic matter from glaciers is not a passive hydrological transfer but an active biogeochemical cascade. The rapid removal of biolabile DOM in proglacial environments identifies these headwater systems as hotspots for microbial metabolism and carbon mineralization. As ongoing glacier retreat modifies meltwater delivery, the supply of this reactive carbon source to downstream ecosystems will change. Future studies under more tightly controlled conditions (e.g. sterile filters, constant temperatures) are needed to fully disentangle the relative contributions of photochemistry and specific microbial taxa. Nevertheless, our study establishes that predicting future carbon cycling in alpine watersheds must explicitly account for the dynamic transformation of glacial DOM, not merely its export.
Supplementary material
The supplementary material for this article can be found at https://doi.org/10.1017/jog.2026.10209.
Data availability statement
The data used in this study are publicly available at https://figshare.com/articles/dataset/_/30006382.
Acknowledgements
This research was supported by grants from the Sichuan Natural Science Foundation Project (2024NSFSC0793), the National Natural Science Foundation of China (grants 32260296, 42322104 and 42471123), the Youth Innovation Promotion Association, CAS (2021312), the Dagu Glacier Research Institute (Center) project of Aba Normal College (AS-DTPT 2023-072) and the research programs of Aba Bureau of Science and Technology (R21YYJSYJ0005). E.J. is grateful for the support of Yunnan Provincial Council of Academicians and Experts Workstations (202405AF140006). We thank Anne Mette Poulsen for English editing. We also extend our gratitude to the reviewers and the scientific editor, whose thoughtful critiques greatly improved this manuscript.
Author contributions
L.F.: Methodology, Sampling, Data curation, Writing—original draft, Writing—review and editing. Y.L.: Investigation, Data curation. Y.Z.: Data curation, Writing—review and editing. W.N.: Sampling, Review and editing. E.J.: Review and editing.
Competing interests
The authors declare no conflicts of interest relevant to this study.




 Open access

