Mrs. Reilly called in that accent that occurs south of New Jersey only in New Orleans, that Hoboken near the Gulf of Mexico.
—A Confederacy of Dunces (Toole, Reference Toole1980:4)This study takes as its point of departure the common observation that New Orleans English (NOE) and New York City English (NYCE) sound alike. From laypeople to linguists, the comparison often highlights the way that NOE sounds like a modified version of its northern counterpart—a local New Orleans commentator suggested that “for those who have never heard it [NOE], you must begin by imagining all of Brooklyn on Quaaludes” (Lyman, Reference Lyman and Matthews1978:iv). From a dialectological standpoint, it is an unusual connection, as the two language varieties sit 1300 miles apart, in different dialect regions, and separated by numerous isogloss boundaries. Despite this fact, there is linguistic evidence, at least on the surface, to support the observed resemblance. An inventory of core phonological characteristics in each city looks identical: variable nonrhoticity in the syllable coda, the stopping of interdental fricatives /θ/ and /ð/, a split short-a system, bought-raising, and the diphthongization of the bird vowel (/ɝ/>/ɜɪ/, i.e., the iconic NYCE “thoity-thoid” pronunciation). The extent of the similarities has prompted scholars to explore the possibility that the varieties share a common source as the result of language contact (Eble, Reference Eble2016; Labov, Reference Labov2007).
However, there is no consensus in the literature as to when and how this contact may have occurred. Scholars point to the economic and cultural ties between the two cities in the 19th century, but there is no overwhelming historical evidence of either the demographic or cultural circumstances thought to be necessary components of dialect transfer. In the absence of satisfactory historical or linguistic diachronic evidence, Labov (Reference Labov2007) utilized the sociolinguistic tools of variationist analysis to evaluate the connection between NOE and NYCE. He made a case for diffusion, defined as the transfer of features from one speech community to another as the result of contact and characterized by a weakening of the original pattern and a loss of structural features (Labov, Reference Labov2007:344, 347). Labov argued that NYCE diffused to NOE by demonstrating that the complex NYCE short-a system was present in a weakened form in NOE.
The present study utilizes a similar synchronic variationist methodology, contributing evidence from two additional features found in both NYCE and NOE: variable nonrhoticity—–or (r)—and bought-raising, or pronunciations of the vowel /ɔ/ in words like coffee and law with tongue raising. These features, along with short-a, are the most well-studied phonological features of NYCE, though they differ in terms of when each emerged in the variety. While (r) was brought by British settlers from Southern England to the eastern seaboard in the 18th century, bought-raising developed internally across the Mid-Atlantic region in the early to mid-20th century. Utilizing the method of constraint ranking comparison (CRC), which assesses the similarity of internal constraints on variation, we find that NYCE and NOE share strikingly similar internal constraints for (r), but show little internal similarity for bought-raising. Examining these findings in the context of previous studies, we interpret the lack of similarity for bought as possible evidence that diffusion occurred in the 19th century, before bought developed but after (r) and short-a had stabilized in NYCE. Taken together, this synchronic evidence supports Labov's (Reference Labov2007) argument for diffusion from NYCE to NOE and places the period of diffusion in the 19th century.
EVIDENCE OF A SHARED HISTORY
Why posit a connection at all?
Though this paper exclusively explores the posited New York City–New Orleans connection, it is important to acknowledge the possibility that something else accounts for the distinctive phonology of NOE. One possibility is independent development; that is, that the core features mentioned are the result of internal sound changes that happen to result in a system similar to that of NYCE. One feature we examine here, bought-raising, is by all accounts an internal change that emerged in the mid-Atlantic region, including NYCE. Could it have also developed independently in NOE? we do indeed come to this conclusion for bought, but argue that the full set of features common to NYCE and NOE cannot be a coincidence, due to sheer number, warranting the general investigation of a relationship. A second possibility is that NOE's features diffused from a more local source such as Southern English. One feature we explore, (r), is not restricted to the two cities, but was in fact widespread throughout the South, particularly in coastal port cities but also as far inland as Texas and Arkansas (Feagin, Reference Feagin, Edmondson, Feagin and Mülhausler1990; Labov, Ash, & Boberg, Reference Labov, Ash and Boberg2006; Thomas, Reference Thomas2001). However, NOE is something of a dialect island in the South, differentiated from neighboring varieties based on both phonological (Labov et al., Reference Labov, Ash and Boberg2006; Rubrecht, Reference Rubrecht1971) and lexical (Babington & Attwood, Reference Babington and Attwood1961) features. Although (r) and the related feature bird-diphthongization are shared with certain Southern neighbors, there is little evidence that NOE's other distinctive features could come from closer to home. That, coupled with the compelling evidence we present demonstrating that NOE's system for (r) strongly resembles NYCE's, suggests that NOE remains unique within the Southern dialect region.
In approaching this study, we build on the metalinguistic commentary of native speakers; the observations of authors, historians, and journalists; and the prior work of linguists, who all conclude the same thing—NOE just sounds like NYCE. As for the explanations for this similarity, they are wide-ranging. The following sections provide an overview of the various types of evidence of a shared history for the two varieties, beginning with folk theories, then presenting historical evidence, and finally examining the existing linguistic evidence.
Folk theories
As documented in Carmichael (Reference Carmichael2014:6–7), contemporary New Orleanians are frequently mistaken for New Yorkers because of their accents:
Frank: I travel all over the world and the first thing they ask: “are you from New York?”
Momma B: People always seem to think we're from New York, the way we talk.
Benjamin: [Working in downtown New Orleans,] I would deal with a lot of tourists and I would get questions, asking you know, “where are you from? New York? Are you from Brooklyn?”
New Orleans residents have developed folk theories to explain the resemblance. In his introduction to the satirical Unabridged Yat Dictionary (Reference Champagne2012:5–7), local comedy writer Chris Champagne captured some of these theories:
The New Orleans accent is best described as very much like the New York accent. … There are several theories as to why our accent is closer to a city a thousand miles away than to the rest of the South. One is that a group of nuns from New York was imported to teach in the Catholic schools in New Orleans, and they brought the accent here. Another reason could be that the waves of Irish, Italian and German immigrants hit New Orleans and New York with the same impact and at the same time.
Most folk theories focus on the role of ethnic immigrant groups in shaping each variety, namely the large numbers of Irish and Italians who migrated to each city in the 19th century. Indeed, the speech of White ethnic immigrant groups has been linked to variation in the shared features—in NYCE, for example, Labov ([1966] Reference Labov2006:186–190) found significant differences for bought-raising between Jewish and Italian Lower East Siders. These folk histories may have identified a potential cause for the similarities between NYCE and NOE, though reliable evidence from the historical record would be necessary to reach a conclusion.
Historical evidence
This paper does not attempt to resolve the available historical record for a connection, in large part because there is simply not enough evidence, which has led prior scholars to take a variety of positions. What most agree on is that, while modern-day New York and New Orleans differ considerably, they share some commonalities in their historical development. Both cities boasted considerable shipping and commercial trade industries in the early to mid-1800s, with New Orleans declining in this capacity during Reconstruction. Both were also major ports of entry for immigration, with large Irish and Italian populations among these immigrant groups. Like the above-mentioned folk theories, this similar immigration history has led some scholars (Dillard, Reference Dillard and Spitzer1985; Gerdes, Reference Gerdes2012; Inskeep, Reference Inskeep2005; Shiedlower, Reference Sheidlower2005) to suggest that the linguistic features shared by NOE and NYCE resulted from the particular mixture of immigrant influences in each city. However, the extent of this shared immigration history has been called into question (Eble, Reference Eble2016), and moreover, it is unclear how so many phonological features would independently develop in two disparate varieties and not in others with similar populations (cf. Dajko, Reference Dajko2016).
There does exist historical evidence to support contact between English speakers from the North and South during the antebellum period as a result of the cotton trade. Berger (Reference Berger and Dillard1980:51), for example, described a “maritime connection” between New York City and the South:
In the ante-bellum period, roughly between 1820 and 1860, financial, commercial and social relations between the city and the South were at a fever pitch: New York banks underwrote the plantation economy, cotton was shipped routinely from New Orleans, Charleston, Savannah and Mobile to be trans-shipped to England, and Southern planters regularly combined business with pleasure in the Big Apple of the 1800s.
Here, Berger did not establish a specific connection between New York City and New Orleans, though he noted the role of New Orleans as the second largest port in the country at the time (49). Labov (Reference Labov2007) did explicitly connect the two cities, pointing to the arrival in New Orleans of Sephardic Jews from New York throughout the 1800s, who set up shop in town as bankers and cotton merchants. The historical record further suggests that during the height of the cotton trade in the mid-1850s, large numbers of transient businessmen from New York migrated between the two cities seasonally (Campanella, personal communication) and upper-class New Orleanians likewise often headed north for the summer (Hall, Reference Hall1851).
Eble (Reference Eble2016:8) cautioned against an explanation based on “the straightforward connection between New York and New Orleans via cotton,” however there are indications that a Northern presence in antebellum New Orleans extended beyond cotton merchants and bankers. Chenault and Reinders (Reference Reinders1964:233) wrote that during the antebellum period, more than a quarter of all free, white, native-born Americans in New Orleans were from the North. According to the 1850 census, of the 119,460 total New Orleans residents, 9461 were born in the North, with New York as the leading contributor at 4086. These Northerners appear to have exerted local influence throughout the 1800s: English-language newspapers, including the Times Picayune, were frequently owned by Northerners (Chenault & Reinders, Reference Chenault and Reinders1964:239); teachers were recruited from New York and Philadelphia throughout the middle of the 19th century; and students were taught a Northern “phonetic system of reading” from New England primers (Reinders, Reference Reinders1964:186).
Clearly, the two cities were in contact during the antebellum period; however, the extent of that contact, and its direction of influence, remains obscure in the historical record. According to the 1850 census, the number of New Yorkers in New Orleans was quite small, but, as Campanella (personal communication) pointed out, transient businessmen would not be captured in census numbers. Also, it is possible for small but prestigious populations to exert outsized linguistic influence, which NOE expert George Reinecke suggested may have been the case for wealthy Northern merchants in New Orleans (Kent, Reference Kent1979). Further research into the sociohistorical conditions for contact will hopefully contribute clarity to the New York City–New Orleans connection. In its absence, we turn to the available linguistic evidence.
Linguistic evidence
Diachronic linguistic evidence, namely recordings of speakers of each variety from the 19th century and onward, would best establish a shared history. Unfortunately, there was little to no audio or textual data recorded during the 19th century for either variety. The earliest record of NYCE is from Babbitt (Reference Babbitt1896), who gave phonetic notes on features observed in New York City at the turn of the 20th century. The interviews for the Linguistic Atlas of the Eastern United States, which include 25 New York City residents, were conducted in 1941 and provide time depth into the 19th century through the speech of older residents. The NYCE data was reported on in Frank (Reference Frank1948), Wetmore (Reference Wetmore1959), and Kurath and McDavid (Reference Kurath and McDavid1961). Notably, in all of these texts nonrhoticity (or variable nonrhoticity) and a split short-a system were described, but bought-raising above the canonical [ɔ] was not.
For NOE, documentation is sparser. The earliest linguistic description comes from Reinecke's (Reference Reinecke1951) thesis, in which he analyzed the pronunciations of white schoolchildren and adults reading from a brief passage. The oldest group of speakers in this study provided time depth back to the turn of the 20th century. All participants, young and old, featured nonrhotic pronunciations at high rates, with 89% [r-0] for children (984 of 1102 tokens) and 87% [r-0] for adults (450 of 520 tokens), with “stressed r” (e.g., world, girl, university, nurses) the most frequently rhotic environment. While Reinecke's data did not provide conclusive evidence for the presence of a split short-a system,Footnote 1 bought-raising in his corpus was attested both by children and adults (including the oldest group of speakers), though Reinecke noted that children feature more raised tokens than adults do. Audio-recorded interviews for the Linguistic Atlas of Gulf States Footnote 2 (Pederson, McDaniel, & Adams, Reference Pederson, McDaniel and Adams1986–1993) were conducted between 1977 and 1983, and included 13 speakers classified as native to the New Orleans metropolitan area. Two elderly speakers, one an upper-class white man born in 1897 and another a working-class woman born in 1896, both clearly feature nonrhoticity and bird-diphthongization. The upper-class man shows no evidence of either split short-a or bought-raising. In contrast, the working-class woman produces tense short-a in words like had, half, after, last, daddy and has mild bought-raising.
In the absence of adequate diachronic data, scholars can turn to texts or contemporary linguistic samples for linguistic evidence. Berger (Reference Berger and Dillard1980) used texts from the 19th century to argue for the transfer of bird-diphthongization from the South to NYCE. Berger dated the emergence of this feature in NYCE to the 1850s and asserted that it spread northward rather than the other way around. At this time, Southern speech was viewed as prestigious, and Southerners and New Yorkers were in contact at multiple social levels. Berger's analysis of bird-diphthongization relies on this feature's embeddedness within the variably nonrhotic Southern dialect, which dominated an expansive geographic area across the South, from Texas to the Atlantic coast (see also Strand, Wroblewski, & Good, Reference Strand, Wroblewski and Good2010; Thomas, Reference Thomas2001; Underwood, Reference Underwood1982), while New York City as a variably nonrhotic variety was small and isolated. Logically, Berger argued, the transfer of bird-diphthongization would be from the geographically dominant South to New York City.
Labov (Reference Labov2007) contrasted with Berger (Reference Berger and Dillard1980) both methodologically and in terms of the proposed direction of transfer. Instead of texts, Labov turned to synchronic analysis to argue that NYCE transferred to NOE. He used historical evidence to argue for “intimate” relations between the two cities and appealed to the gravity model that concluded that the larger city (in this case New York City) influences the smaller. But his primary evidence comes from a structural analysis of a contemporary linguistic feature, the split short-a system, where words with historical short-a (/æ/) are split into tense (bad) and lax (bat) sets. The complex short-a system of NYCE is an excellent test case for diffusion, in which features lose structural complexity when transferred from adults to other adults (in contrast with normal transmission from adults to children). The NYCE system is phonologically conditioned, with tense bad before front nasals, voiced stops, and voiceless fricatives, but the system has added constraints on variation related to function words, open syllables, inflectional boundaries, and lexical exceptions. Labov argued that NYCE short-a diffused to multiple locations in the United States, including New Orleans, and in each case presented evidence that the original NYCE pattern was present, though weakened. In New Orleans, the phonological conditioning was slightly altered, and the function word and open-syllable constraints were weakened or absent. Carmichael (Reference Carmichael2014), using a larger sample, confirmed that the NOE system is a slightly modified and simplified form of NYCE short-a. In short, the synchronic linguistic evidence for short-a makes Labov (Reference Labov2007)’s case for diffusion from NYCE to NOE.
Dajko (Reference Dajko2016) also evaluated the structural similarities of contemporary data, in this case comparing constraints on (r) in Independence, Louisiana, and in New Orleans. This research tested the hypothesis that similar immigration patterns—namely, the presence of Sicilian immigrants—could lead independently to similar systems for (r). Throughout the late 1800s, Sicilian in-migration to New Orleans boomed as a result of a state-supported effort to recruit laborers for sugar plantations (Campanella, Reference Campanella2006:335), with some of these Sicilian immigrants settling in the rural town of Independence, 70 miles north of New Orleans. Dajko hypothesized that any similarities in (r) between speakers in Independence and those in New Orleans would arise from shared Sicilian heritage rather than contact between New Orleanians and Independence residents. However, her findings revealed notable differences between the constraints governing (r) in these two varieties, suggesting that shared immigration is not the key to (r)'s structure, thereby weakening the case that shared immigration is what links New York City and New Orleans. This begs the question of whether the constraints on (r) for NYCE and NOE do show similarities, which we turn to now.
METHODS
Constraint ranking comparison
The present study contributes to the body of variationist analyses, such as Labov (Reference Labov2007) and Dajko (Reference Dajko2016), that sought evidence for or against a shared history between NYCE and NOE on the basis of contemporary structural similarities. Labov (Reference Labov2007), in particular, made a strong case for diffusion from NYCE to NOE on the basis of the split short-a system and provided a testable hypothesis that diffusion was identifiable when comparing the complexity of constraints on variation. Labov's approach was part of a much larger body of literature that used variationist techniques to evaluate whether two contemporary dialects share a common source. This method, known as constraint ranking comparison (CRC), applies the intricate tools of variation analysis to the comparative method of historical linguistics. The CRC method has been used widely by sociolinguists attempting to answer questions about a shared history for two varieties when historical data is lacking (Poplack & Tagliamonte, Reference Poplack and Tagliamonte2001; Rickford, Reference Rickford2006) or to characterize the outcome of contact between varieties (Meyerhoff, Reference Meyerhoff2009; Nagy & Irwin, Reference Nagy and Irwin2010; Otheguy, Zentella, & Livert, Reference Otheguy, Zentella and Livert2007). Where the comparative method might look to identical forms (or cognates) in two independent varieties as evidence of a common source, CRC compares the variable patterning of identical forms. Because transmission, or the transfer of linguistic features from adults to children, is characterized by incremental changes including an increase or decrease in frequency, comparing the rates of occurrence of an identical form in two varieties is insufficient; instead, the similarity of internal constraints on variation is compared. These internal constraints are taken to be evidence of the underlying variable grammar (Poplack & Tagliamonte, Reference Poplack and Tagliamonte2001:5). If the constraints on variation for two identical features in two separate varieties are identical or sufficiently similar, we can conclude that the feature derives from a common source.
The CRC method was developed by Poplack and Tagliamonte (Reference Poplack and Tagliamonte2001) in their analysis of diaspora varieties of African American English as part of the so-called origins controversy for African American English. They examine regression models, which consider potential predictors on a variable simultaneously, for evidence of similarity, focusing on the factors selected as significant predictors as well as the ordering of levels within significant factor groups. The CRC method assumes a reliable transfer of variation both over time and in cases of language contact. Though the overall rate of occurrence for some variable can change over time and vary as a result of extralinguistic factors as well as the circumstances of the data collection, the internal (or linguistic) constraints on variation should remain constant (Poplack & Tagliamonte, Reference Poplack and Tagliamonte2001:92). In Poplack and Tagliamonte's data, a comparison of contemporary African American English data with a benchmark variety revealed remarkable continuity of internal constraints across more than two centuries (240).
A comparison of internal constraints through CRC should shed light on shared history; if two varieties look quite similar, they come from a common source; if they are dissimilar, they do not. In addition, a specific outcome is expected in the case of diffusion, which involves the weakening of the original pattern. This weakening should be easily identifiable through the CRC method; the two varieties should have sufficiently similar systems, but the source variety will have more constraints, or more complex constraints, while the diffused variety will have fewer/simpler constraints. Indeed, CRC has been utilized to provide evidence of diffusion from one variety to another and to posit the identity of the source variety. Nagy and Irwin (Reference Nagy and Irwin2010) used the CRC method to explore the relationship between Boston English and New Hampshire English, using (r) as evidence. New Hampshirites used a less complex system than Bostonians did; this, in combination with sociodemographic evidence, was the basis of their argument that Boston (r) had diffused to New Hampshire. Buchstaller and D'Arcy (Reference Buchstaller and D'Arcy2009) used CRC to examine how quotative be like diffused from American English to other varieties of English around the globe, examining how internal constraints adapted to fit local systems.
The following analysis is adapted from Poplack and Tagliamonte's original method. If NYCE did diffuse to NOE, as Labov (Reference Labov2007) argued, there should be evidence of diffusion in the constraints on variation for shared features in addition to short-a. We present an analysis of (r) and bought-raising, two features commonly cited in comparisons of NYCE and NOE. (r) is an excellent candidate for CRC, with complex constraints on variation and a wealth of comparative data (Becker Reference Becker2014a; Nagy & Irwin, Reference Nagy and Irwin2010). Though bought-raising has fewer internal constraints, both variables allow for additional evidence from contemporary speakers’ systems to contribute to the questions surrounding the New York City–New Orleans connection in the absence of solid sociohistorical or diachronic linguistic data.
The sample
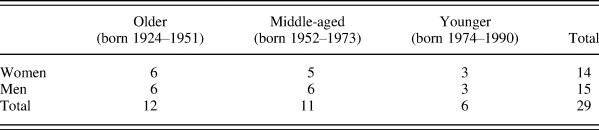
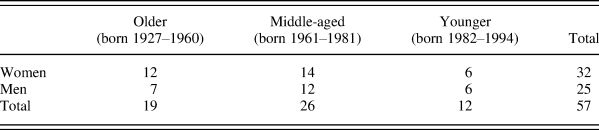
We compare similar sets of speakers from New York City and New Orleans, consisting of 29 (self-identified) white and Jewish New Yorkers from the Lower East Side, recorded in 2008–2009, and 57 (self-identified) white New Orleanians from the suburb of Chalmette, recorded in 2012. In both cases, the data can be characterized as casual speech within the context of a sociolinguistic interview. Speakers are evenly split across three discrete age categoriesFootnote 3 and two gender categories. While social class categorizations differed too much between the two samples to be investigated here, both sets of speakers came from working-class communities, making them roughly comparable according to class. Tables 1 and 2 present distribution of speakers across age groups and genders for each sample.
New York City participants by age

New Orleans participants by age

VARIABLE NONRHOTICITY (R)
(r) in New York City and New Orleans
Variable nonrhoticity, or (r), is a widespread linguistic phenomenon in American English. Most scholars agree that it arrived with settlers from southern England in the 18th century, and it was prevalent in major cities along the eastern seaboard, from Boston and its environs (Irwin & Nagy, Reference Irwin and Nagy2007; Nagy & Irwin, Reference Nagy and Irwin2010) to New York City (Becker, Reference Becker2014a; Labov, [1966] Reference Labov2006) to the Southern United States (Baranowski, Reference Baranowski2007; Feagin, Reference Feagin, Edmondson, Feagin and Mülhausler1990; McDavid, Reference McDavid1948; Stephenson, Reference Stephenson1968; Van Riper, Reference Van Riper1957). In all of these locales, there has been sound change in the direction of rhoticity over the last 65 years.
In New York City, nonrhoticity was initially the prestige norm for the upper classes. At the turn of the 20th century, Babbitt (Reference Babbitt1896) noted that nonrhoticity was widespread in the general population. Signs of a change came in the mid-twentieth century, when scholars first noted the presence of variable nonrhoticity in the speech of New Yorkers (Bronstein, Reference Bronstein1962:24–25; Frank, Reference Frank1948; Hubbell, Reference Hubbell1950:48). (r) is the hallmark variable in Labov ([1966] Reference Labov2006) that was presented as a change in progress from above in the direction of rhoticity. In real-time studies of Labov's classic department store study, Fowler (Reference Fowler1986) and Mather (Reference Mather2012) demonstrated the slow advance of the change in progress. Becker (Reference Becker2014a) showed that rhoticity continues to advance, with the change led by the young, women, white, and Jewish speakers, and the middle classes. Becker (Reference Becker2014a) also used the CRC method to evaluate whether white and nonwhite ethnic groups on the Lower East Side use the same system for (r). The factors and levels predicting (r) were quite similar, suggesting that speakers from these ethnic groups share the NYCE system.
Like NYCE, NOE is also undergoing change toward rhoticity. The earliest mention of (r) in NOE was in Reinecke (Reference Reinecke1951:81–91), which documented high rates of nonrhoticity in the speech of white schoolchildren and adults; Reinecke at that time suggested that nonrhotic pronunciations were the norm in New Orleans. Thirty years later, Brennan (Reference Brennan1983) found a marked drop in rates of nonrhoticity in the speech of both black and white New Orleanians, concluding that rhoticity was becoming a prestige marker in NOE. Schoux Casey (Reference Schoux Casey2013, Reference Schoux Casey2016) completed a restudy of Linguistic Atlas of Gulf States data (Pederson et al., Reference Pederson, McDaniel and Adams1986–1993) as well as an analysis of her own sample of recordings collected in 2012, finding in both cases that the change in progress toward rhoticity had further advanced. Carmichael (Reference Carmichael2017) similarly documented the decline in nonrhotic realizations even in the linguistically conservative, white working-class New Orleans suburb of Chalmette. Dajko, Schoux Casey, and Carmichael (Reference Dajko, Schoux Casey and Carmichael2012) suggested that the change in progress is led by white New Orleanians from the urban core, while black New Orleanians and suburban white New Orleanians appear to lag a generation behind.
(r) coding
For both the NYCE and the NOE datasets, independent coders used a binary classification of /ɹ/ in the syllable coda, categorizing each token as consisting of /ɹ/ constriction —[r-1]—versus /ɹ/ vocalization or deletion, or [r-0]. The NYCE data consists of 8474 tokens of (r), an average of 292 per speaker, while the NOE data consists of 2855 tokens of (r), an average of 50 per speaker. The NYCE data was checked by three independent coders and the NOE data by two independent coders for intercoder reliability. Both datasets showed that categorization as [r-0] or [r-1] was highly consistent across listeners.
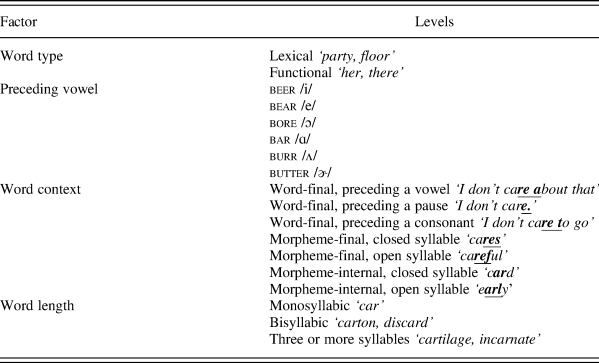
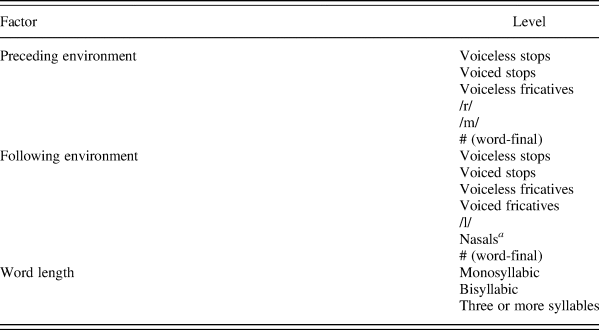
The internal constraints on (r) have been shown to vary across speech communities, though there are common linguistic patterns across studies. With respect to word context, word-final /ɹ/ before a vowel, or linking /ɹ/, favors [r-1] more than /ɹ/ before consonants or pauses (Becker, Reference Becker2014a:155; Wolfram, Reference Wolfram1969:114). With respect to preceding vowel, the stressed central vowel burr favors [r-1] the most, while /ɹ/ in unstressed syllables (butter) is favored the least (Feagin, Reference Feagin, Edmondson, Feagin and Mülhausler1990:137; Nagy & Irwin, Reference Nagy and Irwin2010:257; Wolfram, Reference Wolfram1969:112). Lexical words and shorter words have also been found to favor [r-1]. The factors and levels for (r), which are presented in Table 3, are based on these prior findings.
Internal factors for (r)

Statistical analysis
A series of logistic mixed-effects regression models were generated in Rbrul, which returns factor weights for interpretation of effect size and direction. The dependent variable was binary: [r-1] rhotic or [r-0] nonrhotic. The internal predictors in Table 3, as well as the social factors age and gender, were included as fixed effects, and speaker and word were included as random effects. In generating these models, we used Rbrul to conduct a step-up, step-down analysis in which individual factors are added and subtracted from each model to compare how much the inclusion of each factor improved the model's ability to predict the data observed. A step-up, step-down approach converges on the model featuring the best predictors of variation; thus, the models presented in this section include only significant predictors of (r). The results of the individual runs for NYCE and NOE (r) are found in the Appendix (Tables A1 and A2).
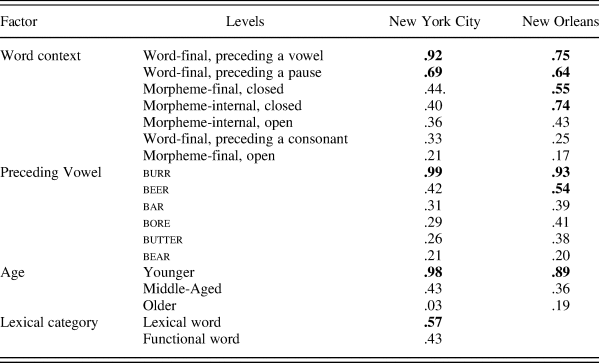
Table 4 presents a side-by-side comparison of the significant factor groups and factor weights for significant predictors in the final models for the NYCE and NOE (r) data. Factor weights are proportions from 0 to 1 that indicate the direction and extent of effect each independent variable has on the dependent variable. Values over .5 in Table 4, which indicate favoring of [r-1], are bolded. The data are ordered according to the NYCE data, with the factors most favoring rhoticity in NYCE listed first and those most disfavoring listed last. For NYCE, word context, preceding vowel, and word type (lexical vs. function word) were selected as linguistic factors impacting rhoticity, and age group was selected as a social factor impacting rhoticity. For NOE, these same factors were selected, save for one: word type was not a significant predictor of rhoticity. Word length and participant gender were not significant predictors of variation in either dataset.
Overall comparison of factor weights for (r) across NYCE (n = 8474) and NOE (n = 2855) models

Note: Bold indicates favoring of [r-1]. Full results are in Tables A1 and A2 (Appendix).
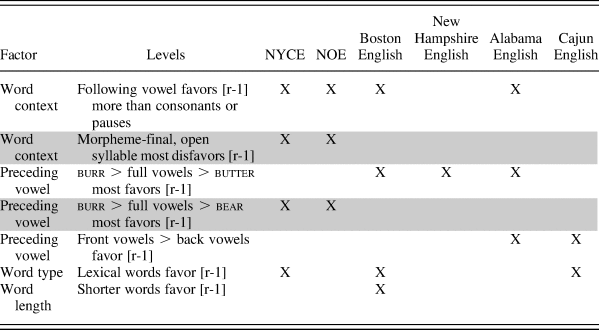
Rhoticity in both NYCE and NOE is most favored by word-final position preceding a vowel or pause (e.g., “I don't care about that” and “I don't care.”) and disfavored by morpheme-final, open syllables (e.g., “she is very careful”). In both (r) systems, stressed schwar (burr) favors rhotic pronunciations, while preceding /e/ (bear) disfavors them. And in both systems, younger speakers were much more likely to feature rhotic tokens than older speakers were. In NOE but not in NYCE, rhoticity was strongly favored in morpheme-internal closed syllables (e.g., “I'll give it a whirl”). In NYCE but not in NOE, lexical words (e.g., floor, party) slightly favored rhoticity over function words (e.g., there, her). Despite these differences, the two systems overall are remarkably similar, particularly when compared to other (r) varieties. Table 5 presents a comparison of the systems of NOE and NYCE across studies of rhoticity in North America,Footnote 4 focusing only on factors that Nagy and Irwin (Reference Nagy and Irwin2010) have identified as distinguishing constraints across varieties. Common factors between NYCE and NOE that are not found in other varieties in the table are shaded.
(r) systems across variably nonrhotic U.S. Englishes: Direction of effect

Note: Common factors between NYCE and NOE that are not found in other varieties are shaded.
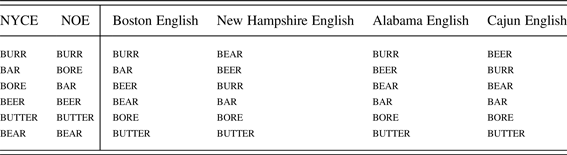
Table 6 focuses on vowel constraint ranking across these varieties—a factor that Nagy and Irwin (Reference Nagy and Irwin2010) specifically use to diagnose dialect similarity. Preceding vowels with the environments most favoring rhoticity are listed at the top and in decreasing order. Again, there are striking similarities between NYCE and NOE, with only the reversal in order of bar and bore distinguishing the preceding vowel constraints for these two varieties. Moreover, NYCE and NOE exhibit one notable distinction from other systems: both feature bear—not butter—as the environment that most disfavors rhoticity.
Vowel constraint ranking across variably nonrhotic U.S. Englishes

Thus, while there are a few differences in the ordering of levels across NYCE and NOE predictors, on the whole these systems highly resemble each other, especially when compared with other systems. One major difference between these systems, however, is the inclusion of lexical versus function words as a significant predictor for NYCE (r) but not NOE, making the NYCE system more complex than that of NOE. This pattern suggests diffusion of the NYCE system to NOE.
BOUGHT-RAISING
bought-raising is not as well documented in the sociolinguistics literature as (r) is, perhaps in part due to its more limited geographic distribution. bought-raising appears predominantly along the Mid-Atlantic seaboard—and in New Orleans (Labov, Reference Labov2007:365–366; Labov et al., Reference Labov, Ash and Boberg2006:233). bought-raising was first noticed in the speech of New Yorkers in the mid-20th century, either as an infrequent variant in Kurath's Linguistic Atlas data (Frank, Reference Frank1948; Wetmore, Reference Wetmore1959:28) or in the speech of college students (Hubbell, Reference Hubbell1950:82–83; Thomas, Reference Thomas1942, Reference Thomas1947). Labov ([1966] Reference Labov2006) followed up on these studies with a variationist analysis demonstrating that bought-raising was a change in progress from below, led by Jewish New Yorkers, women, and middle-class groups. That change has since reversed direction, with lowering led by young people, the middle classes, and white and Jewish speakers (Becker, Reference Becker2014b). Perceptual data from Becker (Reference Becker2014b) reveals an indexical field of social meanings for bought-raising in NYCE, centered on a “classic New Yorker” persona: an older, white ethnic New Yorker from the outer boroughs who is mean and aloof.
It is unclear when bought-raising emerged in NOE, but Reinecke (Reference Reinecke1951:117–127) noted its presence in the speech of schoolchildren in the 1950s, in higher rates than that of their parents. bought-raising was further documented in the 1970s by the Dictionary of Regional American English, with Rubrecht (Reference Rubrecht1971) citing instances of bought-raising in the Irish Channel neighborhood of New Orleans, a white, working-class area. In 2007, Labov examined a handful of NOE speakers from the Atlas of North American English, noting the distinctive bought realizations in this variety. Labov describes the pronunciations of several New Orleanians as comparable to the bought-raising of the Mid-Atlantic states, defined in the Atlas by the criterion: normalized and scaled F1 = <700 Hz (Labov et al., Reference Labov, Ash and Boberg2006:366). Recent research has demonstrated that bought is lowering in New Orleans and that some younger speakers are merging bought and bot (Carmichael, Reference Carmichael2014).
bought coding
We extracted formant values for over 900 tokens of bought from each sample (932 for NYCE data, average of 32 per speaker; 909 for NOE data, average of 16 per speaker). Tokens of bought preceding glides and liquids were excluded. The bought data was normalized using the Lobanov method, using the mean and standard deviation for each individual speaker. This made the data not only comparable between speakers, but between corpora. Ten tokens of beet, bit, bet, boot, boat, bot from each speaker were used to generate the mean and standard deviation within each speaker's vowel space.
Preceding and following sound are predictive of bought height (Becker, Reference Becker2014b:406; Wong & Hall-Lew, Reference Wong and Hall-Lew2014:33). We thus coded for these environmental factors, collapsing sound types into the categories presented in Table 7. We also coded for word length in terms of syllable count.
Internal factors for bought

a NOE corpus only.
bought-raising
To analyze the systems of bought-raising, linear mixed-effects regression models were generated for each corpus, with F1 at the 25% point as the dependent variable and speaker and word as random effects. We chose to use F1 at the 25% point as our point of measurement for analysis to avoid effects of diphthongization later in the vowel, which has been observed in NYCE but not in NOE. The results of linear mixed-effects regression models for bought in NYCE and in NOE are provided in the Appendix (Tables A3 and A4).
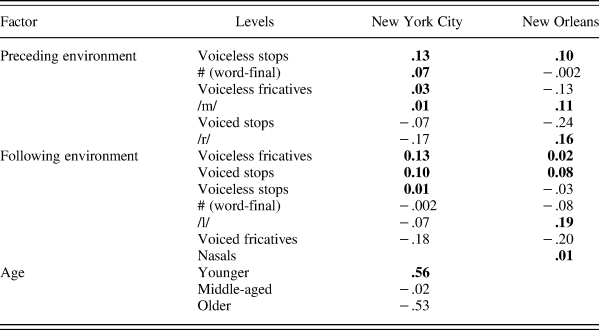
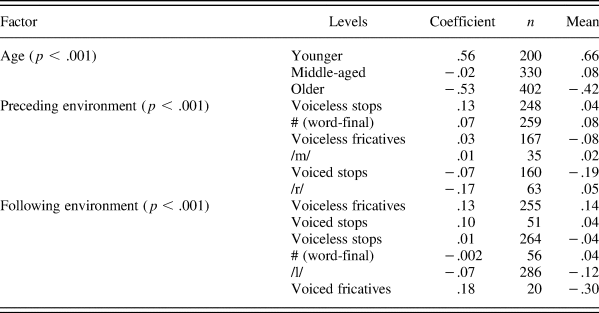
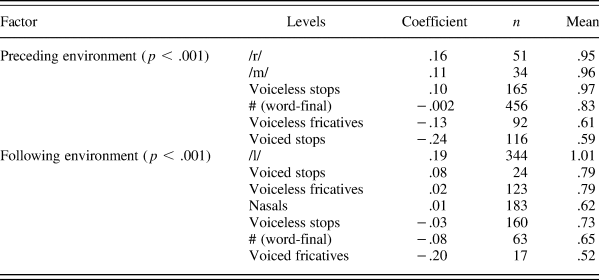
Table 8 presents a comparison across NYCE and NOE of the ordering of constraints within significant factors. Levels with positive coefficients, which correspond to more lowered boughts, are in bold. In NYCE and NOE, bought-raising is best predicted by preceding and following environment. Participant age group was predictive of bought height for NYCE speakers, but not NOE speakers.
Overall comparison of factor weights for bought across NYCE and NOE models

Note: Levels with positive coefficients are bolded. Full results are in Tables A3 and A4 (Appendix).
At a glance, the NOE-NYCE models for bought present superficially similar patterns to those presented for (r); across the two bought models, we see all the same predictors minus one. However, the difference in Table 8 consists of an unshared social factor, rather than an internal linguistic factor. Younger NYCE speakers featured significantly higher F1 means of bought than older speakers, demonstrating that bought-raising is on the decline in NYCE. Taking a closer look at the direction of effect across internal factors, preceding voiced stops (e.g., “dawn”) favor raising in both NYCE and NOE, while preceding /r/ (e.g., “raw”) favors raising in NYCE but disfavors raising in NOE. Preceding voiceless fricatives (e.g., “fall”) favor raising only in NOE. Following voiced fricatives (e.g., “cause”) favor raising in both NYCE and NOE. Following voiceless fricatives and voiced stops (e.g., “lost” and “dog”) disfavor raising in NYCE but not NOE, while following /l/ (e.g., “call”) disfavor raising in NOE but not NYCE. Thus, some environments feature similar effects; however, unlike in the case of (r), we do not see a clear shared pattern of which environments favor bought-raising.
Taken on its own, the comparison in Table 8 is not good evidence of a shared history between NYCE and NOE. Yet in the context of the results for (r), an explanation must be given to reconcile the conflicting perspectives. But first, we turn to a more sophisticated form of comparison for these two dialects, by quantifying the CRC.
QUANTIFYING THE CRC METHOD
Many scholars working with the CRC method have attempted to quantify the extent of similarity. We adopt the approach of Nagy and Irwin (Reference Nagy and Irwin2010:258), who use three lines of evidence to assess the relationship between New Hampshire and Boston for (r):
1. How many significant predictors are shared between the two varieties?
2. Within these shared significant predictors, how similar is the ranking of favoring and disfavoring environments?
3. How similar is the ordering of each predictor group selected for inclusion within the final model of variation?
The answers to these three questions were included in a single sum measure of similarity used to argue for transmission versus diffusion. We adopt this method to compare NYCE and NOE systems of (r) and bought. We include only internal (linguistic) factors and exclude social factors from consideration. Given that we are examining a case of diffusion with a significant time depth, it is expected that social predictors of variation are likely to change over time and adapt to the local circumstances (Baranowski, Reference Baranowski2007:82). Thus, the answer to question 1 is that for (r), two of three linguistic predictors are shared, and for bought, two of two are.
For question 2, Tables 4 and 8 presented an “eyeballed” version of ranking comparisons across the systems for (r) and bought. For a more precise measure, however, we examined the correlation of significant factors for both NYCE and NOE, presented in Table 9. Correlation coefficients range from −1 (perfectly inversely correlated; systems are mirror images) to 1 (perfectly correlated; essentially the exact same system). A 0 indicates systems not at all correlated. On the left, the correlation coefficients for significant (r) predictors are presented, while on the right those for bought are presented.
Correlations of factors for (r) and bought in NYCE and NOE

Table 9 shows that the ranking within the factors of word context and preceding vowel for (r) are highly positively correlated; the systems are very nearly identical. For bought, however, preceding sound is slightly negatively correlated while following sound is only somewhat correlated across the two systems. These numbers demonstrate what initial impressions suggested: while the ranking of factors for (r) systems were strikingly similar, those for bought-raising were not.
For question 3, we examined the ordering of the predictors within the models; that is, which significant predictors were most strongly predictive of each variable in each system? The models returned for both variables featured identical ordering of predictors, thus resulting in a correlation coefficient of 1.
Table 10 presents the results of these three lines of inquiry, and the final “sum” indicating the overall similarity between the systems in question across NYCE and NOE. Table 10 demonstrates that a quantified approach to the patterns for each variable reveals that the (r) systems for the two varieties resemble each other far more than bought systems. Next we discuss some interpretations of this finding and what it means for the relationship between NYCE and NOE.
Comparison of models for NYCE and NOE

DISCUSSION
The results for (r) and bought differ in terms of what they suggest about the relationship between NYCE and NOE. The CRC for (r) finds two very similar systems, both at the level of factor and in the ordering of levels. The one major difference between the two regression models is the additional constraint of word type on NYCE (r), which is not present in NOE. This is exactly the pattern expected for diffusion. In contrast, the ordering of constraints for bought does not look similar. Taking the two variables together, the evidence for a relationship between NYCE and NOE is mixed.
However, these results ought to be considered in tandem with findings from previous studies on the NYCE-NOE connection, namely Labov's (Reference Labov2007) examination of split short-a systems in NYCE and NOE and Berger's (Reference Berger and Dillard1980) examination of bird-diphthongization in NYC and the South. These four features—(r), bought-raising, split short-a system, and bird-diphthongization—have all attracted commentary as shared features between NYCE and NOE, and an assessment of all four together brings more clarity to the NYCE-NOE puzzle.
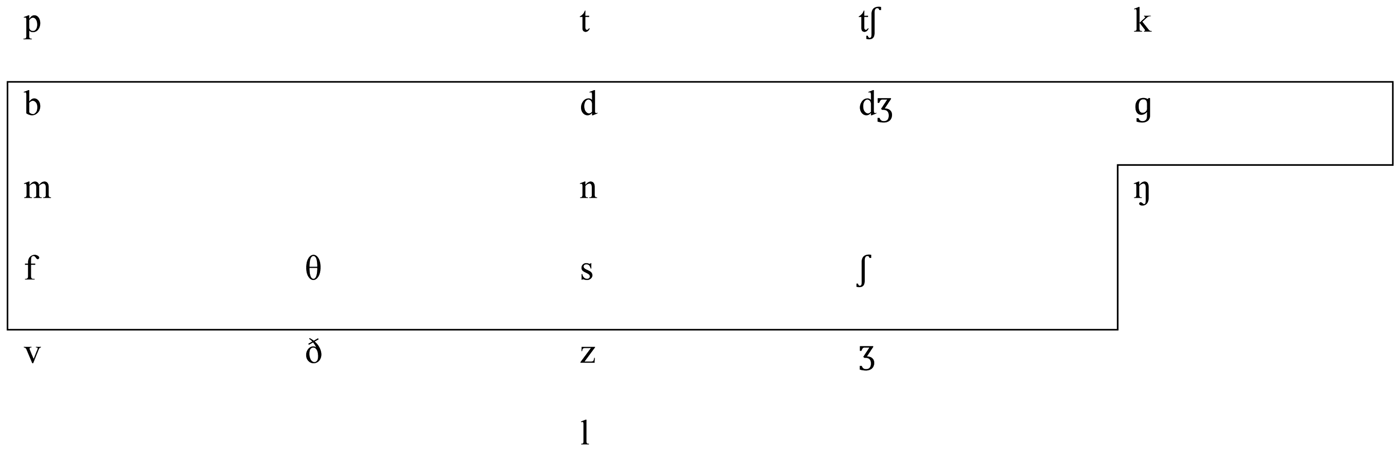
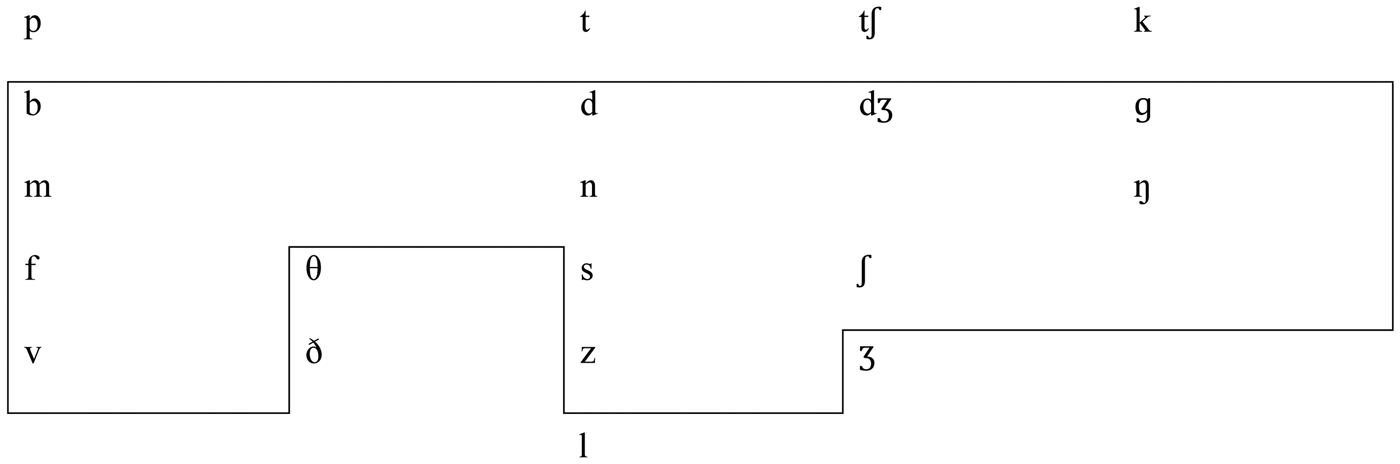
As introduced, Labov (Reference Labov2007) examined the constraints on short-a tensing within NYCE and several other dialects with a short-a split in order to characterize them as the linguistic consequences of diffusion, as opposed to normal dialect transmission. The phonetic environments that trigger tensing of /æ/ in NYCE and NOE are presented in Figures 1 and 2; as Labov noted, these systems are quite similar, and as Carmichael (Reference Carmichael2014:220) pointed out, where they differ appear to be low-frequency environments.
Tensing environments for NYCE short-a system (adapted from Labov, Reference Labov2007).

Tensing environments for NOE short-a system (adapted from Carmichael, Reference Carmichael2014).

In addition to phonological constraints, a number of structural conditions govern tensing in NYCE, for example, in the context of function words and open syllables (both of which block tensing). In Labov's account of the split short-a system diffusing to New Orleans, he noted the similar phonological constraints on tensing, accompanied by a loss of the constraint excluding function words (e.g., has, have, had) from tensing environments. He also noted that while the open syllable constraint was sometimes observed, there are suggestions that it is receding. Thus, in comparing the constraints on variation in short-a tensing, Labov found a similar pattern to what we describe for (r): strikingly similar systems, save for a slightly less structurally complex system in NOE compared to NYCE.
Berger's (Reference Berger and Dillard1980) analysis focused on the inception of bird-diphthongization in NYCE and attempted to pinpoint the source of this feature based on the historical record. This feature has been documented throughout the South, in locations ranging from South Carolina to Texas to Arkansas to regions of Louisiana outside of New Orleans (Strand et al., Reference Strand, Wroblewski and Good2010; Thomas, Reference Thomas2001; Underwood, Reference Underwood1982). Within NYCE, Berger noted that the earliest reference to bird-diphthongization is in an 1859 essay, and that mention of this feature is notably absent in several earlier linguistic descriptions of New York City speech. Berger concluded, on this basis, that this feature was not widely used in NYCE until the latter half of the nineteenth century, and he suggested that its presence in New York derived from intimate commercial ties with Southern port cities such as New Orleans and Charleston throughout the antebellum period (1820–1860). Though Berger provided little conclusive evidence to establish the direction of effect, his conclusions about the period of contact are crucial in the context of the conflicting (r) and bought results here. Of the four NYCE features—(r), short-a, bird-diphthongization, and bought-raising—only the first three are documented in the variety in the 19th century. As mentioned, bought-raising is noticeably absent from early descriptions of NYCE, suggesting it was at most emergent in the systems of speakers born in the late 19th century. This view of bought as a late arrival is bolstered by the analysis in Labov ([1966] Reference Labov2006), which presents bought-raising as a change from below that lagged behind the other variables with respect to New Yorkers’ subjective evaluations. Not until the last 50 years has bought-raising reached a level of salience in NYCE triggering a negative reaction, which motivated in part its abrupt reversal in apparent time and subsequent lowering (Becker, Reference Becker2014b). Evaluating the lack of similarity for the NYCE and NOE models for bought in this context, a likely explanation is that NYCE did diffuse features to NOE—a view supported by evidence from two core features—but during a period before a third core feature, bought-raising, had emerged in New York City.
However, this begs the question: if bought-raising in NOE did not come from NYCE, where did it come from? Recall that bought-raising is presented as an internal development, or change from below, in NYCE and the Mid-Atlantic region (Labov, [1966] Reference Labov2006; Labov et al., Reference Labov, Ash and Boberg2006). Labov ([1966] Reference Labov2006:236–237) even devoted considerable space to proposing a structural connection among bought-raising, (r), and split short-a in NYCE, with the suggestion that the presence of variable nonrhoticity may promote bad- and bought-raising. Labov ([1966] Reference Labov2006) argued that nonrhoticity introduces additional ingliding phonemes into the system for the mid and high vowels, and that bad and bought—both long, ingliding vowels as well—raise in parallel along the vowel periphery to merge with these vowels (bad with bear and beer in the front and bought with bore and boor in the backFootnote 5), in some cases collapsing to a single high phoneme in the front and at the back of the vowel space. This internally motivated argument connecting nonrhoticity and ingliding vowel raising could be applied to any locale with the same structural conditions, like NOE, where bought-raising could be the result of a similar move toward symmetry for ingliding vowels. We present this account with caution, however, because although these features appear to be structurally connected, there is no evidence that they are structurally implicated; that is, that given nonrhoticity, bad or bought should raise. Even in NYCE, where there is co-occurrence at the community level in NYCE, the systems of individuals are highly variable with respect to the co-occurrence of these features (Becker, Reference Becker2016). In addition, there are many examples where these features occur in some variety in the absence of the others; Philadelphia, for example, is rhotic but maintains a short-a split and bought-raising, while the South had variable nonrhoticity but no raised bought or bad.
Investigations of phonetic detail can add nuance to abstract phonological processes. The Atlas of North American English’s threshold for bought-raising is F1 < 700 Hz (normalized) (Labov et al., Reference Labov, Ash and Boberg2006), and on that basis NOE may be characterized as a site of raising (Labov, Reference Labov2007:366). Yet a comparison of the Atlas of North American English data on bought-raising in NOE and NYCE shows that NOE speakers are generally less raised than NYCE speakers, a pattern we note in our datasets as well. We would like to suggest that using a threshold for a gradient raising process may have caused NYCE and NOE to be lumped into a single category of bought-raising, when in fact these two varieties show quite different phonetic realizations in traditional speakers’ systems. We would not necessarily expect the phonetic realization of bought-raising to be identical in the two locales even in cases of diffusion, as surface realizations can change over time. Indeed, bought is undergoing sound change in both NYCE (Becker, Reference Becker2014b) and NOE (Carmichael, Reference Carmichael2014) in the direction of lowering. For these reasons, even a diffused raised bought could look different phonetically in each contemporary variety. We hope to illustrate, though, that a single category of bought-raising based on an F1 cutoff may suggest a connection where one does not exist.
Despite the fact that bought-raising may be an internal development in NOE, unrelated to the diffused features from NYCE like (r) and short-a, the centrality of all three features to popular conceptions of NYCE may shed light on why bought-raising would be packaged with the other variables in NOE—by locals and dialectologists alike. A concept that can help explain the perceptual interconnectedness of these features and their interpretation as “sounding like New York” within the context of NOE, is enregisterment—the process by which a dialect becomes a socially recognized register of forms (Agha, Reference Agha2003:231) and in some cases linked to places as the iconic way of expressing local authenticity (Johnstone, Reference Johnstone2009; Johnstone, Andrus, & Danielson, Reference Johnstone, Andrus and Danielson2006). NYCE is arguably enregistered well beyond the metropolis itself and is indeed one of the most recognizable and remarked upon regional varieties of American English (Hartley & Preston, Reference Hartley, Preston, Bex and Watts1999:232–236). Distinct social stereotypes are also connected to NYCE, which seem to be indexically linked to some of the most iconic linguistic features of this dialect, including bought-raising (Becker, Reference Becker2014b). Perhaps if NOE is ideologically “heard” as sounding like NYCE, NOE's bought-raising—although not identical to that used in NYCE—might similarly be interpreted as part of this enregistered variety. Further evidence for this view comes from commodified language representations in New Orleans, where T-shirts and mugs featuring local sayings have become increasingly common as a part of post-Katrina “nostalgia culture” (Carmichael & Dajko, Reference Carmichael and Dajko2016; Schoux Casey, Reference Schoux Casey2013). One shop in New Orleans sells a coffee setFootnote 6 with the labels “cawfee” (bought-raising) and “sugah” (nonrhoticity); while the set was originally sold in NYC and marketed as a “Brooklynese coffee set,” in this case it is presented without commentary alongside other New Orleans–themed goods. This ideological connection between NYCE and NOE could even provide insight into the contemporary movement away from bought-raising in NOE. If this feature is added into the “NOE-as-NYCE” package, then the stigma of NYCE can be made relevant to it, even if there is no actual historical connection. Indeed, Labov, Rosenfelder, and Fruehwald (Reference Labov, Rosenfelder and Fruehwald2013:59) argued that withdrawal is happening for Philadelphia features that are shared with NYCE, including bought-raising, because of the stigma attached to the latter variety.
CONCLUSIONS
This paper examines (r) and bought-raising in contemporary varieties of English spoken in New York City and New Orleans to explore the common assertion that these varieties share a connection. There are striking similarities for constraints on (r) in the two varieties, with a slight loss of complexity in NOE, suggesting diffusion of NYCE to NOE. In combination with Labov's (Reference Labov2007) examination of short-a, the results of the (r) analysis bolster the argument for diffusion. However, the analysis for bought does not reveal evidence of a shared history, suggesting that bought-raising in NOE may not be an NYCE feature. Instead, we argue that if diffusion of NYCE to NOE occurred, it happened in the 19th century, before bought-raising emerged in NYCE. This leaves open the question of how bought came to raise in NOE, though it may be an internal development.
A diffusion account requires evidence of significant migration of NYCE speakers to New Orleans during the proposed period of contact. As it stands, the historical record is not sufficient to support or refute the conclusion we draw from the CRC method. A detailed look at census data starting in 1850, when the provenance of individuals coming to New Orleans began to be noted, or even an exploration of old shipping records (as Brasseaux [Reference Brasseaux1990] did for French arrivals in New Orleans from 1820 to 1852) would shed important light on the presence of New Yorkers in New Orleans. However, even these approaches might miss the fact that there was a large seasonal population moving between the North and the South. Indications of this type of contact could be captured via an archival examination of newspaper records looking for the New York presence in New Orleans, though the extent of influence of transients is an open question. At this time, there is simply not enough evidence from the historical record to convincingly demonstrate the necessary conditions for diffusion.
Similarly, we lack the diachronic linguistic evidence, either acoustic or textual, to confirm this account. The dialectological record offers limited information, whether it is the dearth of recordings prior to the 20th century or the texts that leave much room for interpretation and little room for a deeper analysis of the constraints on these features.
In the absence of solid sociohistorical or diachronic linguistic evidence, in this paper we utilize the tools of synchronic variationist analysis. The evidence from CRC for (r), particularly in combination with Labov's earlier work, makes a compelling case for diffusion of NYCE to NOE. The lack of similarities across the two systems for bought, though they at first blush seem to invalidate a diffusion account, may in fact further bolster the contention that this diffusion was a 19th-century phenomenon. Taken together, the data offer one explanation for how New Orleans became known as the Brooklyn of the South.
APPENDIX
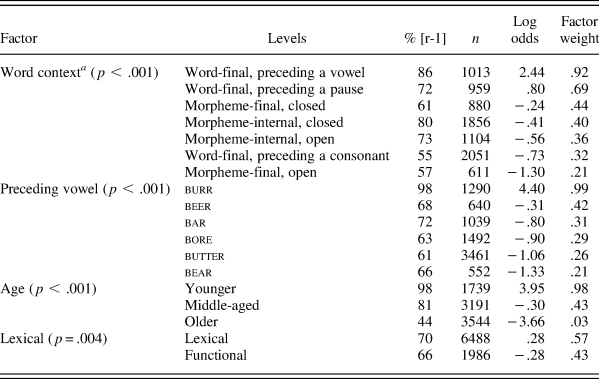
NYCE (r) model: Factors predicting [r-1]
Deviance: 4986.591df = 17
Intercept: 3.59 Grand mean: .691
Random effects of speaker (SD = 1.7474) and word (SD = 1.1)

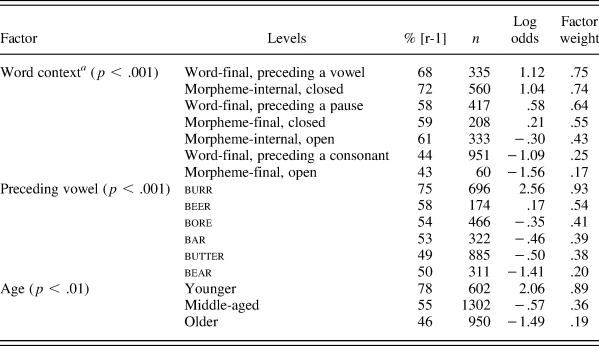
NOE (r) model: Factors predicting [r-1]
Deviance: 2085.453 df = 16
Intercept: 1.414 Grand mean: 573
Random effects of speaker (SD = 2.79) and word (SD = 1.272)

NYCE bought model: Factors predicting F1 at the 25% point
Deviance: 136.198 df = 15
Intercept: −40.527 Grand mean: −.011
Random effects of speaker (SD = .194) and word (SD = .086)

NOE bought model: Factors predicting F1 at the 25% point as the dependent variable
Deviance: 1386.132 df = 15
Intercept: .79 Grand mean: .813
Random effects of speaker (SD = .171) and word (SD = .114)