1. Introduction
A vast empirical literature has sought to establish a robust relationship between economic development and environmental quality. Grossman and Krueger (Reference Grossman and Krueger1995) and Selden and Song (Reference Selden and Song1994) documented an inverted U-shaped curve between income and pollution that is similar to Kuznets's (Reference Kuznets1955) inverted U-shaped relationship between income and inequality. In subsequent research, a large number of authors failed to confirm an ‘environmental Kuznets curve’ (EKC), either in the original Grossman and Krueger dataset, or in updated and expanded pollution datasets (e.g., Harbaugh et al., Reference Harbaugh, Levinson and Wilson2002, or Deacon and Norman, Reference Deacon and Norman2006). The conflicting empirical results have given rise to intense efforts to further explore the income/pollution relationship either by introducing formal models (see, e.g., Antweiler et al., Reference Antweiler, Copeland and Taylor2001), or by adding further control variables to reduced-form regressions (see Dasgupta et al., Reference Dasgupta, Laplante, Wang and Wheeler2002 for a survey).
The EKC is thus a case study of extreme model uncertainty where the true model is unknown and several competing approaches exist that hypothesize about the exact relationship between environmental quality and income. In light of such model uncertainty, inference procedures based on a single regression model overstate the precision of coefficient estimates. Precision is overestimated because the uncertainty surrounding the validity of a theory has not been taken into account (Raftery, Reference Raftery1995). The problem is particularly prevalent in the EKC literature since a number of well-founded approaches exist and researchers face an abundance of possible candidate regressors.
The Bayesian solution to model uncertainty is to base inferences on all competing models, each weighted by the posterior probability that the model is indeed the true model. The procedure delivers a posterior distribution for each candidate regressor, whose mean is a weighted estimate derived from all relevant models. In environmental economics, prominent examples of BMA applications include the modeling of population determinants for deer (Farnsworth et al., Reference Farnsworth, Hoeting, Hobbs and Miller2006), fish (Fernandez et al., Reference Fernández, Ley and Steel2002) as well as pollution mortality (Koop and Tole, Reference Koop and Tole2006). To our knowledge, we are the first to apply Bayesian model averaging to resolve the model uncertainty surrounding the EKC relationship.
Our strategy is to group EKC approaches into two categories. First we examine reduced-form approaches to the EKC, where many possible determinants of pollution are introduced. This branch of the literature is vast, but suffers from the criticism that the direct and indirect effects of variables cannot be disentangled. The approach therefore cannot identify intervening factors that lead to an apparent relationship between income and pollution. As an alternative, we examine specific theories that have been proposed as the underlying determinants of an EKC, and scrutinize whether the data support theory-based candidate regressors.Footnote 1 In this case, we have a clearly predetermined set of regressors that are expected to affect pollution concentrations.
Before we summarize our results, it is important to note that the updated SO2 data that have been extended and cleaned of previous errors no longer exhibit the EKC relationship that Grossman and Krueger (Reference Grossman and Krueger1995) discovered (see, e.g., Harbaugh et al., Reference Harbaugh, Levinson and Wilson2002). Our results below can therefore be seen as an effort to find robust evidence for an EKC in this dataset by eliminating possible omitted variable bias. We find only limited evidence for an income/pollution relationship once we account for model uncertainty. Instead, robustly related regressors in both reduced-form and theory-based approaches are those relating to political economy, site-specific effects, and trade (the individual proxies for each category are motivated in sections 3 and 4). Societies that are more open in terms of political participation are shown to exhibit significantly lower air pollution. The theory-based approach highlights the power of both direct and indirect effects (where indirect refers to interactions where one variable moderates the effect of another variable). Following Antweiler et al. (Reference Antweiler, Copeland and Taylor2001), we show that the interaction between trade and capital intensity is also of crucial importance for explaining the evolution of SO2 concentrations across countries and time.
The number of regressors that are robustly related to pollution in the BMA approach, as well as in the best model identified by BMA, is only a fraction of the 17 possible candidate regressors motivated by reduced-form approaches. Compared to our selection of theory-based specifications, BMA finds as few as a third of the 18 regressors suggested by the most comprehensive theory-based specification. Nevertheless, the best model suggested by BMA has an adjusted R 2 three times greater than the preferred theory-based specification of Antweiler et al. (Reference Antweiler, Copeland and Taylor2001).Footnote 2 This provides evidence that such a complex theory may not be necessary and alternative theories, such as the Green Solow model (see Brock and Taylor, Reference Brock, Taylor, Aghion and Durlauf2005), should not be discarded simply because they rely on only a fraction of the regressors.
2. Searching for an EKC in SO2 concentrations
2.1 Data considerations
One prominent EKC relationship in the literature relates air quality to economic development.Footnote 3 In this paper we focus on sulphur dioxide (SO2) concentrations obtained from the Global Environmental Monitoring System (GEMS). The data are updated, error-corrected, and maintained by the EPA in its Aerometric Information Retrieval System (AIRS).Footnote 4 The GEMS/AIRS data are perhaps the most widely used dataset to investigate the EKC, with reported SO2 concentrations from stations in up to 44 countries from 1971 to 2006.Footnote 5
Our income measure is real GDP per capita in constant 1996 dollars from the Penn World Tables 6.1 (Heston et al., Reference Heston, Summers and Aten2002). In our estimation of the Antweiler et al. (Reference Antweiler, Copeland and Taylor2001) approach we use their income measure (GNP). There are several reasons to use concentrations data, although emissions data are also widely available. First, ground-level sulphur dioxide concentrations are the relevant criterion for the direct environmental/health impact. Second, cross-country emissions data are generated by emissions models and not based on actual SO2 measurements. Cross-country emissions data are generated using strict input–output coefficients based on energy and manufacturing models.Footnote 6 In that sense these data perfectly track the production characteristics of an economy, but not necessarily the actual factors that affect environmental quality. Third, the majority of SO2 EKC papers use concentrations and we seek to be comparable with our results.
The SO2 concentrations data are, however, highly unbalanced in two dimensions: location and time. Few countries report data over the entire time period, and many countries report pollution concentrations for less than a decade. Often several years of data are missing between observations not only on the station level, but also on the city and country levels. Even in countries with extensive locational coverage, such as the United States, the time series for each monitoring station is highly unbalanced. When heavily oversampled countries have lower average pollution, or have added new monitoring stations with lower pollution over time, it is important to examine the robustness of the results at different levels of data aggregation.Footnote 7 Juxtaposing different levels of aggregation as well as reduced-form and structural results also provides a unique opportunity to examine the robustness of regressors across all specifications.
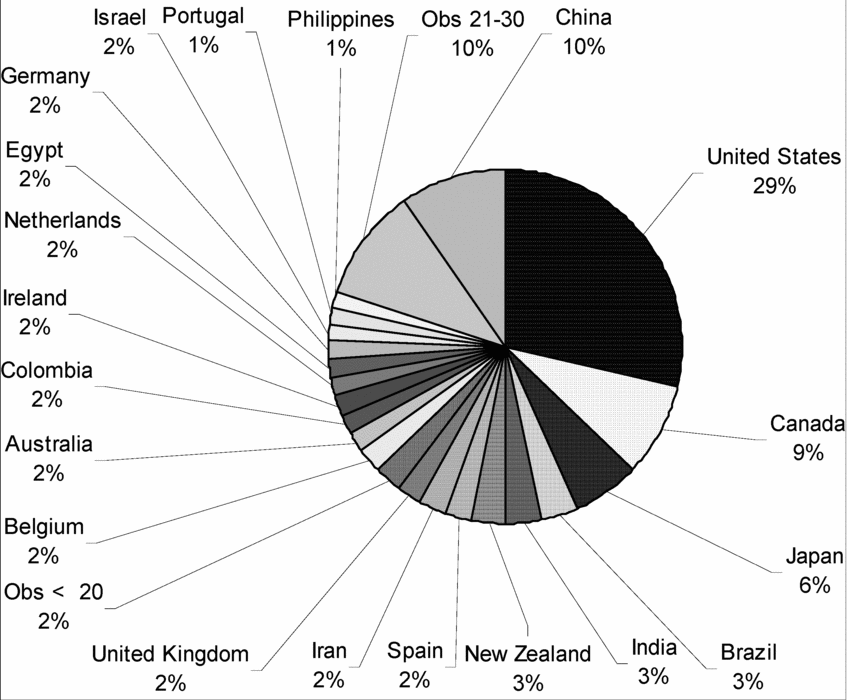
A significant number of papers in the literature have documented an EKC (or its absence) without explicitly discussing the fact that the dataset is so extremely unbalanced. The data are unbalanced in terms of location since a few countries are represented with a large number of reporting stations, while many other nations are featured only once. A full 38 per cent of the original 2,555 station-level observations originate in the US and Canada. The imbalance is exacerbated early and late in the sample as the US supplies 69 per cent of the data before 1974 and after 1993. Therefore, we restrict our analysis to 1974–1993, which reduces the dataset by 219 observations (almost exclusively from the US). Figure 1 provides a breakdown of the 2,168 observations by country of origin.
Distribution of SO2/observations in GEMS/AIRS data 1974–1993
Notes: Obs < 20 refers to a number of countries that feature less than 20 observations (Greece, Italy, Thailand, Venezuela, Malaysia, Indonesia, South Korea, Peru, Pakistan). Obs 21–30 refers to countries with between 21 to 30 observations (Argentina, Finland, Sweden, Chile, France, Denmark).
Source: US–EPA maintained GEMS/AIRS dataset http://www.epa.gov/airs/aexec.html

The construction of the appropriate station-level covariates is also problematic. None of the covariates suggested by the literature actually speaks to specific characteristics at the station level. At best one can correlate city-level characteristics (such as temperature and precipitation variation) with observed concentrations. However, even the city-level data are still highly unbalanced, and it is unclear whether results are driven by information in the data or by oversampling and missing information across time. In that sense, aggregating to the country level is our preferred approach; it suffers, however, from the disadvantage that few of the controls actually speak to the characteristics of the area in which the concentrations are measured. For these reasons we test for an EKC at the station, city, and country levels.
2.2 The EKC in the raw income pollution data
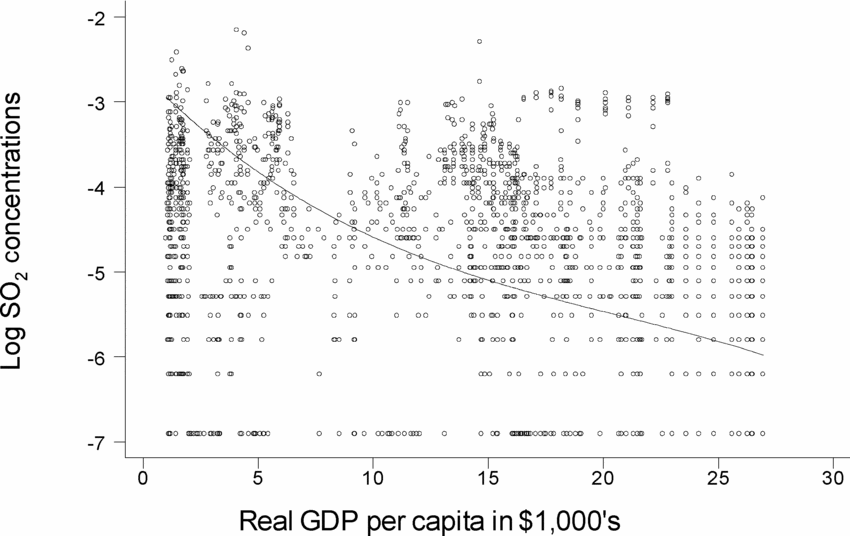
The first surprise for researchers using the newest version of GEMS, which has been purged of errors and extended to include updated data, is that it no longer provides evidence for the fundamental EKC relationship. Figure 2 plots the raw data for every station in every year that an observation is recorded. In addition, the figure traces the predicted values from the most fundamental regression that includes only log median SO2 concentrations as the dependent variable and real GDP per capita as a third-order polynomial.Footnote 8 In Grossman and Krueger (Reference Grossman and Krueger1995), a similar plot using earlier data from the same source was prominently inverted-U shaped.
Relationship between median SO2 concentrations and income (by measuring station 1974–1993)
Note: Fitted values are for the
fixed-effects regression 
Source: US–EPA maintained GEMS/AIRS dataset http://www.epa.gov/airs/aexec.html
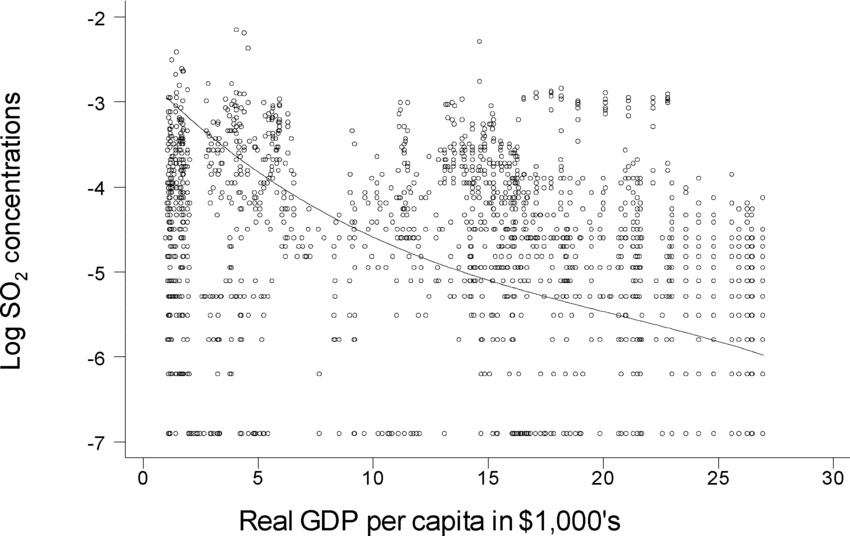
Instead of an EKC, the updated GEMS data in figure 2 show a simple relationship between development and environmental quality that has SO2 concentrations gradually declining with income. The lack of an EKC in the raw SO2 data has previously been noticed (on the country level) by astute researchers who suggested that the global data mask country-level phenomena. Deacon and Norman (Reference Deacon and Norman2006) provide evidence for 23 countries that the country-level experience may in fact look very different from the original global station-level data. Since technology, factor abundance and the political response to interest groups are also national concepts, we aggregate the data in search of an EKC at the individual country level. Plotting country-level SO2 concentrations over time confirms Deacon and Norman's (Reference Deacon and Norman2006) result that most countries' SO2 concentrations do not follow an EKC path.Footnote 9
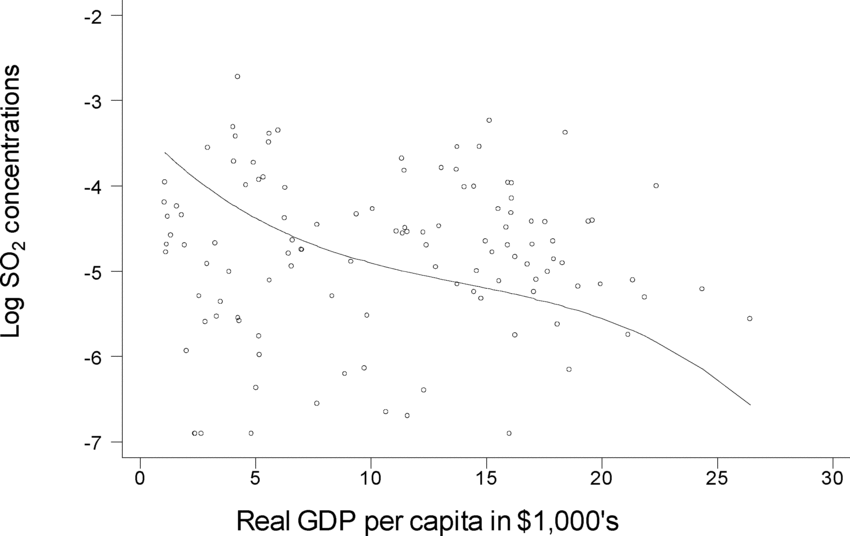
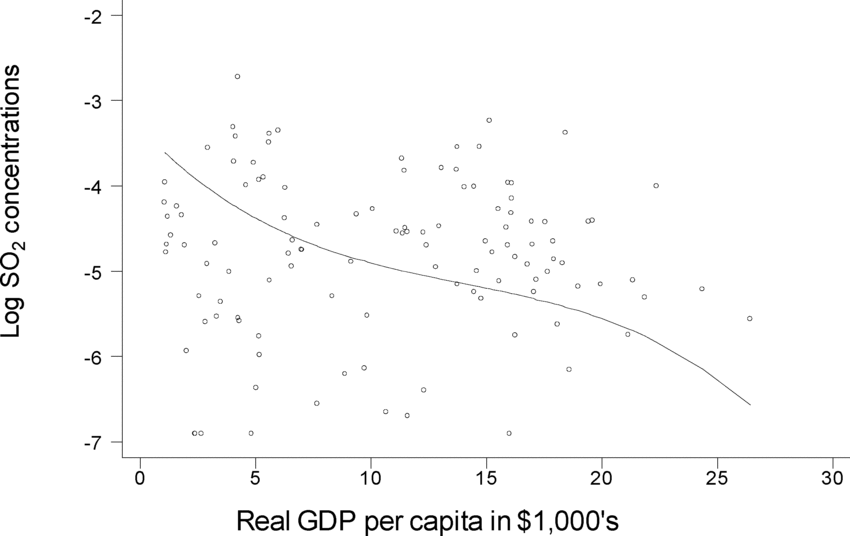
The lack of an EKC at the station or individual country level might also be an artifact of the extremely unbalanced time dimensions of the dataset. To balance the sample intertemporally, we follow Selden and Song (Reference Selden and Song1994) and take five-year averages.Footnote 10 In the averaged dataset, the US prominence is reduced to 24 per cent of the observations at the station level.Footnote 11 Therefore, averaging helps address our oversampling concerns, and in the country-level data the entire locational imbalance that leads to oversampling concerns is eliminated. Averaging across time and aggregating by country does not resolve the mystery of the missing EKC in the raw data, however. Plotting station-level data and predicted values obtained by the same method as in figure 2, the country-level data in figure 3 maintain the negative relationship between pollution and income.
Relationship between median SO2 concentrations and income (five-year averages 1974–1993)
Note: Five-year averages of log median SO2 concentrations, aggregated from the station to the country level.
Source: US–EPA maintained GEMS/AIRS dataset http://www.epa.gov/airs/aexec.html
3. Model uncertainty in the income/environment relationship
Two simple explanations can address the absence of an EKC in the raw data presented in figures 2 and 3. Either the relationship does not exist, or the model is misspecified. By neglecting to include crucial covariates, the misspecification due to omitted variable bias may overwhelm the power of the GDP regressors. Perhaps in an effort to explore the latter line of reasoning, a number of papers in the literature feature a remarkably diverse range of different model specifications to uncover evidence in favor of an EKC.
Below, we first focus on the most prominent reduced-form approaches that commonly include variables to sharpen the EKC model specification such as international trade, capital intensity, precipitation variation, temperature, population density, investment, education, and institutions. These diverse approaches represent the level of model uncertainty that surrounds the EKC relationship. Standard robustness analysis would juxtapose various models and select on the basis of P-value. As Miller (Reference Miller1984, Reference Miller1990) points out, the difficulty is that a P-value based on a model selected from a larger set of possibilities no longer carries the same interpretation as when only two models are considered (the null and the alternative). Also, several models may seem reasonable given the data but lead to different conclusions. This can happen especially in cases when the dataset is large (for striking examples see Kass and Raftery, Reference Kass and Raftery1995; Raftery, Reference Raftery1996). The Bayesian approach to model selection and accounting for model uncertainty overcomes these difficulties. The next subsection provides a brief overview of BMA and identifies how the procedure addresses EKC model uncertainty.
3.1 Addressing model uncertainty in the income/environment relationship
When inferences are based on one model alone, the ambiguity involved in model selection dilutes information about effect sizes and predictions since ‘part of the evidence is spent to specify the model’ (Leamer, Reference Leamer1978: 91). Model averaging was first operationalized by Leamer (Reference Leamer1983) in so-called ‘extreme bound analysis’ (EBA). EBA has two limitations. First, in the absence of an efficient search, EBA arbitrarily restricts the set of candidate regressors (and hence the model space).Footnote 12 EBA it is not anchored in foundations of statistical theory and in practical applications it has been shown to be biased towards selecting too few ‘effective’ regressors (see Sala-i-Martin, Reference Sala-i-Martin1997; Sala-i-Martin et al., Reference Sala-i-Martin, Doppelhoffer and Miller2004).
BMA inference is based on an unrestricted search of the model space spanned by all candidate regressors. BMA also requires that each model is weighed according to its quality. This quality weight is given by the posterior model probability, which is interpreted as the probability that any given model is the true model. Extreme bound analysis weighs models equally and thus attributes equal power of inference to exceptionally weak or strong models. Sala-i-Martin (Reference Sala-i-Martin1997) does introduce an ad hoc weighting scheme to BMA; his results highlight the sensitivity of EBA to the weights, and therefore the need to derive such weights using actual statistical theory. Hjort and Claeskens (Reference Hjort and Claeskens2003) point out that for good reasons BMA ‘dominates the literature on accounting for model uncertainty in statistical inference’. Raftery and Zheng (Reference Raftery and Zheng2003) summarize the main theoretical results proving that BMA: (a) minimizes the total error rate (the sum of type I and type II error probabilities); (b) produces point estimates and predictions that minimize mean squared error (MSE); and (c) yields predictive distributions that have optimal predictive performance relative to other approaches. The authors also outline the differences between Bayesian model averaging and frequentist model averaging, as well as the conceptual problems involved in frequentist model averaging.
It is therefore not surprising that averaging over all models can be analytically proven to provide better average predictive performance than any given regression, any single selected model (using selection procedures such as stepwise regression), or any subset of models (Madigan and Raftery, Reference Madigan and Raftery1994). Eicher et al. (Reference Eicher, Papageorgiou and Raftery2007a) provide concrete examples of this phenomenon using growth and simulated data and show not only that BMA attains the theory-predicted superior inference, but also that the quality of models discovered by alternative methods, such as the ‘general-to-specific’ (GETS) procedure (suggested by Hendry and Krolzig, Reference Hendry and Krolzig2001) is far inferior to BMA's.
The basic model averaging idea originated with Jeffreys (Reference Jeffreys1961) and Leamer (Reference Leamer1978), whose insights were developed and operationalized by Draper (Reference Draper1995) and Raftery (Reference Raftery1995). BMA was first introduced to economics by Fernandez et al. (Reference Fernández, Ley and Steel2001), with an application to economic growth. Here we restrict ourselves to sketching the basic BMA structure before we discuss the results (for an extensive discussion of BMA see Hoeting et al., Reference Hoeting, Madigan, Raftery and Volinsky1999).
The basic variable selection setup can be concisely summarized as follows. Given a dependent variable, Y (SO2 concentrations), a number of observations, n, and a set of candidate regressors, X 1, X 2,. . ., X k , the variable selection problem is to find the ‘best’ model

where X 1, X 2, . . ., X p is a subset of X 1, X 2, . . ., X k , and βj is a vector of regression coefficients to be estimated. Let M = {M 1, . . ., M k denote the set of all models considered, and let θk ~ (β k , σ2) be a vector of parameters in Mk. The likelihood function of model Mk, pr (D|θ k , M k ), given the data, D, then summarizes all information about θk that is provided by the data.
For any likelihood function consisting of two or more parameters, we can define the integrated likelihood as the probability of the data given model Mk. The integrated likelihood of model Mk, pr(D|M k ), is the likelihood function times the prior density, pr(θ k |M k ), integrated over the parametersFootnote 13

The integrated likelihood is the crucial ingredient in deriving the appropriate model weight used in the model averaging process. Given the prior probability that Mk is the true model, pr(Mk), the posterior probability of a model, pr(M k ), is defined as the model's share in the total posterior mass

Equation (3) thus represents the individual model's weight in the averaging process. Posterior model probabilities are also the weights used to establish posterior means and variances, which have been derived by Raftery (Reference Raftery, Bollen and Long1993)


where  is the OLS estimate for Mk,
 . Hoeting (Reference Hoeting1994) derives the full expression for the definitive posterior
distribution. Hence, the posterior means and variances are simply the first and
second moments of each individual model, weighted by the model's
‘quality’, as given by its posterior probability. BMA thus
incorporates model uncertainty into the posterior distribution such that the
variance of the weighted model average is greater than the variance for any
single model as long as there is disagreement across models. Intuitively, the
different models are used to describe different parts of the data, rather than
to pretend that a single model can describe all the data. An individual model
does not account for the uncertainty about the model actually being the true
model, and hence parameter estimates' variances overstate the
confidence in the estimate.Footnote
14
In addition to the posterior means and standard deviations, BMA provides the
posterior inclusion probability of a
candidate regressor,  , by summing the posterior model probabilities across those
models that include the regressor. Posterior inclusion probabilities provide a
probability statement regarding the importance of a regressor that directly
addresses researchers' prime concern: what is the probability that
the coefficient has a non-zero effect on the dependent variable.Footnote
15
4. Motivating EKC candidate regressors
Before we can employ BMA, each candidate regressor must be motivated to justify its inclusion alongside GDP measures, since each regressor can only be included if it corresponds to a well-established theory or line of research. As mentioned in the introduction, a regressor may be motivated by several theories. Numerous covariates have been introduced in the past to explain sulphur dioxide concentrations in reduced-form specifications. These regressors can be grouped into five different categories: (1) site-specific controls, (2) political economy proxies, (3) production structure, (4) trade measures, and (5) technology proxies. Note that references to our selection of theory-based approaches are limited in this paper to single equation specifications. We ruled out theory-based approaches based on energy demand decomposition that underlie the emissions literature (see Ang, Reference Ang and van den Bergh1999, and Hoekstra and Van den Bergh, Reference Hoekstra and Van den Bergh2002 for reasons explained in our discussion on emissions data above). However, the distinctions between separate effects suggested by theory (e.g., scale, technology, trade) can also be explored using a system of equations that explores the dynamics interaction and transition of the variables (see, e.g., Stern, Reference Stern2005; Constantini and Martini, Reference Constantini and Martini2007). The limitation of BMA is the single equation approach. Reduced-form approaches constitute the vast majority of EKC papers (Stern, Reference Stern2004); they cannot, however, identify the true effect of regressors, be it direct or indirect. This requires fully specified models.
Since concentrations are reported at the station level, a compelling argument can be made that any analysis of the income–pollution relationship must include regressors that control for site-specific factors (e.g., temperature and precipitation variation). Such regional differences affect nature's ability to cleanse SO2 from the atmosphere. While variables such as temperature and precipitation variation are unlikely to be correlated with our economic variables, their inclusion is standard in the literature and meant to improve the accuracy of the estimates. Our site-specific controls for temperature and rainfall are obtained from Antweiler et al. (Reference Antweiler, Copeland and Taylor2001).Footnote 16
Aside from station characteristics, we must also control for effects that are common-to-world but nevertheless time varying. Such components reflect secular changes in global awareness of environmental problems, innovations, diffusion of technology and the evolution of world prices. We follow the standard practice in the literature and assume that these common components are captured by a linear time trend. In addition, we add a dummy for nations that signed the 1985 Helsinki Protocol, which aimed to reduce sulphur dioxide emissions by at least 30 per cent.
Income alone does not create direct pressure to improve environmental outcomes, but the democratic fabric of a society that allows political participation and threatens consequences for polluting dictators has been found to be an important determinant. The past literature introduced variables that indicate when more open and democratic societies have different attitudes towards the environment. The conjecture is that for a given level of income, more open societies experience less pollution.Footnote 17 Torras and Boyce (Reference Torras and Boyce1998) posit that richer individuals gain ‘power’ to demand better overall environmental quality. Likewise, Barrett and Graddy (Reference Barrett and Graddy2000) propose that wealthier citizens demand an increase in the non-material aspects of their standard of living. The degree to which policy responds to such desires is closely linked to the ability of individuals to assemble, organize and voice their concerns. In the same vain, Panatayotou (Reference Panayotou1997) provides evidence that strong property rights ‘flatten’ the EKC by generating less pollution for any given income level. Some authors employ the Freedom House indices to measure political rights (e.g., Shafik and Bandyopadhyay, Reference Shafik and Bandyopadhyay1992; Torras and Boyce, Reference Torras and Boyce1998; Barrett and Graddy, Reference Barrett and Graddy2000), while others use Knack and Keefer's (Reference Knack and Keefer1995) ‘Respect/Enforcement of Contracts’ (Panayotou, Reference Panayotou1997). Harbaugh et al. (Reference Harbaugh, Levinson and Wilson2002) use an index of democratization from the Jaggers and Gurr (Reference Jaggers and Gurr1995) Polity III dataset. Alternatively, Leitão (Reference Leitão2006) introduces measures of corruption.
The institutions and growth literature has since established the Polity IV ‘Constraint on Executive’ (Marshall and Jaggers, Reference Marshall and Jaggers2003) as the best measure to capture the above-mentioned effects. Acemoglu et al. (Reference Acemoglu, Johnson and Robinson2001) have shown convincingly that the degree of constraint on the executive is a fundamental determinant of all political rights. We thus choose this measure as our political rights proxy. Antweiler et al. (Reference Antweiler, Copeland and Taylor2001) include a site-specific dummy for Communist regimes, which is interacted with per capita income as a political proxy. We leave it to BMA to identify whether executive constraints or the Communist regimes dummy proxies most effectively for political economy effects.
Since a key hypothesis is that political pressure builds as richer agents demand greater environmental quality, education is also seen as a major factor in the pollution/development relationship. Torras and Boyce (Reference Torras and Boyce1998) include adult literacy rates, noting that literacy allows for greater informational access and a more even distribution of power within society. Our measure of education is years of education from Barro and Lee (Reference Barro and Lee2000). Years of education should be a better proxy for access to information since basic literacy implies only knowledge of rudimentary reading and writing skills. We use average years of education over the prior three years to account for the fact that it takes some time to translate educational achievement into environmental activism.Footnote 18
International trade has also been associated with the EKC relationship. Arrow et al. (Reference Arrow, Bolin, Costanza, Dasgupta, Folke, Holling, Jansson, Levin, Mäler, Perrings and Pimentel1995) and Stern et al. (Reference Stern, Common and Barbier1996) mention that an EKC might be partly due to trade and the resulting global distribution of polluting industries. The authors hypothesize that free trade allows developing countries to specialize in goods that are intensive in their relatively abundant factors: labor and natural resources. Developed countries, in turn, are likely to specialize in human capital and capital intensive goods. In contrast, Shafik and Bandyopadhyay (Reference Shafik and Bandyopadhyay1992) point out that trade might exert two contrasting influences on developing countries. Following Antweiler et al. (Reference Antweiler, Copeland and Taylor2001), we use trade volume (exports plus imports) as a per cent of GDP as our measure of openness to trade. Aside from the above-mentioned trade effect, increased openness may lead to increased competition, which could cause more investment in efficient and cleaner technologies to meet the environmental standards of developed nations. More directly, investment can be motivated with reference to embodied technology, where cleaner technologies are embodied in more recent vintages of capital. To control for such an effect, we follow Harbaugh et al. (Reference Harbaugh, Levinson and Wilson2002) and include not only trade, but also a measure of investment in our analysis. Alternatively, trade-induced dynamic comparative advantage has also been tied to the composition of output that is associated with different stages of development. We use the human-capital-adjusted capital intensity proxy from Antweiler et al. (Reference Antweiler, Copeland and Taylor2001) to account for such effects.
Another important covariate often included in the literature is population density (Grossman and Krueger, Reference Grossman and Krueger1995; Panayotou, Reference Panayotou1997; Barrett and Graddy, Reference Barrett and Graddy2000; Antweiler et al., Reference Antweiler, Copeland and Taylor2001; Harbaugh et al., Reference Harbaugh, Levinson and Wilson2002). Panayotou argues that population density may have an ambiguous effect since more dense areas can expect greater use of coal and non-commercial fuels, but densely populated countries may also be more concerned about lowering pollution concentrations. We follow Harbaugh and include national population density in order to have a relatively accurate time-series measure of population density for both developed and developing countries.
Second-generation EKC models include variables motivated by fully specified models that yield precise, testable EKC implications and relationships. The essential features of EKC models include determinants of scale, composition, and technique effects outlined by Panayotou (Reference Panayotou1997). Prominent theoretical precursors that have led to the state of the art, fully specified, open-economy EKC model in Antweiler et al. (Reference Antweiler, Copeland and Taylor2001) are Stokey (Reference Stokey1998) (endogenous abatement), Bovenberg and Smulders (Reference Bovenberg and Smulders1995) and Aghion and Howitt (Reference Aghion and Howitt1998) (endogenous growth/technique), and Jones and Manuelli (Reference Jones and Manuelli2001) (endogenous policy). Development causes a positive scale effect since increased output per unit of capital leads to increased pollution. To account for the scale effect we follow Antweiler et al. (Reference Antweiler, Copeland and Taylor2001) and employ a measure of city-level economic intensity (national GDP per capita times city population density). It is generally held that in rapidly growing middle-income countries pollution due to the scale effect might be the dominant EKC force (Perman and Stern, Reference Perman and Stern2003).
The technique effect diminishes the scale effect as technological progress permits a lowering of emissions per unit of output, which presumably would also impact SO2 concentrations. Lagged per capita income is used to proxy for the technique effect since countries with higher incomes in the past should be able to afford better technology today (see Antweiler et al., Reference Antweiler, Copeland and Taylor2001). Diffusion of technology itself motivates the idea that time-related effects reduce environmental impacts in countries at all levels of development (Aghion and Howitt, Reference Aghion and Howitt1998; Perman and Stern, Reference Perman and Stern2003).Footnote 19 These effects are usually proxied with a year dummy.
To isolate either the scale or technique effect, we must control for changes in the composition of output. A change in output composition can mitigate the scale effect further if the share of less pollution-intensive industries rises as income increases. This occurs when development and human capital accumulation generate shifts toward cleaner industries (services or information technology) so that the ensuing change in the composition of output reduces environmental degradation (Panayotou, Reference Panayotou1993). A specific model was first presented by Copeland and Taylor (Reference Copeland and Taylor2003), who showed that the reliance on capital accumulation in early stages of development, as opposed to human capital accumulation in later stages, can generate an EKC. Following Antweiler et al. (Reference Antweiler, Copeland and Taylor2001), we capture the composition effect by controlling for differences in the human-capital-adjusted capital–labor ratio. In the absence of such controls, the relationship between pollution and income is a mixture of scale, composition, and technique effects, which is hard to interpret.
In addition to a simple income/output-induced composition effect, Antweiler et al. (Reference Antweiler, Copeland and Taylor2001) also account for a trade-induced composition effect. While the reduced-form literature takes the effect of trade as ambiguous, Antweiler et al. (Reference Antweiler, Copeland and Taylor2001) stipulate that a trade-induced composition effect depends on a country's comparative advantage, which in turn is determined by income per capita and capital abundance. Antweiler et al. (Reference Antweiler, Copeland and Taylor2001) suggest interacting the trade measure with determinants of comparative advantage (the capital–labor ratio and income per capita). Since comparative advantage is a relative concept, these variables are measured relative to their corresponding world averages. Since theory cannot identify a turning point (the endowment levels where trade causes a switch from exporting to importing pollution-intensive products), we adopt the flexible approach of Antweiler et al. (Reference Antweiler, Copeland and Taylor2001) by estimating interactions with different functional forms.
Note that theory does not necessarily imply such an elaborate structure. Brock and Taylor (Reference Brock, Taylor, Aghion and Durlauf2005) point out that the EKC is compatible with many different theories. The simplest of all is perhaps the ‘Green Solow model’ where pollution policy remains unchanged throughout the development process and where transitional dynamics alone suffice to generate an EKC. The Green Solow model exhibits no composition effects, no changes in pollution abatement, no evolution of the political process, and no international trade. BMA is a natural statistical tool to examine the support that competing theories receive from the data, and to address the model uncertainty in the literature.
5. Empirical results
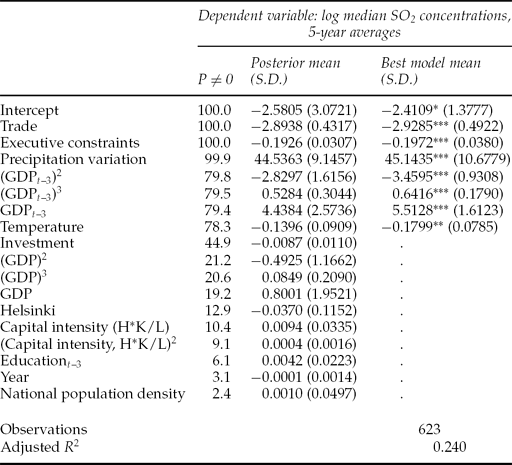
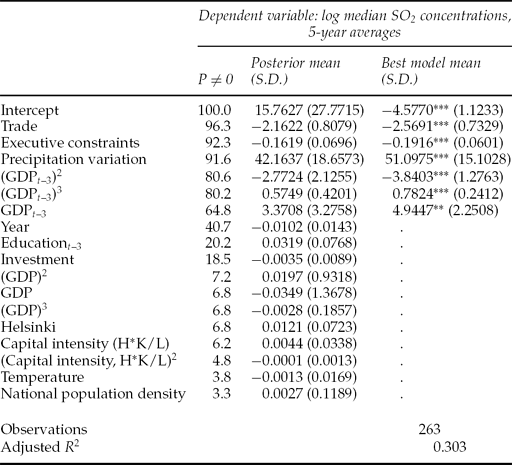
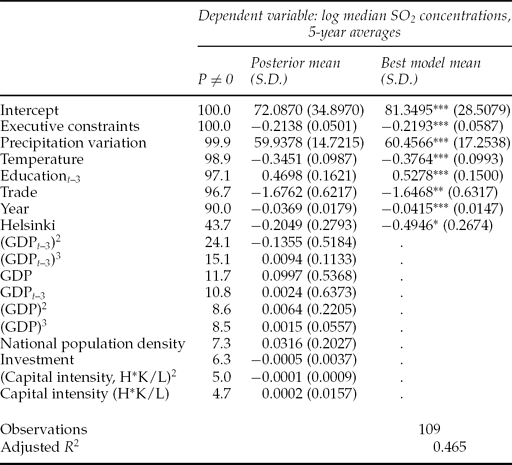
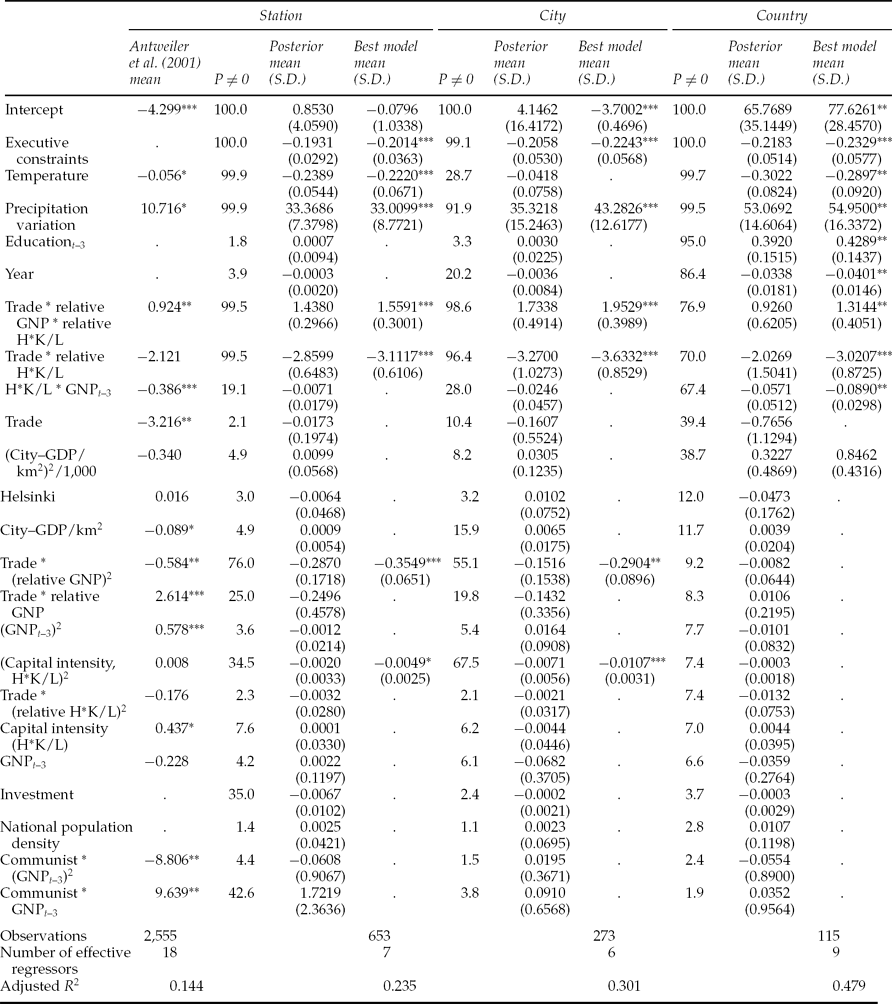
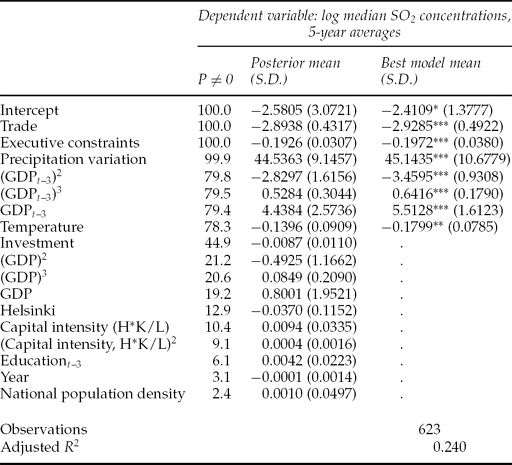
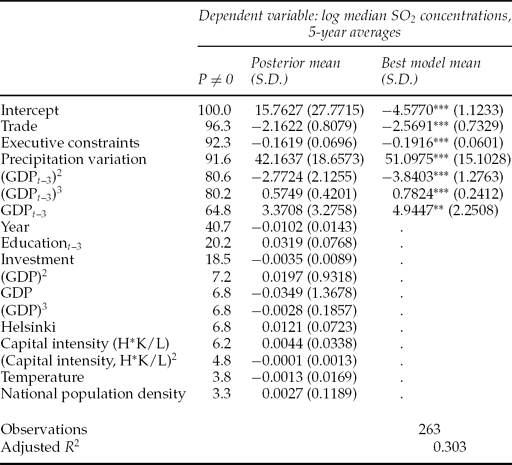
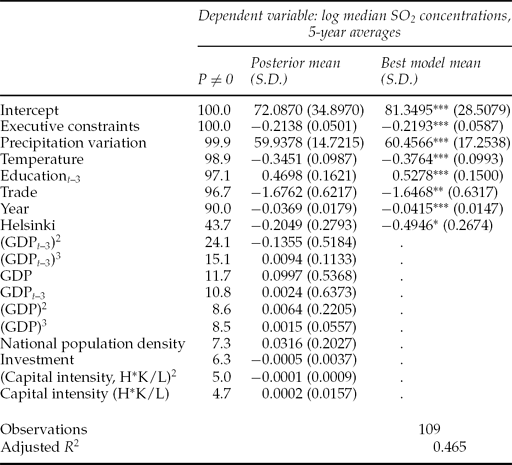
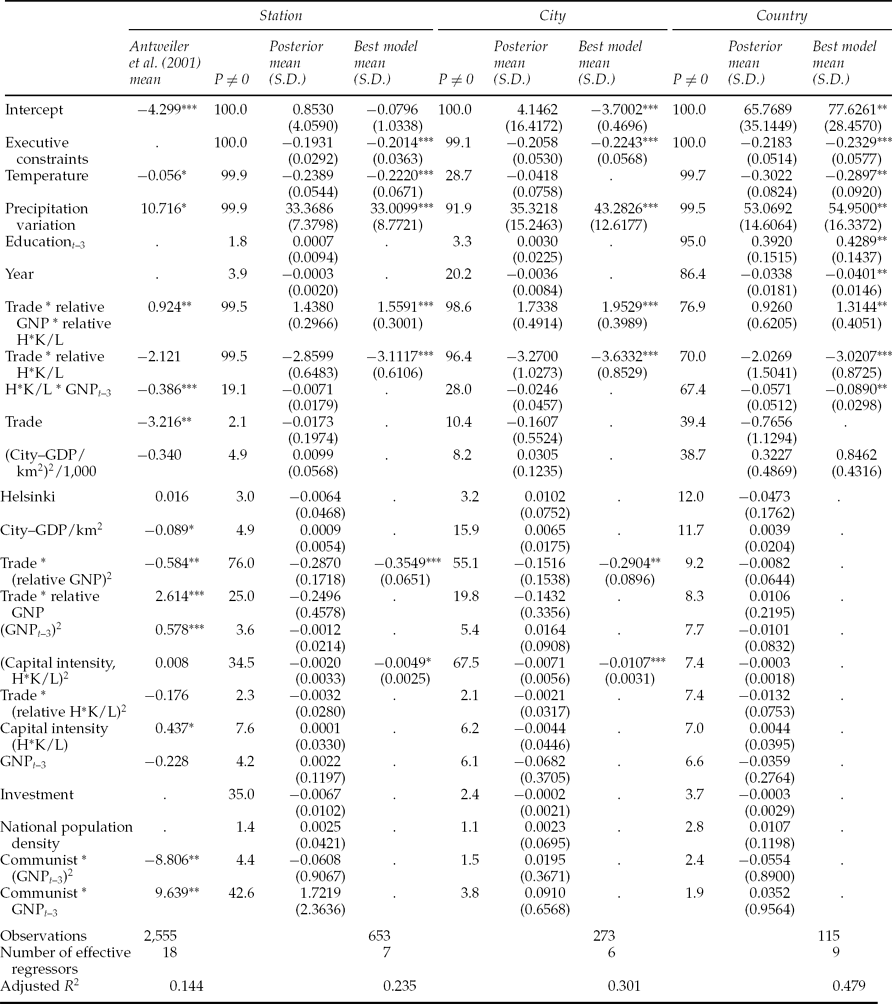
Tables 1–3 report the reduced-form results, while table 4 reports the results for our candidate regressors that were motivated by our selection of theory-based approaches. The main results are robust to specifications of GDP in logs, different GDP lag structures (zero-, three-, and ten-year lags), alternative ‘U-curve’ specifications such as Anand and Kanbur's (Reference Anand and Kanbur1993) specifications based on inverse GDP, and specifications based on concentrations per capita. The tables report results at the station, city, and country levels.
Reduced-form BMA results (by station)
Notes: P ≠ 0 is the posterior inclusion probability that a regressor's posterior mean is different from zero. *, **, ***, indicate 90, 95, 99 per cent confidence levels.
Reduced-form BMA results (by city)
Notes: P ≠ 0 is the posterior inclusion probability that a regressor's posterior mean is different from zero. *, **, ***, indicate 90, 95, 99 per cent confidence levels.
Reduced-form BMA results (by country)
Notes: P ≠ 0 is the posterior inclusion probability that a regressor's posterior mean is different from zero. *, **, ***, indicate 90, 95, 99 per cent confidence levels.
Structural BMA results
Notes: P ≠ 0 is the posterior inclusion probability that a regressor's posterior mean is different from zero. *, **, ***, indicate 95, 99, 99.9 per cent confidence levels. Antweiler et al. (Reference Antweiler, Copeland and Taylor2001) do not report standard errors.
The first columns of tables 1–3 report the posterior inclusion probability (the probability that the coefficient estimate is different from zero). P ≠ 0 is thus a measure of confidence that a regressor enters with a non-zero coefficient into the true regression model. The posterior inclusion probability is a scale-free probability measure of the relative importance of variables; it can therefore be transparently applied to inform policy decisions, in addition to the posterior mean and standard deviation. Jeffreys (Reference Jeffreys1961) and Raftery (Reference Raftery1995) add the interpretational refinement that P ≠ 0 > 50 per cent indicates that the data provide weak evidence that a regressor is included in the true model; P ≠ 0 > 75 per cent implies positive evidence; P ≠ 0 > 95 per cent provides strong evidence; and P ≠ 0 > 99 per cent gives very strong evidence. Inclusion probabilities close to 100 per cent signal that a particular regressor is included in almost all good models so that it contributes prominently to explaining the dependent variable, even in the presence of significant model uncertainty.
We find only limited support for income as a key driver of SO2 concentrations. Only the highly unbalanced station- and city-level datasets in tables 1 and 2 report positive evidence of an EKC relationship between income and SO2 concentrations. At the station level, lagged GDP has a much higher inclusion probability than current GDP, implying that contemporaneous economic activity is less important in determining SO2 concentrations than the indirect effects of rising income over time. Nevertheless, fundamental variables, not income, are the crucial determinants of pollution levels. Precipitation variation and executive constraints both exhibit 100 per cent inclusion probabilities, while the income polynomials range around 80 per cent. We find that less variation in precipitation, increased temperature and greater executive constraints reduce SO2 concentrations. The only economic variable that registers as significant in the reduced-form station-level results is trade intensity. Here the evidence is decisive that trade reduces pollution.
The best single regression model selected by BMA at the station level has an adjusted R 2 of 0.240, and contains seven variables that exhibit at least weak evidence in terms of inclusion probabilities. The city-level results in table 2 are nearly identical to those at the station level, except that the previously weakly significant temperature variable is no longer relevant. Although the best model at the city level is based on fewer regressors and observations (both would lead one to expect a worse fit), its adjusted R 2 increases to 0.303. The improvement in explanatory power may result from the fact that the aggregated dataset is less prone to oversampling.
A major change in the results occurs when we aggregate the data to the country level. Table 3 no longer provides evidence that income has an influence on pollution. Nevertheless, all other variables that have been shown to be robustly related to pollution remain strongly significant and their posterior means are surprisingly stable. Executive constraints, trade, and local weather variations are central to explaining the country-level pollution variability. Interestingly, at the country level, education and technology (proxied by the year variable) now have high inclusion probabilities, providing strong evidence that these candidate regressors belong in the true model. As we aggregate from the station to the city and finally to the country level, the adjusted R 2 of the best model systematically increases (although the number of observations drops from 623 to 109). While the adjusted R 2 is only 0.240 for the best model with station-level data, it nearly doubles to 0.465 at the country level.
The results for the regressors motivated by the theory-based approach of Antweiler et al. (Reference Antweiler, Copeland and Taylor2001) are presented in table 4. Antweiler et al. (Reference Antweiler, Copeland and Taylor2001) use station-level results as a benchmark, since their specification is the most extensive, theory-based empirical implementation of the EKC hypothesis. Alternative levels of aggregation (and hence different degrees of oversampling) generate remarkably stable outcomes in terms of posterior inclusion probabilities and posterior means. BMA identifies between six (station- and city-level) and eight (country-level) candidate regressors with weak to decisive evidence of a non-zero impact on pollution. Common across all levels of aggregation is that there exists no evidence of an EKC. Instead, the prominence of site-specific and political economy variables carries over from our structural results at all levels of aggregation. There is strong and decisive evidence that non-economic factors, such as temperature, precipitation variation, and executive constraints, affect SO2 concentrations in the same fashion as in the reduced-form BMA tables 1–3.
Of all the variables that receive positive evidence in table 4 at the station level, only executive constraints does not appear in the theory-specified Antweiler et al. (Reference Antweiler, Copeland and Taylor2001) model (they include the ‘Communist’ variable to capture political economy effects). Executive constraints thus remains highly significant not only in the reduced-form, but also in the structural analysis. This provides strong support for the Jones and Manuelli (Reference Jones and Manuelli2001) approach to pollution that emphasizes the political process, not income, as the driving force in the development/pollution relationship.
BMA produces a number of surprises. The major difference between the reduced-form specifications and the Antweiler theory-based results is that the trade intensity effect is lost entirely. While it does register as significant in Antweiler et al. (Reference Antweiler, Copeland and Taylor2001), BMA provides no evidence that trade intensity alone carries any explanatory power at the station, city, or country level. Nevertheless, the BMA results do suggest that trade plays an important indirect role in determining pollution since it is revealed that trade moderates the composition effect. Antweiler et al. (Reference Antweiler, Copeland and Taylor2001) find that trade dampens the pure EKC effect as the trade/income interactions in their regression are highly significant. In the BMA approach, in contrast, this income effect is found only at the station and city levels, and only in non-linear form. In the less unbalanced country-level dataset, BMA indicates that trade's main role is to moderate the composition effect. The interaction between trade and capital intensity shows that the composition effect has a different impact on countries depending on their level of development. The greater the level of development – as proxied by the human-capital-augmented capital–labor ratio – the lower the implied concentrations for open economies.
The second trade-related variable that receives support in BMA at all levels of aggregation is the interaction between trade, income, and capital intensity. The positive estimate throughout provides strong evidence that more human/physical-capital-intensive countries have higher sulphur dioxide concentrations, even after we control for trade and income effects. This is because the three-way interaction between trade, income, and the human-capital-adjusted capital–labor ratio has a positive posterior mean. The relatively large role of the composition effect and the trade-based interactions suggests that countries do not follow a deterministic income–pollution path.
BMA does not uncover strong evidence for a pure composition effect, since capital intensity alone cannot be shown to affect pollution (in contrast to Antweiler et al., Reference Antweiler, Copeland and Taylor2001). In addition, since city-GDP/km2 is not significant at any level of aggregation, BMA provides no evidence for a scale effect (the scale effect is only mildly significant in Antweiler et al.'s Reference Antweiler, Copeland and Taylor2001 work). Oversampling does influence the strength of the technique effect (proxied by year), as BMA provides evidence that a technique effect reduces pollution at the country level. A similar pattern is observed in our reduced-form analysis, where the same variable gains explanatory power only at higher levels of aggregation. These findings are in line with Stern (Reference Stern2002) who finds evidence for the important role of negative time effects in explaining declining SO2 concentrations.
Perhaps the most important result is that the best model chosen by BMA contains less than half of the 23 candidate regressors that have been motivated by the literature. At the station level, seven significant regressors account for about one-and-a-half times more variation in the dependent variable (adjusted R 2 = 0.235) than the 18 regressors (12 significant) suggested by the Antweiler et al. (Reference Antweiler, Copeland and Taylor2001) specification (adjusted R 2 = 0.144). This suggests that a number of regressors identified by Antweiler et al. (Reference Antweiler, Copeland and Taylor2001) may be significant only because the empirical strategy did not account for model uncertainty. The BMA estimates at different levels of aggregation are surprisingly stable, however, and their adjusted R 2 increases steadily from the station to the city to the country level, from 0.235 to 0.301 to 0.479, respectively (although the sample size declines). Also, the relevant regressors at the city and station levels are just about identical, although the country-level results do feature two additional regressors to explain pollution (year and education). The coefficient on education is counterintuitive just as in the reduced-form BMA results. It is supposed to proxy for the hypothesis that better-educated citizens demand better environmental quality. However, measures of education have been shown to be fragile in both growth regressions and in development accounting (see Krueger and Lindahl, Reference Krueger and Lindahl2001). Perhaps the same issues contaminate the effect of the regressors here.
6. Conclusion
This paper reexamines the evidence for an environmental Kuznets curve using the updated GEMS/AIRS data on SO2 concentrations. The literature on the income–pollution relationship is characterized by unusual model uncertainty as both the number of proposed theories and the range of possible candidate regressors is large. We apply a theoretically founded method to address model uncertainty. Bayesian model averaging examines all models, weighs them by their relative quality, and then generates the probability that a candidate regressor is related to the dependent variable.
Our results are presented at three levels of aggregation. The station-level results are subject to severe oversampling as pollution from thousands of observations from local stations are linked to one and the same measure of income in a country. Hence we also aggregate the data to the city and country level. The results are remarkably robust. Political economy and site-specific variables explain a large share of the observed pollution. International trade is also shown to be robustly related to pollution. In our reduced-form analysis, trade is found to lower pollution. When the model is specified using full-fledged theories (Antweiler et al., Reference Antweiler, Copeland and Taylor2001), we show that trade has no direct effect, but that it moderates the composition effect. We provide evidence that as countries become richer and increase their physical and human capital, trade leads to cleaner environments. It unfortunately also implies that poor, labor-intensive, open economies experience increasing pollution levels.
Overall, we find only weak evidence for an EKC, which disappears when we address oversampling of the data or move to a fully specified theory-based approach. There may be several reasons the EKC fails to hold up in our work. The foremost, perhaps, is that many countries in the GEMS/AIRS data may already be on the flat or downward-sloping portion of the EKC during the sample period. Smulders et al. (Reference Smulders, Bretschger and Egli2005) label these portions of the EKC the ‘alarm phase’ and the ‘cleaning-up phase’ that indicate a government response to public concerns. Given that the reduction in sulphur dioxide concentrations may also be based on governments reacting to their citizens' demands, it is not surprising that we find that policy variables such as executive constraints play a crucial role in determining pollution levels.
Appendix
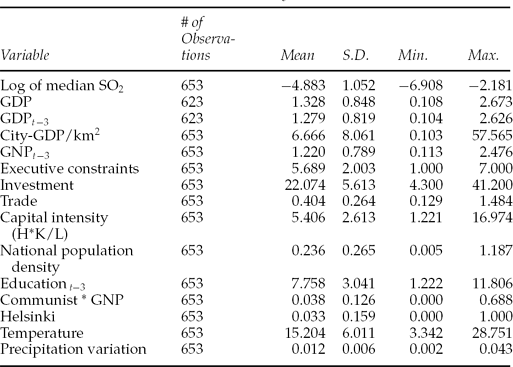
Summary statistics
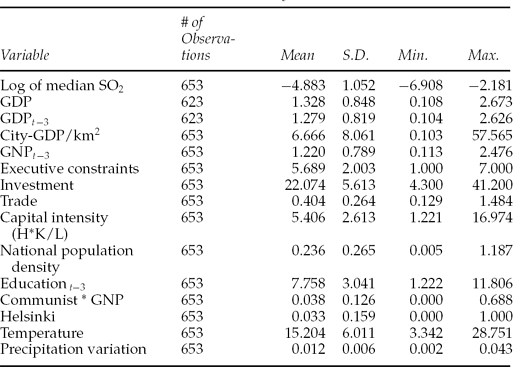
Note: The ‘t–3’ subscript refers to an average of the past three years' data.
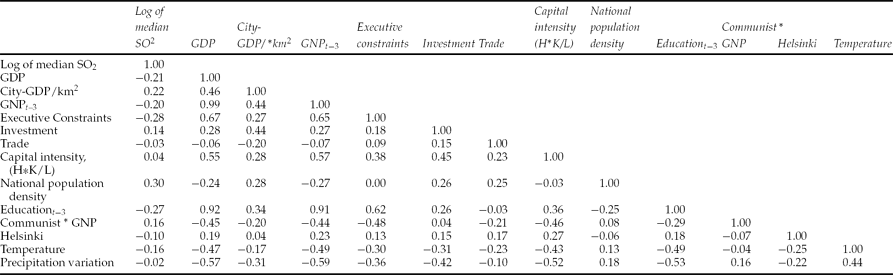
Correlations