1. Introduction
Remotely operated vehicles (ROVs) are used to perform a wide range of tasks in the ocean, such as oil and gas extraction, oceanography, mapping, salvage operations, and military operations [Reference Hosseini1]. The dynamic equations of ROVs are highly nonlinear, coupled, time-varying, and contain uncertainties in hydrodynamic coefficients. Therefore, a controller should be designed to stabilize the robot while it is executing its trajectory.
The trajectory tracking of ROVs has been the focus of extensive research in numerous research groups, where the control system is a major factor. Various controllers have been used for trajectory tracking of ROVs, including PID control, robust control, adaptive control, fuzzy control, neural networks (NNs), and sliding mode controller (SMC) [Reference Hosseini and Seyedtabaii2]. The SMC is the most effective algorithm for controlling trajectory tracking in moving vehicles [Reference Hosseinabadi, Abadi, Mekhilef and Pota3].
A feature of the SMC is robustness: from any given initial condition in the state space, it quickly directs the behavior of the closed-loop system to a sliding surface. However, some challenges of this controller include a long convergence time, a rigid design, the need for high computational power, and the chattering phenomenon caused by the “sign” function in the control signal [Reference Ventura and Fridman4, Reference Levant5]. The chattering phenomenon is hazardous to physical systems due to its high-frequency oscillations [Reference Javed, Liu, Nie and Sun6]. There are several strategies to cope with these problems, such as using super-twisting integral sliding mode control [Reference Manzanilla, Ibarra, Salazar, Zamora, Lozano and Muñoz7]. The continuity and robustness of these controllers attenuate the chattering effect and ensure the system converges to the origin of the sliding variable and its derivative within a finite amount of time [Reference Manzanilla, Ibarra, Salazar, Zamora, Lozano and Muñoz7]. In [Reference Sverdrup-Thygeson, Kelasidi, Pettersen and Gravdahl8], a linear proportional-derivative controller was used for trajectory tracking of an underwater ROV along the reference path. In ref. [Reference Shojaei and Chatraei9] is proposed as a controller to help a platoon of autonomous underwater vehicles (AUVs) maintain a convoy-like formation along feasible trajectories while avoiding collisions between vehicles. This controller uses a prescribed performance function to constrain the relative distance and angles between successive pairs, as well as a robust NN, hyperbolic tangent function, and dynamic surface control technique to ensure robustness against unknown parameters, nonlinearities, and environmental disturbances. In ref. [Reference Liang, Fu, Gao and Cao10], a finite-time velocity-observed-based adaptive output-feedback trajectory tracking formation control is proposed for underactuated unmanned underwater vehicles (UUVs). The control scheme is designed to consider input saturation, unmeasured velocity, external disturbance, and prescribed performance. In ref. [Reference Xu, Wang and Qiao11], the use of a combination of back-stepping and SMC was investigated for the trajectory tracking of a 3-degree-of-freedom (DOF) UUV. In ref. [Reference Karkoub, Wu and Hwang12], a hierarchical robust nonlinear (HRN) controller was applied to perform trajectory tracking of an AUV in the presence of uncertainties. The HRN controller combines back-stepping and SMC techniques, with a hierarchical structure based on the kinematic and dynamic models of the AUV. In ref. [Reference Long, Qin, Bian and Hu13], a tracking control method for an ROV was proposed based on an extended state-based Kalman filter (ESKF)-based MPC controller. The ESKF is used to estimate ROV states and external disturbance to increase the tracking accuracy in the presence of external disturbance and measurement noises. In this method, the external disturbance and measuring noises add to the state prediction and output prediction processes of ESKF-based MPC, respectively, which allows external disturbance and measuring errors to affect the controller. In ref. [Reference Qiao and Zhang14], two nonsingular terminal SMC frameworks were utilized to achieve improved trajectory tracking for an AUV. This control structure was demonstrated to enhance tracking accuracy and robustness even in the presence of uncertainties and external disturbances. In ref. [Reference Huang and Yang15], the nonlinear disturbance observer (NDO)-based super-twisting double-loop sliding mode control method was proposed to address path-flowing control of 4-DOF ROVs with system uncertainties and external disturbances. The nonlinear observer was used to estimate the system uncertainties and external disturbances, while a double-loop sliding mode control was employed to improve the convergence rate and reduce chattering. In ref. [Reference Li, Yu, Zhang, Liu and Lian16], a fuzzy adaptive trajectory tracking control strategy is used for ROV considering thruster dynamics and external disturbances. The outer-loop position and orientation controller is based on a fuzzy adaptive algorithm, which is used to estimate system parameters and disturbances. The inner-loop hydraulic controller utilizes a NDO to reduce uncertainties and disturbances. In ref. [Reference Manzanilla, Ibarra, Salazar, Zamora, Lozano and Muñoz7], a robust combination control algorithm based on the integral SMC technique with the super-twisting controller is designed to track 3D trajectories of a 4-DOF UUV. The main idea of the current work is to propose a controller for the ROV path following a task based on a super-twisting algorithm (STA). A continuous controller is used to attenuate the chattering effect on the control variable. However, this proposed tracking method does not take into consideration external disturbances, measurement errors, actuator dynamics, and nonlinearity, which could lead to poor tracking accuracy.
In this paper, we propose a model-free, high-order sliding mode control (HSMC) for trajectory tracking in the presence of disturbances, measurement errors, and actuator dynamic and nonlinearity for a 6-DOF ROV. The Lyapunov stability theorem is employed to guarantee the asymptotic stability of tracking errors. We compare the proposed algorithm to traditional ROV trajectory tracking control algorithms, and the main contributions of this work are:
-
1. Unlike most previous trajectory tracking controllers for ROVs, this paper considers the thruster dynamics with nonlinear effects (saturation, dead time) in the proposed controller. First, the thruster models are identified and then used in the closed-loop control of the ROV.
-
2. Due to the inertial sensors’ error (accelerometer and gyroscope), the positioning system’s output in ROV is always accompanied by cumulative error and increases with time. This research presents an integrated positioning system with auxiliary sensors. A linear Kalman filter is proposed to estimate the error of sensor and navigation calculation errors. And then, this estimation error is used as feedback to correct the positioning system output.
-
3. As a new work, the controller design for the trajectory tracking control of an underwater vehicle was done simultaneously in the presence of disturbance, measurement errors, and actuator dynamics.
-
4. The proposed controller’s performance was investigated using hardware-in-the-loop (HIL) testing, which simulated real-time ROV trajectory tracking control in the presence of actual ROV thrusters. The proposed controller, HSMC, will be compared to the outcomes of using a conventional PID controller and the STA controller, in order to demonstrate its superiority. The comparative simulation experiments show HSMC controller increases the convergence rate of the system and reduced the chattering of the control signal.
This study is organized as follows. The dynamic of the robot and its propulsions is described in Section 2. A model-free HSMC and proof of the stability are presented in Section 3. Section 4 describes the positioning system based on Kalman filter to correct the possible navigation error. In Section 5, scenarios for SIL and HIL testing of the ROV are provided, along with details of the test rig’s mechanism and specifications. This section also illustrates the results of the simulations. Finally, Section 6 ends the study with some conclusions.
2. The system description
2.1. ROV model
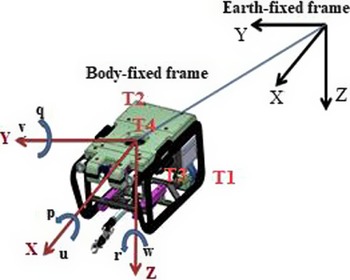
A typical ROV, as illustrated in Fig. 1, utilizes four thrusters to generate the force and torque necessary for motion. The motion of an ROV in 6-DOF can be represented in a vectorial form through the use of the SNAME notation (SNAME 1950) outlined in Table I; this notation generalizes six individual coordinates to describe the position and orientation, as well as the linear and angular velocities of the vehicle.
An ROV with two coordinate systems [Reference Hosseini and Seyedtabaii2].

The SNAME notation for ROV.

In the local body-fixed reference frame (b-frame), a nonlinear dynamic model of an ROV is defined by refs. [Reference Hosseini and Seyedtabaii2, Reference Hoang and Kreuzer17]:
 \begin{equation} M\dot{v}+C(v)v+D(v)v+g(v)=\tau (v_{a})+d \end{equation}
with:
 \begin{align*} v&=\left[\textrm{u}\,\textrm{v}\,\textrm{w}\,\textrm{p}\,\textrm{q}\,\textrm{r}\right]^{T}\!,\\ M&=M_{RB}+M_{A},\\ C\!\left(v\right)&=C_{RB}\!\left(v\right)+C_{A}\!\left(v\right) \end{align*}
In Eq. (1),
 $v$
is the velocity vector in a body-fixed reference frame, consisting of the three linear velocities
 $[\textrm{u}\ \ \textrm{v}\ \ \textrm{w}]$
in the three axis, as well as the angular rates of the ROV.
 $d$
disturbances caused by underwater currents,
 $\tau (v_{a})$
represents the forces and torques that act upon the ROV, and the voltage
 $v_{a}$
explains the control signal applied to the thruster.
The parameter
 $M\in \mathbb{R}^{6\times 6}$
is the inertia matrix that includes the added mass and the rigid-body mass matrix,
 $C\in \mathbb{R}^{6\times 6}$
is the Coriolis matrix and the centripetal terms, and
 $D\in \mathbb{R}^{6\times 6}$
is the added mass and damping matrix. Finally, the gravity vector, which contains both weight and buoyancy, is represented by
 $g(\eta )$
. The matrices
 $M_{A}, C_{A}(v)$
represent hydrodynamic added mass and Coriolis acceleration,
 $M_{RB}$
is the rigid-body mass matrix, and
 $C_{RB}$
is the rigid-body Coriolis and centripetal matrix [Reference Hosseini and Seyedtabaii2].
For a port-starboard symmetrical vehicle with homogenous mass distribution, CG satisfying
 $y_{g}=0$
and products of inertia
 $I_{xy}=I_{yz}=0$
, the system inertia matrix becomes
 \begin{equation} M=\left[\begin{array}{c@{\quad}c@{\quad}c@{\quad}c@{\quad}c@{\quad}c} m-X_{\dot{u}} & 0 & -X_{\dot{w}} & 0 & mz_{g}-X_{\dot{q}} & 0\\[3pt] 0 & m-Y_{\dot{v}} & 0 & -mz_{g}-Y_{\dot{p}} & 0 & mx_{g}-Y_{\dot{r}}\\[3pt] -X_{\dot{w}} & 0 & m-Z_{\dot{w}} & 0 & -mx_{g}-Z_{\dot{q}} & 0\\[3pt] 0 & -mz_{g}-Y_{\dot{p}} & 0 & I_{x}-K_{\dot{p}} & 0 & -I_{zx}-K_{\dot{r}}\\[3pt] mz_{g}-X_{\dot{q}} & 0 & -mx_{g}-Z_{\dot{q}} & 0 & I_{y}-M_{\dot{q}} & 0\\[3pt] 0 & mx_{g}-Y_{\dot{r}} & 0 & -I_{zx}-K_{\dot{r}} & 0 & I_{z}-N_{\dot{r}} \end{array}\right] \end{equation}
The Coriolis and centripetal matrices are defined as:
 \begin{equation} C_{A}\!\left(v\right)=\left[\begin{array}{c@{\quad}c@{\quad}c@{\quad}c@{\quad}c@{\quad}c} 0 & 0 & 0 & 0 & -a_{3} & a_{2}\\[3pt] 0 & 0 & 0 & a_{3} & 0 & -a_{1}\\[3pt] 0 & 0 & 0 & -a_{2} & a_{1} & 0\\[3pt] 0 & -a_{3} & a_{2} & 0 & 0 & b_{2}\\[3pt] a_{3} & 0 & -a_{1} & b_{3} & -b_{3} & -b_{1}\\[3pt] -a_{2} & a_{1} & 0 & -b_{2} & b_{1} & 0 \end{array}\right] \end{equation}
where
 \begin{align} a_{1} & =X_{\dot{u}}u+X_{\dot{w}}w+X_{\dot{q}}q\nonumber\\[3pt] a_{2} & =Y_{\dot{v}}v+Y_{\dot{p}}p+Y_{\dot{r}}r\nonumber\\[3pt] a_{3} & =Z_{\dot{u}}u+Z_{\dot{w}}w+Z_{\dot{q}}q\\[3pt] b_{1} & =K_{\dot{v}}v+K_{\dot{p}}p+K_{\dot{r}}r\nonumber\\[3pt] b_{2} & =M_{\dot{u}}u+M_{\dot{w}}w+M_{\dot{q}}q\nonumber\\[3pt] b_{3} & =N_{\dot{v}}v+N_{\dot{p}}p+N_{\dot{r}}r \nonumber\end{align}
and
 \begin{equation} C_{RB}\!\left(v\right)=\left[\begin{array}{c@{\quad}c@{\quad}c@{\quad}c@{\quad}c@{\quad}c} 0 & -mr & mq & mz_{g}r & -mx_{g}q & -mx_{g}r\\[3pt] mr & 0 & -mp & 0 & m\!\left(z_{g}r+x_{g}p\right) & 0\\[3pt] -mq & mp & 0 & -mz_{g}p & -mz_{g}q & mx_{g}p\\[3pt] -mz_{g}r & 0 & mz_{g}p & 0 & -I_{xz}p+I_{z}r & -I_{y}q\\[3pt] mx_{g}q & -m\!\left(z_{g}r+x_{g}p\right) & mz_{g}q & I_{xz}p-I_{z}r & 0 & -I_{xz}r+I_{x}p\\[3pt] mx_{g}r & 0 & -mx_{g}p & I_{y}q & I_{xz}r-I_{x}p & 0 \end{array}\right] \end{equation}
Linear damping for a port-starboard symmetrical vehicle takes the following form:
 \begin{equation} D=-\left[\begin{array}{c@{\quad}c@{\quad}c@{\quad}c@{\quad}c@{\quad}c} X_{u} & 0 & X_{w} & 0 & X_{q} & 0\\[3pt] 0 & Y_{v} & 0 & Y_{p} & 0 & Y_{r}\\[3pt] Z_{u} & 0 & Z_{w} & 0 & Z_{q} & 0\\[3pt] 0 & K_{v} & 0 & K_{p} & 0 & K_{r}\\[3pt] M_{u} & 0 & M_{w} & 0 & M_{q} & 0\\[3pt] 0 & N_{v} & 0 & N_{p} & 0 & N_{r} \end{array}\right] \end{equation}
The relationship between velocity in the body and the earth-fixed coordinate is represented by,
 \begin{equation} \dot{\eta }=J(\eta )v \end{equation}
where
 $J(\eta )$
is the transformation matrix between the body-fixed and the earth-fixed frame. In Eq. (1),
 $\eta =[x,y,z,\phi,\theta,\psi ]$
is the earth frame state vector containing position
 $(\textrm{X},\textrm{Y},\textrm{Z})$
and attitude (roll, pitch, and yaw angles) [Reference Salgado-Jiménez, García-Valdovinos, Delgado-Ramírez and Bartoszewicz18]. Therefore, a model of a ROV in the earth frame is defined as follows [Reference Hosseini and Seyedtabaii2, Reference Koh, Lau, Low, Seet, Swei and Cheng19]:
 \begin{equation} M_{\eta }(\eta )\ddot{\eta }+C_{\eta }(\eta,v)\dot{\eta }+D_{\eta }(\eta,v)\dot{\eta }+g_{\eta }(\eta )=\tau _{\eta } \end{equation}
where
 \begin{align*} M_{\eta }&=J^{-T}\!\left(\eta \right)MJ^{-1}\!\left(\eta \right)\\ C_{\eta }\!\left(\eta,\nu \right)&=J^{-T}\!\left(\eta \right)\left[C\!\left(\nu \right)-MJ^{-1}\!\left(\eta \right)J\!\left(\eta \right)\right]J^{-1}\!\left(\eta \right)\\ D_{\eta }\!\left(\eta,\nu \right)&=J^{-T}\!\left(\eta \right)D\!\left(\nu \right)J^{-1}\!\left(\eta \right)\\ g_{\eta }\!\left(\eta \right)&=J^{-T}\!\left(\eta \right)g\!\left(\eta \right)\\ \tau _{\eta }\!\left(\eta \right)&=J^{-T}\!\left(\eta \right)\tau \!\left(v_{a}\right) \end{align*}
2.2. Thruster
The applied force and torque vector
 $\tau$
are defined in Eq. (1) in the body-fixed coordinate frame. According to Eq. (9), this vector depends on the produced torque by each of the four thrusters. Elements of matrix B indicate the position of the ROV’s propulsions relative to its center of gravity.
 \begin{equation} \tau =\left[\begin{array}{l} X\\[3pt] Y\\[3pt] Z\\[3pt] K\\[3pt] M\\[3pt] N \end{array}\right]=BT\!\left(v_{a}\right)=\left[\begin{array}{c@{\quad}c@{\quad}c@{\quad}c} 1 & 1 & 0 & 0\\[3pt] 0 & 0 & 1 & 0\\[3pt] 0 & 0 & 0 & 1\\[3pt] 0 & 0 & -z_{F3} & y_{F4}\\[3pt] z_{F1} & z_{F2} & 0 & -x_{F4}\\[3pt] -y_{F1} & -y_{F2} & x_{F3} & 0 \end{array}\right]\left[\begin{array}{l} T_{1}\\[3pt] T_{2}\\[3pt] T_{3}\\[3pt] T_{4} \end{array}\right] \end{equation}
As shown in Fig. 1, the ROV is equipped with four DC motors acting as thrusters. To manage longitudinal movement,
 $T_{1}, T_{2}$
at the end,
 $T_{3}$
for the lateral movement and
 $T_{4}$
for diving and vertical climbing have been installed.
The thruster model is defined by the hydrodynamic model of the propeller and the characteristics of the DC motor. Newtonian fluid mechanics can be used to define a hydrodynamic model of the propeller [Reference Koh, Lau, Low, Seet, Swei and Cheng19]:
 \begin{equation} T=K_{T0}\dot{\omega }+K_{T}| \omega | \omega \end{equation}
where
 $T$
denotes the propeller thrust,
 $\omega$
denotes thruster rotational speed,
 $K_{T0}, K_{T}$
denote thruster coefficients, and thruster coefficients, and these values are equivalent to refs. [Reference Wan and Wang20, Reference Aras, Abdullah, Rahman and Aziz21]:
 \begin{equation} K_{T}=k_{t}\rho D^{4} \end{equation}
In Eq. (11),
 $k_{t}$
is a constant value,
 $\rho$
denotes the water density, and
 $D$
denotes the diameter of the propeller (in meters). The armature voltage
 $(v_{a})$
applied to motors is converted to ROV propulsion using an electromechanical model of the motor:
 \begin{equation} v_{a}=R_{a}i_{a}+L_{a}i_{a}+k_{b}\omega \end{equation}
where
 $i_{a}$
is the armature current,
 $\omega$
represents the rotor rotation speed, and the Ohmic resistance, inductance, and the tacho constant are denoted, respectively, as
 $R_{a}, L_{a}$
, and
 $k_{a}$
. The motor’s electric torque is determined by:
 \begin{equation} T=k_{m}i_{a} \end{equation}
Assuming the inductance of the armature circuit
 $(L_{a})$
in Eq. (12) is negligible, the equation can be rewritten as:
 \begin{equation} \nu _{a}=R_{a}i_{a}+k_{b}\omega \end{equation}
Since the propeller’s rotational speed is constant, the rate of speed
 $K_{T0}$
in Eq. (10) can be omitted and the equation rewritten as follows [Reference Koh, Lau, Low, Seet, Swei and Cheng19]:
 \begin{equation} T=K_{T}\!\left| \omega \right| \omega \end{equation}
The propeller’s rotational speed is equivalent to:
 \begin{equation} \omega =\sqrt{\frac{T}{K_{T}}} \end{equation}
Eqs. (14) and (16) are substituted in Eq. (14) ref. [Reference Aras, Abdullah, Rahman and Aziz21]:
 \begin{equation} v_{a}=R_{a}\frac{T}{k_{m}}+k_{b}\sqrt{\frac{T}{K_{T}}} \end{equation}
3. High-order sliding mode control
The objective is to design a controller
 $\tau _{\eta }$
for the ROV dynamics Eq. (8) such that tracking of the desired path
 $\eta _{d}(t)\in \mathbb{C}^{2}$
is guaranteed, without any knowledge of the system’s dynamics, free of high-frequency components, and in the presence of external disturbances.
SMC is a robust method for dealing with uncertainty and disturbances. Furthermore, high-order model-free SMC can eliminate chattering of the control signal, resulting in a smoother control signal.
3.1. Control design
The left-hand side of Eq. (8) is linearly parametrizable by the product of a regressor
 $Y(\eta,\dot{\eta },\ddot{\eta })\in R^{n\times p}$
with a vector
 $\theta \in R^{p}$
that includes unknown constant parameters. The parametrization
 $Y(\eta,\dot{\eta },\ddot{\eta })\theta$
can be rewritten according to the nominal reference
 $\dot{\eta }_{r}$
and its derivative:
 \begin{equation} M_{\eta }(\dot{\eta })\ddot{\eta }_{r}+C_{\eta }(\eta,v)\dot{\eta }_{r}+D_{\eta }(\eta,v)\dot{\eta }_{r}+g_{\eta }(\eta )=Y(\eta,\dot{\eta },\eta _{r},\dot{\eta }_{r})\theta \end{equation}
Substituting Eq. (18) into Eq. (8) yields the open-loop error dynamics in error coordinates
 $s_{r}=\dot{\eta }-\dot{\eta }_{r}$
as follows:
 \begin{equation} M_{\eta }(\dot{\eta })\dot{s}_{r}+\left \{C_{\eta }(\eta,v)+D_{\eta }(\eta,v)\right \}s_{r}=\tau _{\eta }-\dot{\eta }_{r}Y(\eta,\dot{\eta },\eta _{r},\dot{\eta }_{r})\theta \end{equation}
An aim of designing a controller for open-loop error dynamics Eq. (19) is to determine
 $\tau _{\eta }$
such that an exponential convergence is guaranteed. This will be accomplished without knowledge of system dynamics and high-frequency components. Let us define dynamic reference as a function of (
 $\dot{\eta }_{d}, \tilde{\eta }, s_{\eta }$
) as follows [Reference Parra-Vega, Arimoto, Liu, Hirzinger and Akella22]:
 \begin{equation} \dot{\eta }_{r}=\dot{\eta }_{d}-\alpha \tilde{\eta }+s_{d}-\gamma \int _{0}^{t}\text{sign}(s_{\eta })d\sigma \end{equation}
where
 $\tilde{\eta }=\eta -\eta _{d}$
is the position tracking error.
 $\eta _{d}$
indicates the desired path,
 $\alpha$
and
 $\gamma$
are positive definite
 $(n\times n)$
gain matrices,
 $\text{sign}(s_{\eta })$
is the discontinuous function signum of vector
 $s_{\eta }$
, and:
 \begin{equation} s=\dot{\tilde{\eta }}+\alpha \tilde{\eta },{\ } s_{d}=s(t_{0})e^{-kt},{\ } s_{\eta }=s-s_{d} \end{equation}
where
 $k\gt 0$
, substituting Eq. (20) into the extended error
 $s_{r}=\dot{\eta }-\dot{\eta }_{r}$
leads to refs. [Reference Parra-Vega, Arimoto, Liu, Hirzinger and Akella22, Reference Parra-Vega and Arimoto23]:
 \begin{equation} s_{r}=s_{\eta }+\gamma \int _{0}^{t}\text{sign}(s_{\eta })d\sigma \end{equation}
This surface yields fast asymptotic convergence with a certain degree of robustness.
The control signal of the ROV model Eq. (8) in the closed loop is defined as follows [Reference Parra-Vega, Arimoto, Liu, Hirzinger and Akella22]:
 \begin{equation} \tau _{\eta }=-K_{d}s_{r} \end{equation}
where
 $K_{d}$
is a diagonal positive
 $n\times n$
matrix, which is called the feedback gain.
3.2. The stability analyses
A structural feature of Eqs. (1) and (20) is expressed by fixed-parameter
 $\beta _{i}(i=0,1,\ldots )$
, which will be used in the proof of stability:
 \begin{equation} \begin{split} \| M_{\eta }\| &\geq \lambda _{m}(M_{\eta })\gt \beta _{0}\gt 0, \\ \| M_{\eta }\| &\leq \lambda _{M}(M_{\eta })\lt \beta _{1}\lt \infty, \\ \| C_{\eta }\| &\leq \beta _{2}\| \dot{\eta }\|,\\ \| g_{\eta }\| &\leq \beta _{3}, \\ \| \dot{\eta }_{r}\| &\leq \alpha \| \dot{\eta }\| +\gamma \| \sigma \| +\beta _{4}, \\ \| \ddot{\eta }_{r}\| &\leq \alpha \| \dot{\tilde{\eta }}\| +\beta _{5} \end{split} \end{equation}
where
 $\lambda _{m}(M_{\eta })$
and
 $\lambda _{M}(M_{\eta })$
stand for minimum and maximum matrix eigenvalues,
 $M\in R^{n\times n}$
, respectively. Constants
 $\beta _{i}$
can be computed from the states of the system, desired trajectory, feedback gains, and a conservative upper bound of the dynamic model of the ROV. Using Eq. (24) and Eq. (18) becomes
 \begin{equation} \begin{split} Y(\eta,\dot{\eta },\ddot{\eta })\theta &\leq \| M_{\eta }(\dot{\eta })\| \| \ddot{\eta }_{r}\| +(\| C_{\eta }(\eta,v)\| +\| D_{\eta }(\eta,v)\| ) \\ & \quad \times \| \dot{\eta }_{r}\| +\| g_{\eta }(\eta )\| \\ &\leq \beta _{1}\alpha \| \dot{\tilde{\eta }}\| +(\beta _{2}\| \dot{\eta }\| +\lambda _{M}(D_{\eta })) \\&\quad \times (\alpha \| \tilde{\eta }\| +\gamma \| \sigma \| +\beta _{4})+\overline{\beta } \\ &=\rho (t) \end{split} \end{equation}
where
 $\overline{\beta }=\beta _{1}\beta _{5}+\beta _{3}$
. Furthermore,
 $\rho (t)=f(\eta,\dot{\eta },\dot{\eta }_{r},\ddot{\eta }_{r})$
is a function of state variables.
Theorem 1: By substituting the control signal Eq. (23) into Eq. (19), if the coefficient matrix
 $k_{d}$
is large enough for the initial small error conditions, asymptotic convergence is guaranteed.
Proof : For better understanding, proof of the stability is divided into two parts [Reference García-Valdovinos, Salgado-Jiménez, Bandala-Sánchez, Nava-Balanzar, Hernández-Alvarado and Cruz-Ledesma24].
1. Closed-loop convergence
Replacement of Eq. (23) into Eq. (19) leads to the following closed-loop error dynamic:
 \begin{equation} M_{\eta }(\dot{\eta })\dot{s}_{r}=-(C_{\eta }(\eta,v)+K)s_{r}-Y(\eta,\dot{\eta },\eta _{r},\dot{\eta }_{r})\theta \end{equation}
where
 $K=D_{\eta }(v,\eta )+K_{d}$
candidate a Lyapunov function as ref. [Reference Parra-Vega, Arimoto, Liu, Hirzinger and Akella22]:
 \begin{equation} V=\frac{1}{2}s_{r}^{T}M_{\eta }\!\left(\eta \right)s_{r} \end{equation}
Substituting the derivative of the Lyapunov function in Eq. (27) together with using Eq. (26) becomes
 \begin{equation} \begin{split} \dot{V}&=-s_{r}^{T}Ks_{r}-s_{r}^{T}Y_{r}\theta \\ &\leq -s_{r}^{T}Ks_{r}-\| s_{r}\| \| Y_{r}\theta \| \\ &\leq -\| K_{1}s_{r}\| ^{2}-\| s_{r}\| \rho (t) \end{split} \end{equation}
where
 $K=K_{1}^{T}K_{1}$
. Since
 $s_{r}$
is a function of
 $\tilde{\eta }, \dot{\tilde{\eta }}, \sigma$
and the initial conditions, then in the presence of small initial errors belonging to a finite set
 $\varepsilon$
with radius
 $r$
centered in the equilibrium point
 $s_{r}=0$
, and by invoking Lyapunov arguments, there exists a large enough gain
 $K_{d}$
(remember that
 $K=D_{\eta }(v,\eta )+K_{d}=K_{1}^{T}K_{1}$
), such that
 $s_{r}$
converges to a finite set
 $\varepsilon$
. Then, the boundedness of tracking error is guaranteed
 $s_{r}\rightarrow \varepsilon\ as\ t\rightarrow \infty$
.
As a result,
 $s_{r}$
is bounded by a constant
 $\varepsilon _{r}$
. Boundedness of
 $s_{r}$
indicates that the closed-loop system mode is convergent. There exists an upper bound
 $\overline{\rho }$
where
 $\overline{\rho }\geq \rho (t)$
. Since the positive definite matrix
 $M$
is bounded, the boundedness of
 $\dot{s}_{r}$
in Eq. (29) is achieved.
 \begin{equation} \begin{split} \dot{s}_{r}&=-M_{\eta }^{-1}\!\left \{(C_{\eta }(\eta,v)+K)s_{r}-Y(\eta,\dot{\eta },\eta _{r},\dot{\eta }_{r})\theta \right \} \\ &\quad \leq \lambda _{M}(M_{\eta }^{-1})\left \{(\lambda _{M}(K)+\beta _{2}\| \dot{\eta }\| )\varepsilon _{1}+\overline{\rho }\right \} \\ &\quad \leq \varsigma (t) \end{split} \end{equation}
Function
 $\varsigma (t)\leq \overline{\varsigma }$
is bounded in Eq. (29). As a result, the tracking error stays constant as long as the closed-loop signal is finite.
2. Design of a second-order sliding mode
Consider the following second-order dynamical system, described by the time derivative of Eq. (22), as follows:
 \begin{equation} \dot{s}_{\eta }=-\gamma\ \text{sign}(s_{\eta })+\dot{s}_{r} \end{equation}
with the following Lyapunov function:
 \begin{equation} v_{\eta }=\frac{1}{2}s_{\eta }^{T}s_{\eta } \end{equation}
Replacing Eq. (30) into the derivative of Eq. (31) yields
 \begin{equation} \begin{split} \dot{v}_{\eta }&=-s_{r}^{T}\gamma\ \text{sign}(s_{\eta })+s_{r}^{T}\dot{s}_{r} \\ &\quad \leq -\lambda _{\min }(\gamma )\| s_{r}^{T}\| +\| s_{r}^{T}\| \| \dot{s}_{r}\| \\ &\quad \leq \| s_{r}^{T}\| ({-}\lambda _{\min }(\gamma )+\overline{\varsigma }) \\ &\quad \leq -\mu \| s_{r}^{T}\| \end{split} \end{equation}
where
 $\mu =\lambda _{\min }(\gamma )-\overline{\varsigma }$
. To achieve a finite-time convergence for
 $s\rightarrow 0$
, it is necessary to have
 $\lambda _{\min }(\gamma )\gt \overline{\varsigma }$
. Such that
 $\mu \gt 0$
guarantees the sliding mode to reach
 $s_{\eta }=0$
at
 $t_{g}=\frac{s_{\eta }(t_{0})}{\mu }$
. Therefore, for any initial conditions
 $s_{\eta }(t_{0})=0$
, then
 $t_{g}=0$
. The tracking error is bounded and tends exponentially to the desired path
 $\eta _{d}$
by designer parameters
 $k$
and
 $\alpha$
.
 \begin{equation} \eta =\eta _{d}+\tilde{\eta }(t_{0})e^{-\alpha (t-t_{0})}+s(t_{0})e^{-(\alpha +k)(t-t_{0})} \end{equation}
Eq. (33) implies that
 $\eta \rightarrow \eta _{d}\ \&\ \dot{\eta }\rightarrow \dot{\eta }_{d}\ as\ t \rightarrow \infty$
. Thus, the exponential convergence of the tracking errors is guaranteed.
For a more smooth change of the switching signal, a hyperbolic tangent function is used to avoid the chattering of the control force [Reference Eker25].
 \begin{equation} \tau _{\eta }=-K_{d}s_{r}=-K_{d}\!\left (s_{\eta }+\gamma \int _{0}^{t}\tanh\!(s_{\eta })d\sigma \right) \end{equation}
By utilizing the Lemma 1, the proof of stability can be extended to Eq. (34).
Lemma 1: There always exists a constant
 $\rho _{i}\gt 0$
for all
 $s_{i}\neq 0$
such that ref. [Reference Fang, Tsai, Yan and Guo26]:
 \begin{equation*} s_{i}\tanh \!\left(s_{i}\right)\gt \rho _{i}s_{i}\ \text{sign} \!\left(s_{i}\right) \end{equation*}
Since the proposed control law Eq. (34) is achieved in the earth-fixed reference frame, it is required to express into the body-fixed coordinate frame to apply to the ROV:
 \begin{equation} \tau ={J^{T}}\tau _{\eta } \end{equation}
4. State estimation
Accurate trajectory tracking of an ROV necessitates a precise inertial navigation system (INS) in order to accurately calculate its state variables, such as position, velocity, and attitude. This navigation system utilizes accelerometer and gyroscope sensors to measure the vehicle’s linear acceleration and angular velocity. These INS outputs are then usually fed into various control algorithms, depending on the application [Reference Dinc and Hajiyev27].
The navigation algorithm calculates velocity and position using the previous data, resulting in an accumulating error that increases over time, particularly on long-term missions. By combining the INS with auxiliary sensors such as a DVL, magnetometer, and pressure sensor, it is possible to improve the accuracy of the INS [Reference Sokolović, Dikic, Markovic, Stancic and Lukic28]. This research proposes the use of a linear Kalman filter to fuse inertial sensors with auxiliary sensors in order to estimate sensor errors and navigation calculation errors. And then, this estimation error
 $(\delta x)$
is used as feedback to correct the output of the positioning system (position, speed, and status), as shown in Fig. 2.
Structure of the error state estimation for INS correction.

The dynamic error model is composed of differential equations for velocity, position, and attitude errors, as follows:
 \begin{equation} \delta x_{k}=F_{k-1}\delta x_{k-1}+w_{k}, w_{k}\sim \mathbb{N}(0,Q_{k}) \end{equation}
where
 $F$
is the state transition matrix, which relates the state vector from the time instant
 $k$
to
 $k-1$
(in discrete-time systems),
 $w$
is the Gaussian process noise with the covariance matrix
 $Q$
, and
 $\delta x$
denotes the error state vector as follows:
 \begin{equation} \delta x=\left [\chi _{3\times 1} \ \ \delta v_{3\times 1} \ \ \delta P_{3\times 1} \ \ \delta _{{gy_{3\times 1}}} \ \ \delta b_{{\textrm{acc}_{3\times 1}}}\right ] \end{equation}
where
 $\chi$
denoteds the orientation error vector,
 $\delta v$
denotes the velocity error vector,
 $\delta P$
is the position error vector, and
 $\delta _{gy}$
denotes the gyro bias vector. Finally,
 $\delta b_{\textrm{acc}}$
denotes the acceleration bias vector. The measurement model, which is also referred to as the observation model, represents the difference between the measurements and the INS outputs.
 \begin{equation} \delta y_{k}=H_{k}\delta x_{k}+v_{k}, v_{k}\sim \mathbb{N}(0,R_{k}) \end{equation}
where
 $\delta y_{k}$
stands for the available measurements containing the measured values by auxiliary sensors, including the Doppler velocity log, pressure sensor, and magnetometer.
 $H_{k}$
is the observation matrix,
 $\delta x_{k}$
is the error state vector, and
 $v_{k}$
represents the measurement noise with the covariance matrix
 $R$
.
The Kalman filtering estimation algorithm consists of two steps: prediction and updating with external measurements. The core equations of the Kalman filter are given below:
Prediction:
 \begin{equation} \begin{split} \delta \hat{x}_{k}^{-}&=F_{k-1}\delta \hat{x}_{k-1}^{+} \\ P_{k}^{-}&=F_{k-1}P_{k-1}^{+}F_{k-1}^{T}+Q_{k-1} \end{split} \end{equation}
Updating:
 \begin{equation} \begin{split} K_{k}&=P_{k}^{-}H_{k}^{T}\!\left ({H_{k}}P_{k}^{-}H_{k}^{T}+{R_{k}}\right )^{-1} \\ \delta \hat{x}_{k}^{+}&=F_{k-1}\delta \hat{x}_{k-1}^{+}+K_{k}\!\left (\delta y_{k}-H_{k}\delta \hat{x}_{k}^{-}\right ) \\ P_{k}^{+}&=\left (I-K_{k}H_{k}\right )P_{k}^{-} \end{split} \end{equation}
where
 $P_{k}$
is error covariance matrix, and
 $K_{k}$
denotes the Kalman gain.
5. Simulation
5.1. The HIL test rig
HIL test influences the development and evaluation of navigation, guidance, and control systems in the aerospace and marine equipment industries [Reference Lei, Chen, Chang and Wang29]. Designing autonomous underwater guidance, control, and navigation system requires various verification and validation tests. Since accurate modeling of the plant is practically impossible or very difficult, using HIL increases the efficiency and accuracy of the hardware’s designed controller. A HIL scheme is designed in the MATLAB®/SIMULINK® Real-Time environment, aiding the interface board model pci6221. The board, made by NI, features 16 digital input/output channels, 16 analog inputs, and 2 analog output channels with a sample rate of 250 Ks/s.
The hardware consists of two feedback laboratory MS150 servomotors (specifications in Table II), which will be used as thrusters for the ROV.
Specifications of the DC motors.

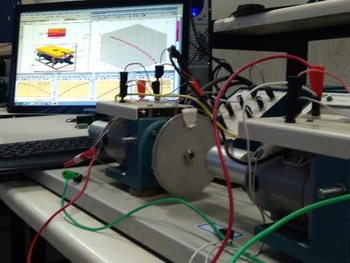
The designed HIL test rig is shown in Fig. 3.
A schematic of the test rig.

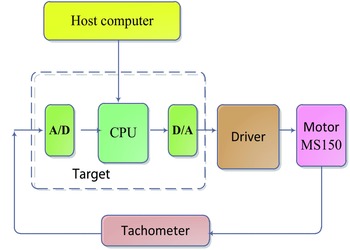
A block diagram of the HIL is shown in Fig. 4. According to Fig. 4, the host computer will do the necessary computations and send the production control signal to the motor driver through the PCI6221 interface board. The propulsion of the motor, as stated in Eq. (10), is based on the speed measured by a tachometer sensor. The tachometer output is converted from analog to digital and then sent to the computer, allowing the computer to generate the required force and torque for driving the ROV’s dynamics.
A brief view of the hardware-in-the-loop architecture.

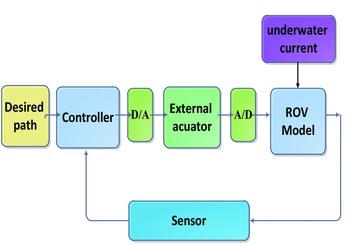
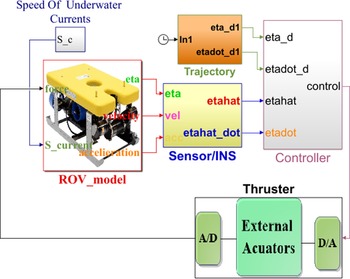
Figure 5 shows the primary control of the ROV model in dynamic Eqs. (1) and (7) in the simulink desktop real-time environment.
Basic of the proposed closed-loop ROV control.

Some environmental disturbances, such as underwater currents, affect the performance of the ROV. Therefore, this phenomenon is taken into consideration.
5.2. Simulation result
Simulation is performed by executing the test rig as in Fig. 6. Table III shows the parameters of the ROV, while the desired path for the robot is a spiral.
The ROV specifications.

The close-loop ROV control in the MATLAB/SIMULINK environment.

Undesired underwater current velocities
 $V_{c}=[u_{c}\ \ v_{c}\ \ w_{c}]^{T}$
are defined against the ROV’s motion as in refs. [Reference Hosseini and Seyedtabaii2, Reference García-Valdovinos, Salgado-Jiménez, Bandala-Sánchez, Nava-Balanzar, Hernández-Alvarado and Cruz-Ledesma24]:
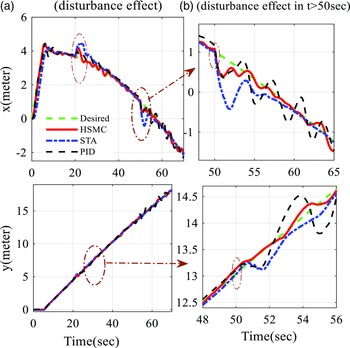
 \begin{align} 20\,\textrm{s} & \leq t\lt 50\,\textrm{s}\rightarrow V_{c}=\left[0.5\dfrac{\textrm{m}}{\textrm{s}},0,0\right]^{T}\nonumber\\[3pt] 50\,\textrm{s} & \leq t\lt 100\,\textrm{s}\rightarrow V_{c}=\left[v_{a}\cos \alpha \sin \beta,v_{a}\sin \beta,v_{a}\sin \alpha \cos \beta \right]^{T} \end{align}
where
 $v_{a}$
is the average current velocity,
 $\alpha$
is the angle of attack, and
 $\beta$
is the sideslip angle.
5.2.1. DC motor identification
Primarily, DC servo motors dynamic is identified as ROV thrusters during the SIL simulation, gaining Eq. (42) as the transfer function between motor speed and armature voltage [Reference Adewusi30]:
 \begin{equation} G\!\left(s\right)=\frac{\omega \!\left(s\right)}{v_{a}\!\left(s\right)}=\frac{k_{m}}{\left(sJ+B\right)\left(sL_{a}+R_{a}\right)+k_{m}^{2}} \end{equation}
Eq. (42) reduces to a lower order assuming that the armature winding inductance La is insignificant in comparison to the moment of inertia of the motor:
 \begin{equation} G\!\left(s\right)=\frac{k_{m}}{Ts+1} \end{equation}
where
 $T$
and
 $K_{m}$
, respectively, denote the time and the gain constants of the DC motor. These coefficients are found, according to Fig. 7, in response to a step change as
 $K_{m}=0.964$
and
 $T=0.25\,\textrm{s}$
.
The motor step response.

In Eq. (16), the thrust is a function of the speed propeller. According to the thrust curve of the DC motor in Fig. 8, there exists a dead-zone nonlinearity problem. That means there is no thrust output when the control signal is within the range of [−4, 4.7] volts.
The thrust curve of DC motor, including a dead zone.

5.2.2. HIL result
The data acquisition card (DAC) Pci6221 has an output voltage bound of
 $\pm 10$
volts.
However, the software in the loop simulation is performed using the identified parameters of the motor. After that, actual DC motors are employed to replace the thruster model during the HIL test. The tachometer output is sampled at 1 kHz to analyze the frequency spectrum.
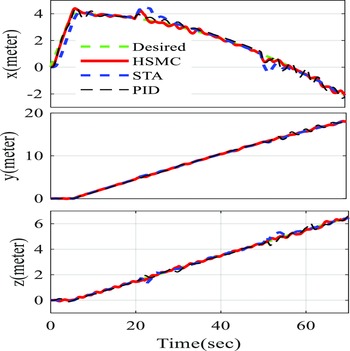
Figure 9 shows the test performed during tracking the desired path in the three directions when using HSMC, STA, and PID controllers in the presence of external disturbance of Eq. (39).
Displacement in x, y, and z axis using the proposed control procedure.

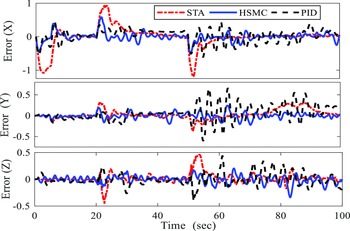
The tracking error in three axis.

Figure 10 shows the tracking error for linear displacement in the three directions obtained from Eq. (44) for HSMC, STA, and PID controllers.
 \begin{equation} \text{Error}=(p(i)-p_{\text{command}}(i))\ \ i=1,2,3 \end{equation}
Figure 11 shows the ROV heading during the path following.
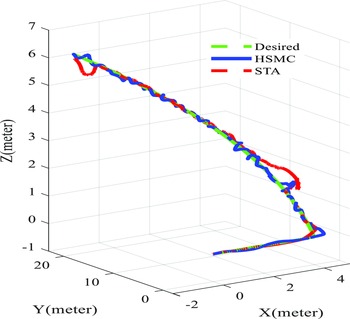
Figure 12 shows a 3D ROV trajectory tracking in 3D during the HIL tests.
Heading of ROV.

The test result for 3D position tracking in the HIL rig.

A performance term of integral of the absolute error (IAE) of the tracking task is defined in Eq. (45) ref. [Reference Proaño, Capito, Rosales and Camacho31].
 \begin{equation} \overline{\textrm{IAE}}=\frac{\int _{0}^{T}\left| e\!\left(t\right)\right| dt}{T} \end{equation}
where
 $e(t)$
is the tracking error. Besides and to test which controller has the best performance, the relative error between the two IAE of the controller calculates as in ref. [Reference Proaño, Capito, Rosales and Camacho31]:
 \begin{equation} {\Lambda}\!\left(1,2\right)=\frac{\overline{\textrm{IAE}_{1}}-\overline{\textrm{IAE}_{2}}}{\frac{\overline{\textrm{IAE}_{1}}+\overline{\textrm{IAE}_{2}}}{2}}\times 100\% \end{equation}
If
 ${\Lambda}$
is positive, that means that the performance of controller Eq. (2) is better than Eq. (1) and vice versa for the other controller.
The IAE results in Table IV show that the performance of the HSMC controller is better than other controllers.
The mean square error index of the tracking in the x, y, and z directions is presented in Table V.
Eq. (41) indicates that underwater currents act as an external disturbance to the robot dynamics in the simulation. Figure 13 demonstrates that the HSMC controller performs better than the PID and STA controllers in the presence of this disturbance, delivering a fast and smooth response with minimal overshoot.
IAE indices: square trajectory.

The mean square error indices.

(a) Performance of the controllers against the external disturbance; (b) detailed view of the image (a).

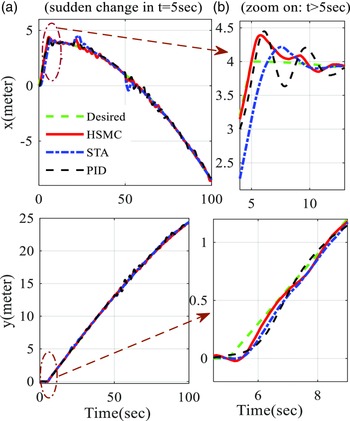
Figure 14 shows that the HSMC controller is more adept at handling sudden changes in ROV motion, offering a fast and smooth response in comparison to the PID and STA controllers.
(a) Performance of the controllers against the sudden change of direction of the ROV; (b) Detailed view of the image (a).

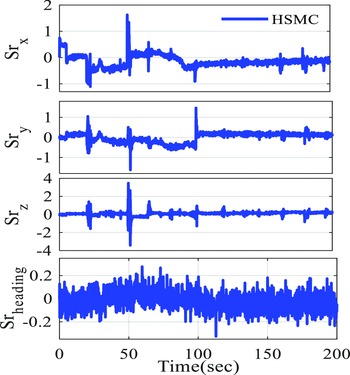
Figure 15 illustrates the proposed HSMC controller, which causes the sliding surfaces to converge in a finite amount of time.
Sliding surfaces evolve around the origin.

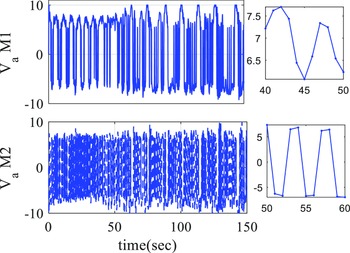
The motor armature voltage is shown in Fig. 16. The voltage bound due to the saturation level of the analog output signal (DAC) of the pci6221 interface board is between [−10, 10] volts. Figure 16 shows the performance of the HSMC controller.
The armature voltage of T1 and T2.

The rotation speed of motors 1 and 2.

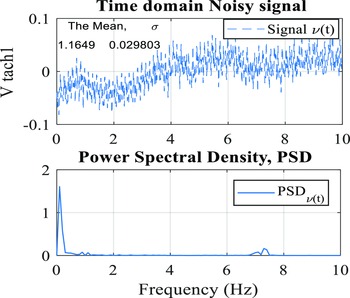
The frequency spectrum and measured speed of motor #1 are shown in the bottom and top, respectively.

As seen in Fig. 16, motors change the direction two to three times every 10 s. These turns are acceptable by the thruster. The frequency of the control signal is about 0.3 Hz, which is satisfactory.
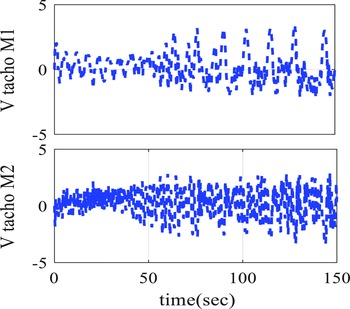
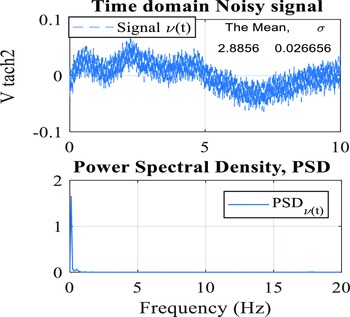
The rotational speeds of motors 1 and 2 as measured by the tachometer are shown in Fig. 17. To further investigate, the speed output’s frequency spectrum is plotted in the time range (10–20) seconds as the speed approaches the steady state, as seen in Figs. 18 and 19.
The frequency spectrum and measured speed of motor #2 are shown in the bottom and top, respectively.

The spectrum’s frequency reveals that the majority of signals are concentrated around the DC frequency of 0.1 Hz. This indicates that the sampling of each motor’s speed has been done reliably and effectively.
6. Conclusion
The current research describes a model-free HSMC approach for trajectory tracking of ROV in the presence of disturbance, measurement errors, and actuator dynamic and nonlinearity. A linear Kalman filter for estimating measurement errors is proposed to be used to correct positioning system outputs (speed, position, and attitude). The results of comparing a conventional PID controller and a STA controller with the proposed HSMC demonstrated the superiority of the proposed controller. The proposed scheme includes stability analysis.
The results show that this controller gives better tracking performance than the STA and PID controller, with fewer oscillations and smoother responses.
A HIL test rig in MATLAB®/SIMULINK® Real-Time environment is designed for an ROV in the tracking task to perform more realistic test conditions. The frequency spectrum test verifies the feasibility of the produced control signal.
Acknowledgments
The authors acknowledge the funding support of Babol Noshirvani University of Technology through the grant program No. BNUT/370404/00.
Author contributions
MH and AR conceived and designed the study. JS performed statistical analyses. MH wrote the article.
Financial support
This research received no specific grant from any funding agency, commercial, or not-for-profit sectors.
Competing interests
The authors declare no Competing interest exist.
Ethical approval
Not applicable.