


Introduction
Field tests show that temperature is an important factor for avalanche formation (Reference PerlaPerla, 1977). It is believed that an increase in temperature causes an acceleration of grain sintering and therefore an increase in snow-cover strength. Conversely, at higher temperatures creep processes are accelerated, and strain and deformation rates increase. This results in a decrease in stiffness of the snow cover that can activate the development of local stress concentrations, which are responsible for avalanche formation (Reference Bader and SalmBader and Salm, 1990). These two processes—work hardening through sintering, and development of stress concentrations—are in competition and are believed to determine the stability of the snow cover. Knowledge about the temperature-dependent viscoelastic behaviour of the snow layers and the intergranular sintering processes is therefore of primary importance for a better understanding of avalanche formation.
Our research deals with the influence of temperature, snow density and microstructure on the viscous behaviour of snow. Previous data have been reported by Reference MellorMellor (1975) and Reference VoytkovskiyVoytkovskiy (1977). These works provide an overview of the mechanical properties of snow. However, the reported data are mostly from mono-axial creep tests (constant load) at only a few different temperatures. Reference Mellor and SmithMellor and Smith (1966) reported results of creep tests on snow with densities of 440– 830 kg m–3 and temperatures of–34.5 to –05°C. An apparent activation energy Q was determined using an Arrhenius law. The calculated values 44.8 kJ mol–1 < Q < 74.5kJ mol–1 are of the same order of magnitude as the values for self-diffusion in ice (Q ≈ 70 kJ mol– 1 ) (Reference Barnes, Tabor and WalkerBarnes and others, 1971). Reference Mellor and SmithMellor and Smith (1966) also reported values of the apparent activation energy, varying between 87 and 100 kJ mol–1, found by Reference YosidaYosida and others (1955) for low-density snow (170kgm–3 < p < 250 kg m–3) and in the temperature range –25 °C < T < –3°C. However, because Mellor’s tests were conducted at only one stress level (σ = 50 kPa), an evaluation of the stress–strain-rate relationship as a function of temperature and density could not be carried out. More recently, McClung (1996) and Schweizer (1998) have reported the results of shear tests on dry fine-grained alpine snow. In both works, the relationship between strain rate, yield stress and failure stress has not been investigated in terms of a power law (Equation (1)), as is usual in polycrystalline ice. Also, no attempt was made to quantify the influence of temperature using an Arrhenius law. A statement about the activation energy is therefore missing in both works.
The viscous behaviour of snow has been modelled using a power law (Equation (1)) in the microstructure-based constitutive models published by Reference Mahajan and BrownMahajan and Brown (1993) and Reference Bartelt and von MoosBartelt and von Moos (2000). However, both the activation energy (Q = 120kJ mol–1 for T >–10°C; Q =78 kJ mol–1 for T < –10°C) and the exponent n for polycrystalline ice have been employed (n = 3.0). Because experimental data were missing, the exponent n and the activation energy Q were assumed to be temperature- and density-independent. As will be shown, this does not agree with our experimental data.
The goal of this paper is to quantify the temperature and density dependence on the viscous behaviour of snow. A power law will be used to describe the relationship between strain rate and yield stress; the values of the activation energy Q and of the exponent n will therefore be quantified. The yield stress (σy) is defined here as the stress at which a steady-state viscous deformation is reached (Fig. 1). The data analysis is based on test results of mono-axial deformation controlled compression tests on fine-grained alpine snow with a density of 200–430 kg m–3 at temperatures ranging between T = –20°C and T = –2°C. The reported test results are part of a larger investigation (200 tests) in which samples of different density (190 kg m–3 < ρ < 430 kg m-3) were also tested in both confined and unconfined compression at T = –12°C and in the same range of strain rates. An important result of this work (Reference Bartelt and von MoosBartelt and von Moos, 2000) is that the axial yield stress is independent of the applied confining pressure. In the tests with low-density snow (ρ = 200 kg m–3), we observed that when the confining pressure exceeds a critical value, which is probably dependent on density, densification effects (building of new bonds) take place and influence the response of the sample, leading to a rapid increase of the axial yield stress. However, these critical pressures are much higher than those encountered in the natural snow cover. Subsequently, only unconfined tests were performed to establish the influence of the temperature on the viscoelastic behaviour of snow. In the larger test series, strain-rate controlled tests with unloading steps were also performed, in order to determine the distribution of elastic, anelastic and viscous strain as a function of the total strain, density, temperature and strain rate. In this paper, we limit our attention to the temperature- and density-dependent viscous behaviour of snow. The relationship between strain rate and yield stress is quantified as a function of temperature and density. A finite-element model, assuming a stationary viscous solution for the governing equilibrium equations (Reference Bartelt, Christen, Hutter, Wang and BeerBartelt and Christen, 1999), has been developed. Some numerical results, demonstrating the application of the experimental results, will briefly be reported.
Stress–strain curves for four different temperatures and strain rates, density ρ = 272 kg m–3. (a) T = –18.9°C, ɛ̇ = 4.4 x 10⁻⁵s–1; (b) T = –18.9°C, ɛ̇ = 4.2 x 10⁻⁶s–1; (c) T= –5.0° C, ɛ̇ = 4.4x10⁻⁵s–1; (d) T= –5.0˚C, = 4.2 x 10⁻²s–1. The yield stress, σy is indicated.

Test Procedure
The temperature-dependent tests were performed using a deformation-controlled triaxial apparatus (Reference Bartelt and von MoosBartelt and von Moos, 2000). In total, 64 tests in compression (4 densities, 4 temperatures, 4 strain rates) were completed. For all tests, natural fine-grained (d < 0 2 mm) alpine snow was used. This snow was collected near Weissfluhjoch, Davos, Switzerland, at an elevation of approximately 2540 m. At each collection time, a pit was dug in the snow, and a homogeneous layer with the desired density was identified. Portions of this layer were then extracted without damaging the snow, placed in a sealed container and stored at –12°C. Testing was normally started within a few days after collection. The test samples, cylindrical specimens 126 mm long and 58 mm in diameter, were cut from the stored snow blocks so that the long axis of the sample was parallel to the layering. To allow the specimen to adjust to the desired test temperature (Table 1), the sealed containers were placed in the test room for a few hours. During this time, the temperature of the snow block was controlled. The specimens were not cut until the test temperature was reached. Because the investigated snow was well rounded and fine-grained, even low-density samples maintained their form during testing.
Test parameters. In all, 64 tests were completed. For each density, four different strain rates were applied at four different temperatures

The specimens were compressed to an axial strain of 5%. A relaxation period of 45 min was included after 5% was reached, i.e. the straining was stopped and the stress relaxation was measured. The approximate values of the test parameters are given in Table 1.
Test Results
Figure 1 shows the stress–strain behaviour for one density, ρ = 272 kg m–3. The stress increases with increasing strain, although not linearly, until an approximately constant yield stress is reached (curve a). With increasing strain, work hardening takes place, probably due to densification effects (building of new bonds). The rapid drop of stress at the final strain of 5% is due to relaxation. The yield stress σy increases with increasing strain rate and decreases with increasing temperature. The relationship between yield stress, strain rate and temperature can be expressed as a power law (Reference GlenGlen, 1955) based on the Arrhenius law:

where is the applied strain rate (s–1), A0 is a density-dependent material parameter (kPa– n s–1), Q is the activation energy (kJ mol–1), R is the gas constant (kJ mol–1K–1), T is the temperature (K), σy is the resulting yield stress (kPa) and n is a dimensionless exponent.
Stress–strain-rate relationship
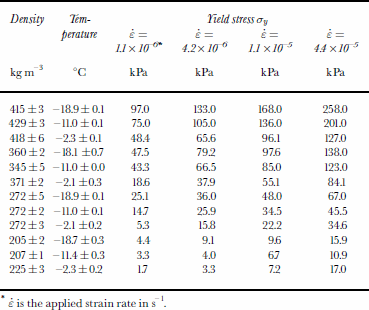
Figure 2 shows the relationship between applied strain rate and yield stress in a log–log plot. The best fit to the data, for the investigated strain-rate range 1.1 x 10⁻⁶ s–1 < ɛ̇ <4.4 x 10⁻⁵ s–1, is linear. Therefore, the stress–strain-rate relationship obeys the power law (Equation (1)). Note that the exponent n of Equation (1) represents the slope of the plotted lines (Fig. 2). Additional values of the yield stress as a function of strain rate, temperature and density are reported in Table 2.
Applied axial strain rate vs axial yield stress; n is the exponent of the power law (Equation (1)). Density ρ = 423 kg m–3.

Yield stress σy as a function of strain rate, temperature and density
Consider the influence of temperature and density on the exponent n. As shown in Figure 3, for a mean density of 423 ± 8 kg m–3, we found a mean exponent n = 3.69 ±0.07. This value is approximately the same for all four investigated temperatures and agrees well with the values reported for polycrystalline ice (Reference Weertman, Whalley, Jones and GoldWeertman, 1973). For the investigated densities below ρ = 423 kg m–3, the test results show something unexpected. The exponent n is a function of the density and of the temperature, and increases with increasing density. It is higher at lower temperatures. Finally, for low densities ρ = 150–200 kg m–3, it seems that n reaches a temperature-independent minimum value of approximately n = 1.7.
Temperature and density dependence of the exponent n for strain rates ranging between ɛ̇ = 1.1 x 10⁻⁶ s–1and ɛ̇ = 4.4 x 10⁻⁵ s–1.

Stress–temperature relationship
For constant-load creep tests, the following equation (Equation (2)) has often been used to describe the temperature-dependent secondary creep of polycrystalline ice. The exponent n is assumed to be temperature-independent.

The reference strain rate is denoted as  where σ is the applied stress and A0
is a temperature-independent parameter. Thus, the equation cannot be directly employed in our analysis. For our strain-rate controlled tests, the exponent n was found to be temperature-dependent. Therefore, in order to calculate the activation energy Q, we have to make use of Equation (1) at two different temperatures T1 and T2,


where T1 < T2, ɛ̇ is the applied strain rate, σy1 and σy2 are the measured yield stresses and n 1 and n 2 are the calculated exponents. Note that the subscripts 1 and 2 always refer to two distinct temperatures T 1 and T2. The activation energy for the temperature range T1 < T < T2 is obtained from Equations (3) and (4):
* ɛ̇ is the applied strain rate in s–1.
(b) ɛ̇=4.2x10⁻⁶ s–1, (c) ɛ̇ = 1.1 x10⁻⁶s–1; (d) ɛ̇ = 4.4x10⁻⁵s–1;(e) mean value.

Figure 4 shows calculated activation energy as a function of density for three different temperature ranges. As can be seen for a mean density of 423 = 8 kg m–3 , the measured activation energy amounts to Q = 69 ± 5 kJ mol– 1 for –19°C < T <–11°C. This value agrees well with the data reported for self-diffusion of vacancies through the lattice in polycrystalline ice (Reference Barnes, Tabor and WalkerBarnes and others, 1971). In the temperature range – 5°C < T <–2°C, we measured Q = 201 ± 80 kJ mol–1 . This increase in the activation energy at high temperatures (T > –10°C) has also been reported for polycrystalline ice (Reference Budd and JackaBudd and Jacka, 1989; Reference MorganMorgan, 1991). Because the calculated activation energies for T > –11°C cannot be directly related to a single deformation process (e.g. self-diffusion of vacancies through the lattice), we speak of an apparent activation energy when Qcalculated ≠ Qselfdiffusion. For a mean density of 360±10 kg m–3 and a temperature range –19°C < T< –11°C, the apparent activation energy is Q = 66 ± 9 kJ mol–1. This value can also be related to self-diffusion in ice. Note, however, that as soon as the temperature exceeds –10°C, the apparent activation energy increases to a very large value of Q= 413–426 kJ mol–1. This amount does not reflect the behaviour expected of polycrystalline ice at this strain-rate and temperature range. Thus, for a density of ρ = 360 kg m–3 at temperatures above –4.8°C, we observed a clear decrease in the exponent n, i.e. n decreases from n = 3.6 to values smaller then 2.4 (Fig. 3). Finally, for a density of ρ = 272 ± 5 kg m–3 , at temperatures below–11°C, the calculated apparent activation energy Q = 182 ± 18 kJ mol– 1 does not agree with the values reported for self-diffusion in polycrystalline ice. For temperatures above –11°C we calculate a mean value of the apparent activation energy ranging between 328 and 424 kJ mol–1.
Temperature and density dependence of the apparent activation energy Q for different strain rates. (a) ɛ̇ =1.1 x 10⁻⁵ s–1; (b) ɛ̇ = 4.2 × 10⁻⁶ s-1; (c) ɛ̇ = 1.1 ×10⁻⁶s-1; (d) ɛ̇ = 4.4 × 10⁻⁵s-1; (e) mean value.

Discussion of the Test Results
The bulk behaviour of snow under load at small strains (ɛ̇ < 1–2%) is primarily due to the deformation mechanics of the granular ice skeleton, which is composed of polycrystalline ice. The ice skeleton carries the applied load in “force chains” (Reference VoytkovskiyVoytkovskiy 1977; Reference GublerGubler, 1978; Reference BrownBrown, 1980), which consist of snow grains connected at bonds (Fig. 5). In our tests, both grain-size and grain shape are similar for the whole range of densities. All of the snow selected was granular, with well-bounded grains of approximately 0.2 mm diameter. The main difference between high and low density can be seen by evaluating the coordination number N3, which describes the number of bonds per grain (Reference GublerGubler, 1978). This varies from N3 < 2.5 for ρ = 200 kg m–3 to N3 = 4.0 for a snow density ρ = 430 kg m–3 (Reference AlleyAlley, 1986). For low-density snow (ρ<~400 kg m–3) with low coordination numbers, the grains are not highly constrained and can move relative to each other in a shearing motion. Therefore, bonds in low-density snow are subjected to larger shearing stresses (Reference VoytkovskiyVoytkovskiy, 1977). In high-density snow, on the other hand, the grains are constrained and no longer free to move relative to each other. This means that the bonds between grains are mostly subjected to compressive deformation modes, i.e. the shearing stresses tend to vanish. Thus, high-density snow (ρ ≥ 430 kg m–3) shows in principle the same viscous behaviour as polycrystalline ice. The values of the exponent n and of the apparent activation energy Q agree well with the values for polycrystalline ice reported in previous works (Reference Barnes, Tabor and WalkerBarnes and others, 1971; Reference Weertman, Whalley, Jones and GoldWeertman, 1973; Reference Budd and JackaBudd and Jacka, 1989; Reference MorganMorgan, 1991). In conclusion, we found that snow with density ρ > ~400 kg m–3 has a power-law exponent n and activation energy Q similar to those of polycrystalline ice. The pre-exponent parameter A (Fig. 6) converges to the experimental values calculated using data of mono-axial compression tests on high-density firn and porous ice (659 kg m– 3 ≤ ρ ≤ 912 kg m–3) performed by Reference JackaJacka (1994). These data are also displayed in Figure 6 along with data for polycrystalline ice reported by Reference Barnes, Tabor and WalkerBarnes and others (1971).
The load-bearing “chain” concept of Reference GublerGubler (1978), with a detailed picture of a neck formed between grains (from Reference ColbeckColbeck, 1998). The grain boundary is also depicted.

Material parameter A (Equation (1) ) as afunction of density, for T = –12°C and for strain rates ranging between "s_=1.1610– 6 s–1 and "s_=4.4610– 5 s–1. The values are compared with (a) the A values for high-density firn and porous ice (659 kg m–3 ≤ ρ ≤ 912 kgm3) calculated using the test results of mono-axial compression tests (T = –3.3°C, octahedral shear stress = 0.2 MPa) reported by Reference JackaJacka (1994); the test results were normalized to T = –12°C using Q = 160 kJ mol–1; (b) the A values for polycrystalline ice calculated with the parameters A0, Q and n reported by Reference Barnes, Tabor and WalkerBarnes and others (1971) for T =–12° C.

Several explanations can be proposed to show why the behaviour of snow with a density p < ~ 400 kg m– 3 does not reflect the properties of polycrystalline ice. Reference Barnes, Tabor and WalkerBarnes and others (1971) provided a physical interpretation of the increase in activation energy in polycrystalline ice at T > –10°C. They concluded that the formation of a liquid layer at the triple point and grain-boundary sliding serve as accommodation processes for dislocation creep occurring within the ice grain. Further, they concluded that the calculated activation energy of 120 kJ mol–1 does not refer to a single specific creep process. However, they stress the fact that the creep behaviour of normal-grained polycrystalline ice (d ~1mm) is primarily determined by creep within the ice grains because the creep-rate stress dependence remains approximately cubic over the whole range of the investigated temperatures. In a more recent work, Goldsby and Kohlstedt (1997) attempt to show the influence of grain-size sensitive creep mechanisms on the flow of fine-grained ice produced in the laboratory (grain-size d in the range 3/ μm≤ d ≤90/μm) at strain rates ɛ̇ > 1 6 1 0 –8 s–1. Note that this kind of ice does not occur in naturally occurring ice or snow masses. They found an exponent n = 1.8 and an activation energy Q = 49 ±1kJ mol– 1 for strain rates between 10–8 s–1 ≤ ɛ̇ ≤ 10–6 s–1, grain-sizes in the range 2 6 μm ≤ d ≤ 4 0 μm in the temperature range –58°C < T < –37 °C. Goldsby and Kohlstedt concluded on the basis of the mechanical results and the microstructural investigations (environmental scanning electron microscopy (ESEM) micrograph analysis), that grain-boundary sliding accommodated by dislocation motion is the rate-limiting process in this n = 1.8 regime.
These works on polycrystalline ice can be used to help us understand the behaviour of snow. For the density range 2 0 0 kg m–3 ≤ ρ < ≤ 360 kg m–3 , we found
(i) A decrease in the power-law exponent n. With decreasing density, we found smaller n values (Fig. 3).
(ii) An increase in apparent activation energy with decreasing density (Fig. 4).
(iii) The nrho isolines (Fig. 3) are strongly dependent on temperature.
This behaviour is not similar to that of polycrystalline ice with grain-size typical of those found in the natural ice masses. Because the applied strains were small at moderate strain rates, effects like bond formation, bond breakage and large-scale inter-particle slip cannot be responsible for this behaviour. In the cited ice literature (Reference Barnes, Tabor and WalkerBarnes and others, 1971; Reference Goldsby and KohlstedtGoldsby and Kohlstedt, 1997), smaller n values and higher activation energies Q are related to deformation mechanisms occurring at or near the grain boundaries, which accommodate intra-granular dislocation creep (Reference Barnes, Tabor and WalkerBarnes and others, 1971) or represent the dominant creep mechanisms (Reference Goldsby and KohlstedtGoldsby and Kohlstedt, 1997). In light of this fact, we suppose that deformation mechanisms occurring at or near the grain boundary are more active in low-density snow. An indication that for low-density snow (ρ <200 kg m–3) grain-boundary sliding accommodated by dislocation motion is the rate-limiting process is that the value of n = 1.7 is approximately temperature-independent, as noted by Goldsby and Kohlstedt (1997), although at a much lower temperature range. These conclusions are also supported by the mechanical microstructural model of Reference VoytkovskiyVoytkovskiy (1977), which assumes that in low-density snow the grain-boundary region is subjected to larger shear stresses.
For high-density snow (ρ = 430 kg m–3) at temperatures ranging between –19°C ≤ T ≤ -2°C, we determined a temperature-independent exponent n = 3.6 and apparent activation energies according to the values found for normal-grained polycrystalline ice. Therefore, we suppose that for high-density snow, dislocation creep is the rate-controlling process.
Numerical Model
In order to apply the experimental results in numerical models (Reference Bartelt, Christen, Hutter, Wang and BeerBartelt and Christen, 1999; Bartelt and Lehning, 2002), the nrho and Qrho isolines (Fig. 3 and 4) must be parameterized. We found that

where


The material parameter A (Fig. 6), which is a function of density and temperature, is
A is a pre-exponential constant (Equation (1)) in (MPa–n s–1), which can be scaled to another temperature according to (Reference Sinha and Freder-kingSinha,1979)

where S1 2 is a shift function given by
Q is the activation energy for the corresponding temperature range T1 ≤ T ≤ T2 and density A and R is the gas constant; T1 and T2 are the temperatures (K). Note that the power-law relation for A (Equation (7)) is similar to the experimentally defined equations for unconfined compressive strength of high-density snow (500 kg m3 < ρ < 600 kg m3) reported by Reference Russell-Head, Budd and MooreRussell-Head and others (1984).
As shown in Figure 4, there is a large variation of the apparent activation energy Q with temperature and density. As noted by Reference Budd and JackaBudd and Jacka (1989) for polycrystalline ice, it is difficult to describe the temperature dependence of creep using the concept of activation energy. This undertaking is more difficult for snow, because its density dependence has to be taken into account. Our attempts to describe the variation of the apparent activation energy Q with temperature and density using a mathematical relationship valid for all temperatures and densities have failed. For the numerical model, we used the mean values of Q as reported in Figure 4. For intermediate densities, i.e. densities between those investigated, we linearly interpolated the experimental results.
The relationships presented above (Equations (6–9)) were employed in a plane-strain constitutive law for steady-state creep, used by Reference Bader and SalmBader and Salm (1990)

where

η is a stress-, density- and temperature-dependent viscosity

and m is the inverse of the viscous analogue of Poisson’s ratio.
The parameter m was set to m = ∞, i.e. the viscous analogue of Poisson’s ratio was set to zero, because only the deviatoric component of the stress tensor was considered. Thus, the strain directions ɛ̇ x, ɛ̇ y and γxy and the stress components σx, σy and τxy are assumed to be independent. This assumption accurately reflects the observed behaviour during confined and unconfined triaxial tests (Scapozza and Reference Bartelt and LehningBartelt, unpublished information): (1) The axial yield stress is independent of the applied confining pressure; (2) non-zero values of Poisson’s ratio occur only after a critical strain, denoting the onset of work hardening. This critical strain is reached after yielding. Furthermore, the assumption that the shear viscosity is related to the normal viscosity (ηshear = ηcompression/2) is hypothetical for the present application and must be proved by separate compression and shear tests under the same test conditions (temperature, strain rate and density).
The constitutive law given by Reference Bader and SalmBader and Salm (1990) was introduced into a finite-element model. In a first step, the stress state is determined from an elastic calculation. Then the steady-state strain rates are determined according to Equation (10). An application of the model is to determine stress and strain-rate concentrations around a weak layer of given length a (Fig. 7), as a function of overburden snow and temperature. Figure 8 plots the strain-rate concentration along the weak layer as a function of temperature. The simulations show that an increase in temperature of 9°C can produce an increase in the peak strain rate of about three orders of magnitude.
Weak-layer finite-element model. L=50m is the length of the slope, a = 8 m is the length of the weak layer and ϕ = 35° is the inclination. The snow cover is composed of two layers with d1 = d2 = 1.0 m and a very thin weak layer with ds → 0 m. Densities and temperatures are ρ 1 = 400 kg m–3,ρ2 = 200 kg m–3,T1 = –5°C. T2 varies between T2=–12°C and T2=–3°C.

Influence of the temperature on the strain-rate distribution along the weak layer. The properties of the simulated snowpack are shown in Figure 7.

A future development of the finite-element model will consider the viscoelastic behaviour of snow. Work-hardening effects due to large volume changes (20% strain) will also be considered. The present model does not consider age-hardening effects due to physical processes, such as grain metamorphism, occurring in the snowpack. The development of the microstructural snowpack properties over time is contained in a one-dimensional numerical snowpack model (Reference Lehning, Bartelt, Brown and E.Lehning and others, 1998; Bartelt and Lehning, 2002) which now also contains the viscosity formulation listed above.
Conclusions
We observed that for high-density snow (ρ > ~ 400 kg m–3), Glen’s law with material parameters similar to those for polycrystalline ice can be applied to model the viscous behaviour of snow. Conversely we found that Glen’s law with ice parameters cannot be applied to model snow with densities between 200 kg m–3 ≤ ρ ≤ 360 kgm–3. This complexity has not been taken into account in previous thermomechanical constitutive models. We believe that the large variation of the power-law parameters as a function of density is due to different deformation mechanisms occurring in the load-bearing ice skeleton. Although our constitutive model quantitatively fits the experimental results, it still cannot be applied to lower-density snow (ρ <~180 kg m–3) or other snow types (e.g. faceted grains or depth hoar). The fracture properties of snow, important for avalanche formation, have also not been investigated.
Future experiments with higher strain rates and different snow types are required in order to provide a complete picture of the mechanical behaviour of snow. These results are still lacking for a predictive understanding of avalanche formation.
Acknowledgements
The authors would like to thank the Swiss National Science Foundation for the financial support of this work.



