




1. Introduction
The pharmaceutical supply chain (PSC) plays a critical role in ensuring patient access to medicines and, over the past two decades, has evolved into a highly complex global network with several stakeholders, intricate logistical processes, and growing commercial relevance (González Peña et al., Reference González Peña, López Zavala and Cabral Ruelas2021). While this evolution has enhanced efficiency under stable conditions, it has also increased systemic vulnerabilities to exogenous shocks – such as pandemics, inflationary pressures, and international conflicts – that can disrupt medicine availability and continuity of care (Magar et al., Reference Magar, Doshi, Talib and Dalvi2023). The COVID-19 crisis brought these fragilities to the surface, exposing the limitations of existing risk mitigation strategies and challenging the resilience of pharmaceutical logistics in Europe and globally (Kholaif et al., Reference Kholaif, Gu, Tang and Salama2024; Raman et al., Reference Raman, Bluemke, Lüscher and Neubauer2022).
One of the most tangible consequences of reduced supply chain resilience is the occurrence of drug shortages. Drug shortages are recognised as a significant challenge for healthcare systems, undermining the timely and appropriate delivery of care across multiple therapeutic areas. Their impact extends beyond logistical constraints, affecting patient safety, clinical outcomes, and the overall sustainability of healthcare delivery (Phuong et al., Reference Phuong, Penm, Chaar, Oldfield and Moles2019). In severe cases, shortages may result in delayed treatment, suboptimal therapeutic choices, and even increased mortality. Healthcare providers are often compelled to use unfamiliar or substandard alternatives, thereby heightening the risk of medical errors and adverse drug events (Gatesman and Smith, Reference Gatesman and Smith2011). Supply chain disruptions – driven by a confluence of economic, operational, and regulatory factors – are among the primary determinants of these shortages (U.S Food and Drug Administration, 2019). Despite growing awareness, policy responses and mitigation strategies have often been fragmented, highlighting the need for more integrated and predictive approaches. Quite recently, at the European level, the European Medicines Agency (EMA) established the Executive Steering Group on Shortages and Safety of Medicinal Products to strengthen coordination and address supply chain disruptions more effectively (Executive Steering Group on Shortages and Safety of Medicinal Products (MSSG) Meetings, EMA). This group, created in the wake of COVID-19, plays a key role in enhancing Europe’s capacity to prevent and mitigate medicine shortages. As one key deliverable, a European platform has been developed to monitor drug shortages, enabling real-time tracking and a more coordinated response among EU member states (European Shortages Monitoring Platform, 2025). The central role that policymakers must take in dealing with drug shortages is increasingly recognised. This is particularly crucial for the development of effective policies that can prevent and mitigate future disruptions by strengthening the resilience and responsiveness of PSCs.
Existing research categorises the drivers of drug shortages into three key dimensions: (1) drug characteristics such as sterility and patent status, (2) market characteristics such as the presence of equivalents and the number of marketing authorisation holders (MAHs), and (3) regulatory aspects, including essential drug status (Francas et al., Reference Francas, Mohr and Hoberg2023). While empirical studies on the root causes of drug shortages are well-developed within the U.S literature (Dave et al., Reference Dave, Pawar, Fox, Brill and Kesselheim2018; Yang, Reference Yang2020; Yurukoglu et al., Reference Yurukoglu, Liebman and Ridley2017), European research remains limited, often focusing on COVID-19’s impact on resilience of specific drug supply chains (Finkenstadt and Handfield Reference Finkenstadt and Handfield2021; Francas et al., Reference Francas, Mohr and Hoberg2023; Sigala et al., Reference Sigala, Ioanna, Comes and Kovács2022; Vega et al., Reference Vega, Arvidsson and Saïah2023). Most studies essentially rely only on statements made by MAHs, while few have analysed the likelihood of shortages in relation to the above characteristics. This gap has led to calls for robust, data-driven early warning systems to improve shortage mitigation policies (Francas et al., Reference Francas, Mohr and Hoberg2023), which necessitates understanding the factors that best predict shortages.
This study contributes to the existing literature by presenting novel empirical evidence from Italy. In this country, MAHs are legally required to notify the national competent authority in advance of any impending drug shortage and its underlying causes. This regulatory approach stands in contrast to the voluntary reporting frameworks still prevalent across much of Europe. Francas et al. (Reference Francas, Mohr and Hoberg2023), for instance, report that only 16% of drugs in their German sample were subject to any form of voluntary reporting, underscoring the limitations of non-compulsory systems. Nevertheless, even in countries with mandatory reporting, such as Italy and Finland, challenges persist in terms of data to allow for comparisons. As an example, although shortage reporting is mandatory in both countries, Finland does not require the reasons for shortages to be reported, and such information is available in only 11.2% of cases (Heiskanen et al., Reference Heiskanen, Ahonen, Karttunen, Kanerva and Timonen2015; Sarnola and Linnolahti, Reference Sarnola and Linnolahti2019).
To date, research on drug shortages in Europe and the U.S. has typically adopted either an active-ingredient level aggregation or highly granular product-level analyses. While the former fails to distinguish between pharmaceutical forms and dosages, thus limiting the capacity to detect equivalents or track formulation-specific risks, the latter often lacks market context and may overestimate the prevalence of shortages. This evidence gap has prompted increasing interest in data-driven early warning systems to support proactive shortage mitigation strategies (Francas et al., Reference Francas, Mohr and Hoberg2023). However, the development of such systems requires a clearer understanding of the structural, economic, and regulatory factors that predict shortage risk, an area where empirical evidence, particularly in the European context, remains limited. This study addresses this gap by providing systematic evidence from Italy, combining detailed shortage notifications with drug, economic and regulatory characteristics.
This study offers a comprehensive analysis of national-level trends and risk factors using Italian shortage data. First, we describe the longitudinal evolution of reported shortages across drug classes and the most common causes declared by MAHs. Second, we estimate the likelihood of shortages based on a range of predictors, including (a) drug and regulatory characteristics such as patent status and essential drug designation; (b) market dynamics such as the presence of equivalents and recent market entries; (c) commercial factors such as the relative price and age of drugs.
In line with the existing literature, these dimensions are expected to influence shortage risk, as previous studies consistently show that sterile products, high market concentration, and lower prices are associated with a higher probability of shortages, although the strength of these relationships may vary depending on the context (Fox et al., Reference Fox, Sweet and Jensen2014; Hernandez et al., Reference Hernandez, Sullivan, Hansen and Fendrick2024; Musazzi et al., Reference Musazzi, Di Giorgio and Minghetti2020; Shukar et al., Reference Shukar, Zahoor and Hayat2021).
Third, we explore which distribution channels such as community, dual-dispensed, and hospital are most vulnerable to supply disruptions, providing evidence-based insights for targeted policy interventions in Italy.
While grounded in national data, our findings yield broader insights with direct policy relevance. The Italian case offers a concrete example of how mandatory reporting frameworks can improve data availability and support evidence-based decision-making. By identifying risk factors and vulnerable distribution channels, our analysis informs the design of risk-based surveillance systems, prioritisation criteria for regulatory oversight, and early warning mechanisms. Moreover, the refined unit of analysis – accounting for pharmaceutical form and dosage – enables more targeted interventions on specific drug categories. In doing so, this study contributes to ongoing international efforts to strengthen the resilience of pharmaceutical supply chains and safeguard equitable and timely access to medicines across health systems.
2. Study setting/institutional setting
Italy’s National Health Care System (NHS), established in 1978 and modelled after the Beveridge framework, ensures universal health coverage as an essential right for all citizens, regardless of employment status or financial situation. The system is built on the principles of universal access, solidarity, and equity, providing a broad range of services, including primary care, hospital services, rehabilitation, preventive health measures, public health initiatives, maternal and child health care, mental health services, veterinary care, and pharmaceutical assistance (Ricciardi and Tarricone, Reference Ricciardi and Tarricone2021).
Within this institutional framework, Italy also plays a crucial role in the production and export of pharmaceutical products at the European and global levels. In recent years, Italy has consistently ranked among the leading pharmaceutical manufacturers in Europe. It is one of the leading exporters of medicinal products, with pharmaceutical exports accounting for a significant and growing share of total manufacturing exports. In 2024, the value of pharmaceutical production in Italy exceeded €50 billion, with exports accounting for the majority of production, reflecting the strong industrial base, high specialisation, and international integration of the Italian pharmaceutical sector (Farmindustria, 2025; Rapporto ICE 2024–2025, 2025). The Italian Medicines Agency (AIFA) acts as the national regulatory authority, overseeing drug authorisations, pricing, reimbursement decisions, and monitoring of pharmaceutical expenditure. AIFA also plays a central role in managing drug shortages, requiring MAHs to notify anticipated supply interruptions at least four months in advance. The agency publishes updated shortage lists twice weekly and can authorise imports of equivalent drugs when necessary (AIFA, 2025). In Italy, a shortage is defined as any situation in which a patient cannot access medicines due to causes attributable to the MAH (AIFA, s.d., Reference Di Giorgio and Derossi2024).
2.1. Drug distribution and reimbursement
Medicines in Italy can be dispensed with or without a prescription. For drugs reimbursed by the NHS, a medical prescription is required. AIFA’s Scientific and Economic Commission (CSE) classifies drugs, assesses clinical effectiveness and safety, negotiates prices, and allocates drugs to specific reimbursement and distribution categories. Price and reimbursement negotiations are conducted centrally between AIFA and the MAH, based on criteria including therapeutic value, comparative effectiveness, disease burden, and expected budget impact, often complemented by managed entry agreements and financial or outcome-based contracts (Jommi and Minghetti, Reference Jommi and Minghetti2015).
For this study, we distinguish between three key dispensing channels:
-
Community drugs (Class A): Fully reimbursed by the NHS and primarily distributed through community pharmacies (Garattini et al., Reference Garattini, Curto and Padula2016).
-
Hospital drugs (Class H): NHS-covered but restricted to hospital use and distributed through hospital pharmacies and other healthcare facilities (Garattini et al., Reference Garattini, Curto and Padula2016).
-
Dual-dispensed drugs (Class A-PHT): Though reimbursed as Class A, these drugs are listed in the hospital-territory formulary. They are dispensed via hospitals, healthcare facilities, and community pharmacies under the ‘distribution on behalf’ model (distribuzione per conto, DPC), in which regional health authorities purchase and distribute the drugs via agreements with local pharmacy associations.
Class C drugs fall outside the scope of this study. These are not reimbursed by the NHS unless in specific conditions and may be prescription-only or OTC. Upon market authorisation, AIFA assigns each product a unique MA code (AIC) for national traceability. Centrally approved EU medicines also include European identification codes, ensuring consistency within the Italian registry.
3. Data and methods
3.1. Study design
This study employs a retrospective cohort design to investigate the drivers of drug shortages in Italy between January 2018 and December 2023. Among the objectives of this paper is to examine how drug characteristics, market dynamics, and regulatory factors influence the occurrence of shortages across various drug classes. The unit of observation is the ATC7-year-month, representing groups of drugs with the same active ingredient, pharmaceutical form, and dose, allowing to track shortages at the substitution level.
To classify drugs at this level, we use the Anatomical Therapeutic Chemical (ATC) classification system, developed by the World Health Organization (WHO). The ATC system organises drugs hierarchically based on their target organ/system, along with their therapeutic and pharmacological properties. The hierarchy is divided into levels of increasing specificity. The first level identifies the main anatomical or pharmacological group, such as the cardiovascular system. The second level defines the pharmacological or therapeutic subgroup, for example, antihypertensives. The third and fourth levels specify the target and mechanism of action, such as beta-blockers, while the fifth level identifies the specific chemical substance, such as metoprolol. A recent expansion to the ATC structure in Italy introduced a seventh level, allowing classification by both pharmaceutical form (Level 6, e.g., tablet or injection) and specific dose (Level 7) (DECRETO 14 aprile 2005 – Criteri di classificazione dei farmaci attraverso la classificazione anatomico-chimico terapeutica (ATC) complementare, 2005). By incorporating ATC7, this study precisely identifies groups of substitutable drugs, ensuring that shortages are examined at a level that reflects real-world substitution possibilities.
A generalised linear mixed model (GLMM) with a binomial distribution and logit link function is used to analyse the nested structure of the data. This model includes fixed effects for specific drug characteristics and random effects to account for unobserved variability at the chemical substance level, adjusting for correlations among drugs within the same therapeutic group to improve the reliability of the estimates.
3.2. Data sources
This study uses two primary datasets to capture drug availability and shortages in Italy from January 2018 to December 2023 at the group of substitutes-year-month level.
The first dataset, provided by Gallery-Farma Dati (FarmaDati, 2024), includes all community, hospital, and dual-dispensed drugs marketed in Italy, forming the core population for this study. It allows us to track market entry dates, product characteristics (e.g. price changes), and authorisation status.
The prices used in the analysis refer to public prices recorded in the FarmaDati database and do not correspond to the net costs actually incurred by the NHS. In particular, these values do not account for reserved discounts, negotiation mechanisms, or specific purchasing conditions (e.g., tenders). Still, they represent the only systematically observable and comparable price parameter among the drugs included in the study.
Drugs typically paid for out of pocket (Class C) were excluded from the analysis, as they are generally not covered by the NHS and follow distinct price and supply dynamics (Folino-Gallo et al., Reference Folino-Gallo, Montilla, Bruzzone and Martini2008). In the community setting, these medicines are usually paid for directly by patients, except in specific clinical circumstances or under ad hoc regional reimbursement schemes, whereas when administered during hospital stays they are purchased by healthcare facilities through public tenders. Moreover, Class C drugs are not subject to centralised price and reimbursement negotiations by AIFA’s CSE: their public price is freely set by the MAH and may be increased every odd-numbered year. Given that this study relies on published public prices, and considering the absence of negotiated pricing and the resulting differences in supply incentives, the price and shortage dynamics of Class C drugs are not fully comparable with those of Class A and Class H medicines. For these reasons, Class C drugs were excluded from the analytical sample (DECRETO-LEGGE 27 maggio, 2005, n. 87 – Normattiva).
Tracking drugs over time presented challenges due to AIC (marketing authorisation code) changes, which occur for reasons such as shifts in MAHs while the underlying product remains unchanged. To ensure longitudinal consistency, we integrated AIFA data, linking different AICs associated with the same product over time. Each drug was assigned a unique identifier, allowing us to track authorisation history and previous shortage occurrences, even when its AIC changed. If data on market exit was missing, we assumed a smooth transition between AICs, using the start date of a new AIC as the end date of the previous one. When no subsequent AIC or explicit exit date was available, we used the last system update as a proxy for market exit. These system updates are recorded whenever drug information is changed, including changes in marketing status. While this approach may slightly overestimate market activity, it allowed us to retain an additional 3,729 products across 1,109 groups of substitutes that would otherwise lack complete market validity data.
The second dataset, provided by AIFA, consists of twice-weekly updates that track ongoing drug shortages. These reports, compiled into a shortage panel at the AIC-year-month level, allowed us to construct a binary indicator for each product month, marking whether a drug was reported as in shortage.
To ensure data consistency, we excluded drugs not on the market during the observation period, drugs from ATC class V, vaccines, immunoglobulins, and those with missing or zero price data. ATC class V was excluded as it includes diverse products, such as allergens, contrast agents, and oxygen, which differ substantially from other drug categories. Immunoglobulins were excluded due to frequent market withdrawals and replacements through toll manufacturing, by which Italy produces plasma-derived medicines from donor plasma. Vaccines were also excluded, as they are generally not comparable to other drugs, typically belong to class C, and are not dispensed through pharmaceutical assistance but through the prevention department.
After data cleaning and aggregation, the final dataset consists of an unbalanced panel covering 17,619 unique drugs across 3,013 groups of substitutes available in Italy during the study period.
3.2.1. Variable definitions
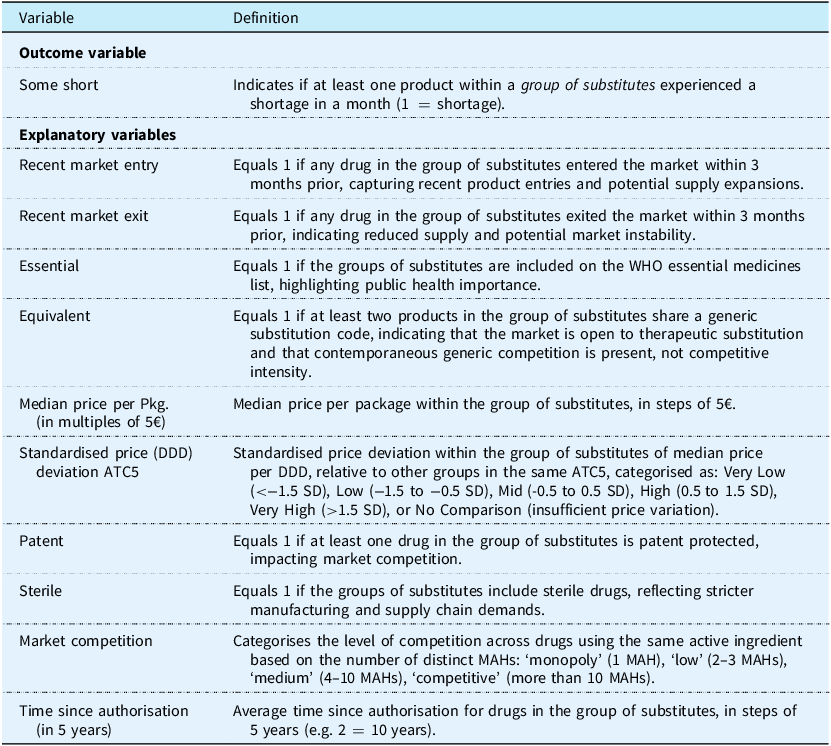
The primary outcome variable is a binary indicator that captures whether at least one product within a group of substitutes experienced a shortage in a given month. A comprehensive set of explanatory variables accounts for market dynamics, drug characteristics, and temporal effects. Table 1 provides definitions of the key variables used in the analysis.
Key variables and descriptions

Table 1. Long description
A table with two columns: Variable and Definition. The table defines key variables used in the analysis of product shortages within groups of substitutes. The table has 12 rows, each defining a different variable. Row 1: Outcome variable, Some short, Indicates if at least one product within a group of substitutes experienced a shortage in a month (1 = shortage). Row 2: Explanatory variables, Recent market entry, Equals 1 if any drug in the group of substitutes entered the market within 3 months prior, capturing recent product entries and potential supply expansions. Row 3: Explanatory variables, Recent market exit, Equals 1 if any drug in the group of substitutes exited the market within 3 months prior, indicating reduced supply and potential market instability. Row 4: Explanatory variables, Essential, Equals 1 if the groups of substitutes are included on the W H O essential medicines list, highlighting public health importance. Row 5: Explanatory variables, Equivalent, Equals 1 if at least two products in the group of substitutes share a generic substitution code, indicating that the market is open to therapeutic substitution and that contemporaneous generic competition is present, not competitive intensity. Row 6: Explanatory variables, Median price per Pkg. (in multiples of 5€), Median price per package within the group of substitutes, in steps of 5€. Row 7: Explanatory variables, Standardised price (D D D) deviation A T C 5, Standardised price deviation within the group of substitutes of median price per D D D, relative to other groups in the same A T C 5, categorised as: Very Low (<−1.5 S D), Low (−1.5 to −0.5 S D), Mid (−0.5 to 0.5 S D), High (0.5 to 1.5 S D), Very High (>1.5 S D), or No Comparison (insufficient price variation). Row 8: Explanatory variables, Patent, Equals 1 if at least one drug in the group of substitutes is patent protected, impacting market competition. Row 9: Explanatory variables, Sterile, Equals 1 if the groups of substitutes include sterile drugs, reflecting stricter manufacturing and supply chain demands. Row 10: Explanatory variables, Market competition, Categorises the level of competition across drugs using the same active ingredient based on the number of distinct M A H S: ‘monopoly’ (1 M A H), ‘low’ (2–3 M A H S), ‘medium’ (4–10 M A H S), ‘competitive’ (more than 10 M A H S). Row 11: Explanatory variables, Time since authorisation (in 5 years), Average time since authorisation for drugs in the group of substitutes, in steps of 5 years (e.g., 2 = 10 years).
Two variables were modelled as categorical predictors because a linear specification would have imposed restrictive assumptions on relationships that are expected to be non-linear. First, market competition was proxied by the number of distinct MAHs, as product-level market shares were not available. We therefore classified markets into concentration regimes: monopoly (1 MAH), low competition (2–3 MAHs), medium competition (4–10 MAHs), and competitive markets (>10 MAHs). This specification distinguishes monopoly from multi-supplier markets and allows for threshold effects in competitive structure. Second, standardised price deviation was modelled using symmetric standard deviation bands around the ATC5-specific median price per DDD: very low (<−1.5 SD), low (−1.5 to −0.5 SD), mid (−0.5 to 0.5 SD), high (0.5 to 1.5 SD), very high (>1.5 SD), and no comparison. This approach captures relative price outliers within the same chemical substance group and provides a non-parametric way to account for non-linear price effects.
3.3. Statistical analysis
3.3.1. Model selection
To estimate the likelihood of drug shortages, we employed a GLMM with a binomial distribution and logit link function. The GLMM was chosen to appropriately account for the hierarchical structure of the data, where drugs within the same therapeutic class share common characteristics. A standard logistic regression model would not capture unobserved heterogeneity within drug classes, while a fixed-effects model would eliminate between-group variation, making the GLMM a more suitable choice.
The data is nested at two levels: groups of substitutes, representing drugs with the same active ingredient, pharmaceutical form, and dose, are nested within ATC5 groups, which group drugs by chemical substance. A random intercept was included for the ATC5 level, capturing unobserved heterogeneity at the chemical substance level. This ensures that drugs sharing the same active ingredient may face similar baseline market and supply risks while allowing for differences in competition, pricing, and regulatory influences at the drug level.
3.3.2. Model specification
The GLMM used to estimate the probability of drug shortages is specified as follows:
 $${\rm logit}\left({\rm P}\left(some\_ \textit{short}_{it}=1\right)\right)=\beta _{0}+X_{it}\beta +Z_{it}\delta +\sum _{t}\gamma _{t}+\mu _{atc5[i]}$$
where some_short
it
is a binary indicator of whether at least one product in a group of substitutes i experienced a shortage in month t. The term logit(P(some_short
it
=1)) represents the log-odds of a shortage occurring. The model intercept is given by β
0, while X
it
captures the fixed effects for drug characteristics, market dynamics, and regulatory factors, as defined in Table 2. The vector Z
it
captures interaction effects, allowing for heterogeneous relationships between key explanatory variables. The year-fixed effects
 $$\sum\nolimits_t {{\gamma _t}}$$
control for time-varying trends. The model includes random intercept at the ATC5 level, μ
atc5[i] ∼ N(0, σ
μ
2), accounting for clustering within chemical substance groups to capture that drugs sharing the same active ingredient face comparable market and supply risks.
Distribution of unique shortage episodes by reason and drug class

Table 2. Long description
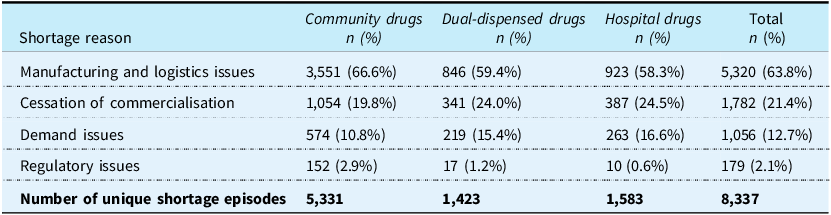
A table with four rows and five columns detailing the distribution of unique shortage episodes by reason and drug class. The columns are labeled Shortage reason, Community drugs n (%), Dual-dispensed drugs n (%), Hospital drugs n (%), and Total n (%). The rows are labeled Manufacturing and logistics issues, Cessation of commercialisation, Demand issues, Regulatory issues, and Number of unique shortage episodes. Each row provides the number and percentage of shortage episodes for each drug class and the total. Notable trends include the highest percentage of shortages due to manufacturing and logistics issues across all drug classes, and the lowest percentage due to regulatory issues.
Notes: This table presents the number of unique drug shortage episodes by reason across three drug classes: Community drugs, Dual-dispensed drugs, and Hospital drugs. The percentages indicate the proportion of manufacturer-reported reason for shortage and grouped by the authors within each drug class. ‘Total’ reflects the cumulative count and percentage across all classes. The analysis is based on unique episodes identified at the AIC (authorisation code number) level, covering a total of 8,337 shortage episodes across 17,619 unique drugs (AICs).
To account for potential effect modifications, we include interaction terms between (1) log median price and time since authorisation to capture whether a drug’s price effect on shortage risk depends on its market age, (2) patent status and sterility to examine whether the higher manufacturing complexity of sterile drugs moderates the impact of patent protection, and (3) patent status and time since authorisation to evaluate whether the influence of patent protection on shortages changes as drugs age.
3.3.3. Model fitting
The model was estimated using the glmer function from the lme4 package in R (Bates et al.,Reference Bates, Mächler, Bolker and Walker2015). To address convergence issues, we employed the bobyqa optimiser, with a maximum of 2,000,000 function evaluations to ensure accurate estimation. All models presented in this study converged successfully. Likelihood ratio tests were used to assess the significance of both fixed and random effects, and model diagnostics were conducted to ensure a good fit and appropriate convergence. Model fit was evaluated using the Akaike Information Criterion (AIC), and multicollinearity was tested using Variance Inflation Factors (VIFs), with all VIFs below the threshold of 5, indicating no significant multicollinearity issues that could distort the model estimates.
To ensure the robustness of the results, sensitivity analyses were conducted by re-specifying the model with alternative definitions of key variables, such as recent entry and recent exit. These alternative specifications were tested to evaluate the consistency of the findings.
3.4. Ethical considerations
No human subjects were involved in the data underlying this study, and all sources are publicly available. As such, no formal ethical approval was required.
3.5. Use of artificial intelligence
During the preparation of this manuscript, the authors used ChatGPT (OpenAI) to support language editing and improve the clarity and readability of the text. The authors reviewed and edited all AI-assisted content and take full responsibility for the accuracy, integrity, and originality of the final manuscript. Artificial intelligence tools were not used for data collection, statistical analysis, interpretation of the results, or generation of scientific conclusions.
4. Results
Table A1 in the Appendix provides a pooled summary of drug characteristics and shortage patterns at the group-of-substitutes level, divided by distribution channel (community, dual-dispensed, and hospital). This descriptive overview offers key contextual insights into the structural features of the sample and the frequency of shortages observed across drug classes.
Across the study period, 60% of groups of substitutes experienced at least one shortage episode. Community drugs were the most affected, with 70% of groups of substitutes experiencing shortages, followed by dual-dispensed (53%) and hospital drugs (51%). Community drugs also had the highest incidence of repeated shortages, with 38% of groups of substitutes experiencing two or more episodes, compared to 22% in both dual-dispensed and hospital drugs. Severe shortages, defined as shortages in which all products within a group of substitutes were simultaneously unavailable, affected 27% of groups of substitutes among community drugs, 24% among dual-dispensed drugs, and 26% among hospital drugs.
Figure 1 illustrates the monthly trends in drug shortages by class, showing the proportion of groups of substitutes affected. The relative share of shortages has increased almost linearly across all classes. Severe shortages – where all drugs within groups of substitutes are reported as short – remain stable for community drugs but have shown a steady rise in hospital drugs, with a sharp increase for dual-dispensed drugs since mid-2022. A noticeable peak in reported shortages for community drugs is observed in 2019, coinciding with the introduction of a regulatory change that strengthened advance notification requirements for MAHs, including the introduction of fines for late reporting. Reporting of shortages was already mandatory prior to this reform; the change primarily affected the timing of notification rather than the obligation to report. Accordingly, part of the increase in reported shortages likely reflects earlier and more precautionary reporting rather than a discrete change in underlying supply conditions.
Trends in drug shortages over time by drug class.
Notes: This figure presents the monthly relative share of groups of substitutes affected by shortages, categorised by drug class. “Total Shortages” represents the proportion of groups of substitutes experiencing at least one shortage, while “Severe Shortages” reflects cases where all drugs within groups of substitutes are reported as short. The bars depict “New Shortages,” with positive values (in dark red) indicating that more shortages started than were resolved, and negative values (in dark green) indicating that more shortages were resolved than started.

Table 2 displays the distribution of drug shortage reasons declared by MAHs across the three drug classes. Manufacturing and logistics issues are the leading cause, accounting for 63.8% of all cases, particularly affecting community drugs (66.6%). The cessation of commercialisation – both temporary and permanent – is the second most common reason (21.4%), more prevalent in hospital (24.5%) and dual-dispensed drugs (24.0%) than in community settings (19.8%). Demand-related issues represent 12.7% of all shortages, with higher incidence in hospital drugs (16.6%), while regulatory problems remain marginal (2.1%), slightly more frequent in community drugs (2.9%). In absolute terms, community drugs report the highest number of distinct shortage episodes (5,331), followed by hospital (1,583) and dual-dispensed drugs (1,423).
4.1. Predicted probabilities of shortages
This section presents the regression results on the likelihood of drug shortages across community, dual-dispensed, and hospital drugs, focusing on the effects of drug and regulatory characteristics, market dynamics, competition, price, and drug age. Tables summarise odds ratios (OR) and predicted probabilities (PP) with 95% confidence intervals, offering insights into how these factors vary across drug classes.
4.1.1. Baseline shortage probabilities
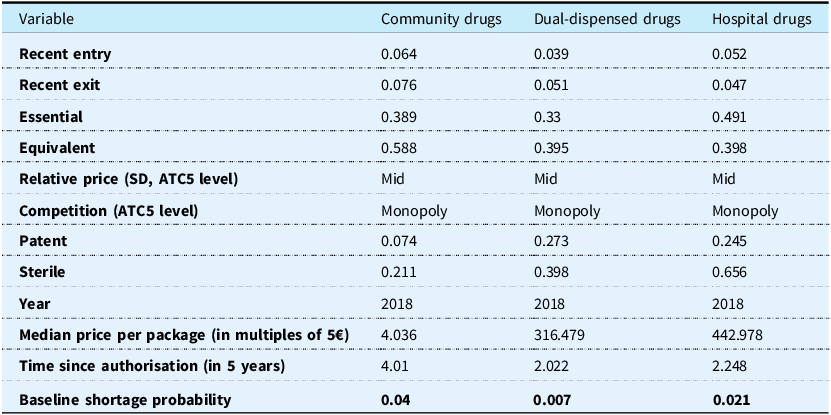
Table A2 in the Appendix presents the baseline predicted probabilities of drug shortages under reference conditions. Community drugs show the highest baseline shortage probability (0.040), followed by hospital drugs (0.021), while dual-dispensed drugs demonstrate the lowest risk (0.007). These probabilities were estimated using average values for key explanatory variables – such as drug characteristics and regulatory factors – under standardised conditions, including mid-range pricing and a monopoly market structure, based on 2018 data.
4.1.2. Influence of drug and regulatory characteristics
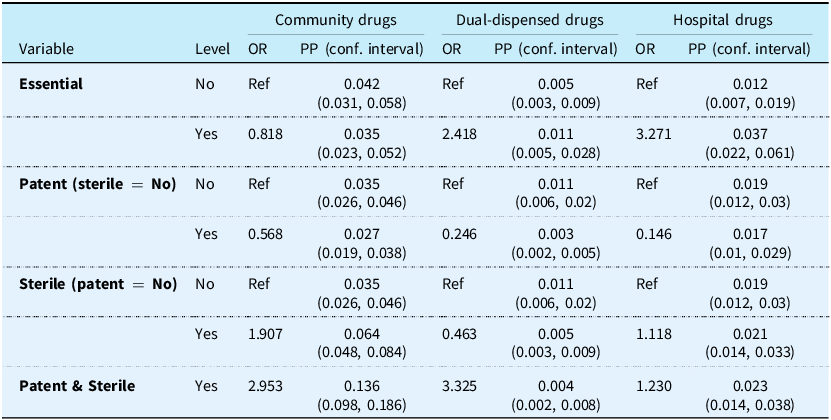
Table 3 summarises the impact of drug characteristics on shortage probabilities. Essential medicine status showed heterogeneous associations across drug classes. The association was not statistically significant for community or dual-dispensed drugs, whereas a significantly higher shortage risk was observed for hospital drugs (OR = 3.271; PP = 0.037 [0.022, 0.061]).
Impact of drug and regulatory characteristics on shortage probability

Table 3. Long description
The table presents the impact of drug characteristics on shortage probabilities for community drugs, dual-dispensed drugs, and hospital drugs. It has four rows and three columns, including column headers and row labels. The columns are labeled ‘Community drugs’, ‘Dual-dispensed drugs’, and ‘Hospital drugs’, each with sub-columns for OR and PP (confidence interval). The rows are labeled by variables: Essential, Patent (sterile = No), Sterile (patent = No), and Patent & Sterile. Each row provides data for different levels of these variables. For example, under the ‘Essential’ variable, the ‘No’ level shows OR and PP values for each drug class, and the ‘Yes’ level shows different OR and PP values. The table captures the varying effects of essential drug status and other characteristics on shortage probabilities across different drug classes.
Notes: This table displays the odds ratios (OR) and predicted probabilities (PP), with 95% confidence intervals, for the impact of specific drug characteristics on shortage probabilities across the three drug classes.
Among non-sterile products, patent protection was associated with lower shortage odds across all classes. Sterility was associated with higher shortage odds among community drugs and lower odds among dual-dispensed drugs, whereas the association was not statistically significant among hospital drugs. The positive Patent × Sterile interaction observed for community and dual-dispensed drugs indicates that the effect of patent protection varied according to sterility status. The interaction was not statistically significant for hospital drugs.
4.1.3. Influence of market dynamics and competition
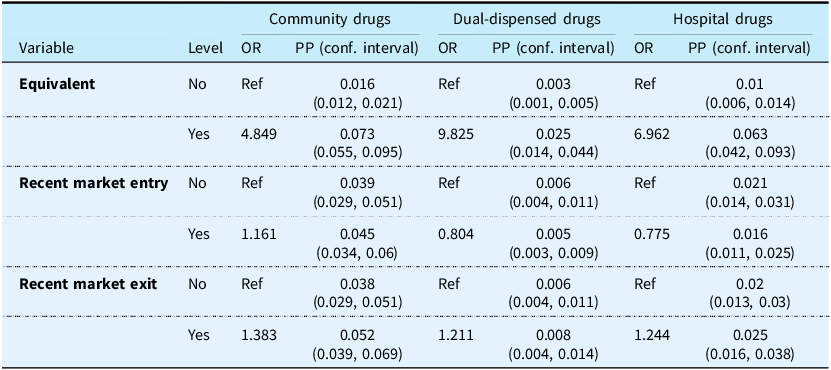
As shown in Table 4, the availability of equivalent drugs is consistently associated with increased shortage risk across all drug classes, with the strongest effect observed in dual-dispensed (OR = 9.825; PP = 0.025 [0.014–0.044]), followed by hospital (OR = 6.962; PP = 0.063 [0.042–0.093]) and community drugs (OR = 4.849; PP = 0.073 [0.055–0.095]). Because the availability of equivalent drugs captures regime status rather than the number of suppliers, we interpret its coefficient as the effect of operating in a substitutable (generic) market, holding supplier concentration constant via MAH classes. Recent market entries are linked to lower shortage probabilities in dual-dispensed (OR = 0.804; PP = 0.005 [0.003–0.009]) and hospital drugs (OR = 0.775; PP = 0.016 [0.011–0.025]), but not in community settings, where the association is slightly positive (OR = 1.161; PP = 0.045 [0.034–0.060]). In contrast, market exits increase the risk of shortages across all settings, with ORs ranging from 1.211 (dual-dispensed) to 1.383 (community).
Impact of market dynamics on shortage probability

Table 4. Long description
Table 4 compares the impact of market dynamics on shortage probability for community drugs, dual-dispensed drugs, and hospital drugs. The table has four rows and three columns. Column headers are Community drugs, Dual-dispensed drugs, and Hospital drugs. Each column is further divided into OR and PP (conf. interval). Row labels are Variable, Level, Equivalent, Recent market entry, and Recent market exit. Each row provides values for OR and PP (conf. interval) for the three drug classes. Notable trends include higher odds ratios and predicted probabilities for drugs with recent market entry and exit compared to those without.
Notes: This table displays the odds ratios (OR) and predicted probabilities (PP), with 95% confidence intervals, for the impact of market dynamics on shortage probabilities across the three drug classes.
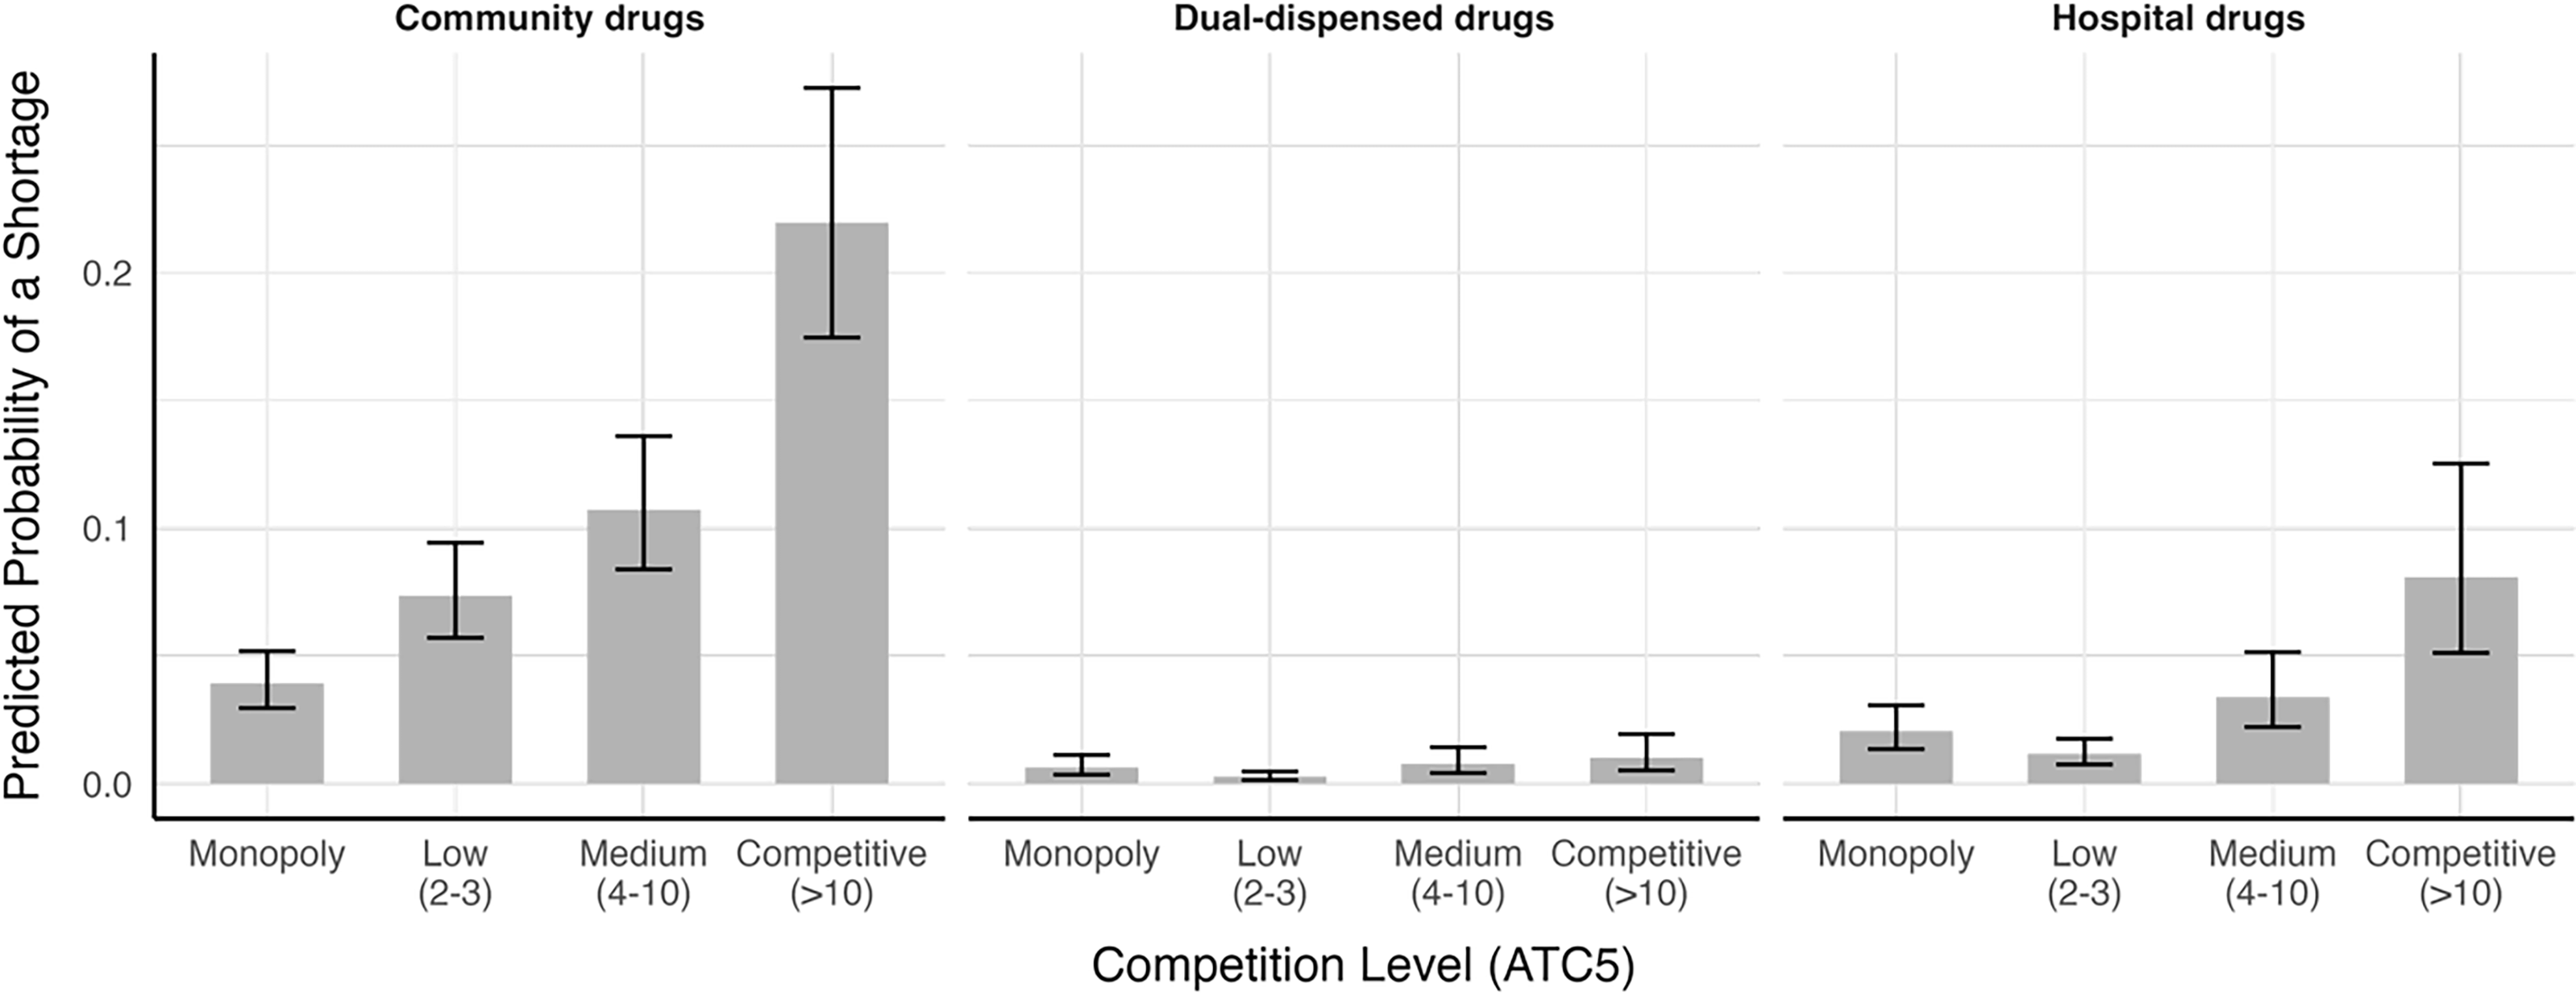
The relationship between market competition and shortage risk was non-linear and differed across distribution channels. Among community drugs, shortage probability generally increased with the number of MAHs. Among dual-dispensed and hospital drugs, the 2–3 MAH category was associated with lower shortage odds than monopoly, whereas shortage risk increased in the more competitive categories.
Predicted probability of shortages at varying levels of competition.

These findings underscore the heterogeneous impact of market structure on shortage vulnerability, highlighting the need for differentiated policy responses tailored to the competitive environment of each drug class.
4.1.4. Influence of price and drug age
We investigate two distinct but interrelated aspects of price and their impact on drug shortages. First, we assess how a drug’s price relative to other drugs containing the same active ingredient influences shortage risks. Second, we analyse the role of the absolute package price and how it interacts with the drug age in shaping the probability of shortages.
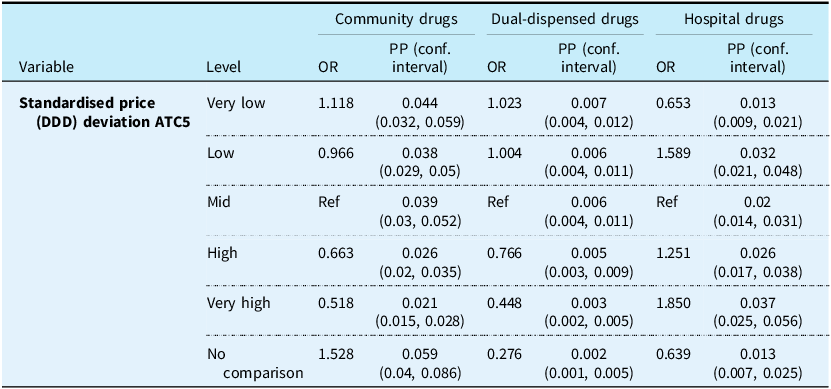
To understand how relative pricing affects shortages, we analyse price deviations across groups of substitutes, measured relative to the median price per defined daily dose (DDD) among drugs containing the same active ingredient (Table 5).
Impact of relative price levels on shortage probability

Table 5. Long description
The table has 6 rows and 10 columns. The columns are labeled as follows: Variable, Level, Community drugs OR, Community drugs PP (conf. interval), Dual-dispensed drugs OR, Dual-dispensed drugs PP (conf. interval), Hospital drugs OR, Hospital drugs PP (conf. interval). The rows are labeled with the following levels: Very low, Low, Mid, High, Very high, No comparison. The table presents odds ratios (OR) and predicted probabilities (PP) with 95% confidence intervals for the impact of relative price levels of drugs containing the same active ingredient on shortage probabilities across three drug classes: Community drugs, Dual-dispensed drugs, and Hospital drugs. Row 1: Standardised price (DDD) deviation ATC5, Very low, 1.118, 0.044 (0.032, 0.059), 1.023, 0.007 (0.004, 0.012), 0.653, 0.013 (0.009, 0.021). Row 2: Standardised price (DDD) deviation ATC5, Low, 0.966, 0.038 (0.029, 0.05), 1.004, 0.006 (0.004, 0.011), 1.589, 0.032 (0.021, 0.048). Row 3: Standardised price (DDD) deviation ATC5, Mid, Ref, 0.039 (0.03, 0.052), Ref, 0.006 (0.004, 0.011), Ref, 0.02 (0.014, 0.031). Row 4: Standardised price (DDD) deviation ATC5, High, 0.663, 0.026 (0.02, 0.035), 0.766, 0.005 (0.003, 0.009), 1.251, 0.026 (0.017, 0.038). Row 5: Standardised price (DDD) deviation ATC5, Very high, 0.518, 0.021 (0.015, 0.028), 0.448, 0.003 (0.002, 0.005), 1.850, 0.037 (0.025, 0.056). Row 6: Standardised price (DDD) deviation ATC5, No comparison, 1.528, 0.059 (0.04, 0.086), 0.276, 0.002 (0.001, 0.005), 0.639, 0.013 (0.007, 0.025).
Notes: This table displays the odds ratios (OR) and predicted probabilities (PP), with 95% confidence intervals, for the impact of relative price levels of drugs containing the same active ingredient on shortage probabilities across the three drug classes.
For community drugs, the very-low-price category showed a slightly higher estimated shortage risk than the mid-price category, although the difference was not statistically significant. Drugs priced substantially below their group’s median (very low) face a slightly increased shortage risk, with an OR of 1.12 (PP: 0.044). In contrast, drugs priced above the median experience significantly lower shortage risks. Those in the high category have an OR of 0.66 (PP: 0.026), while drugs in the very high category, which are the most expensive within their group, face the lowest shortage probability (OR: 0.52, PP: 0.021). These findings suggest that higher prices within a given active ingredient group are associated with greater supply stability, while cheaper alternatives may be more vulnerable to disruptions. Notably, drugs for which no price comparison is possible within their group show a substantially higher shortage risk (OR: 1.53, PP: 0.059).
For dual-dispensed drugs, shortage probabilities remained relatively low overall, and the association varied across relative-price categories. When compared to other drugs with the same active ingredient, higher-priced drugs are associated with a notably more stable supply, with drugs in the very high category facing only half the shortage risk of those priced at or below the median (OR: 0.45, PP: 0.003). Interestingly, drugs with no within-group price comparison exhibit the lowest shortage risk (OR: 0.28, PP: 0.002), likely capturing effects of monopoly markets.
For hospital drugs, any deviation from the median price, except for those priced significantly below the median, increases the probability of shortages. Drugs in the very low-price category face fewer shortages (OR: 0.65, PP: 0.013), suggesting that lower-cost hospital drugs benefit from more stable supply dynamics. However, shortages become more frequent as prices deviate upward from the median.
Beyond relative pricing, we examine the effect of absolute package price and its interaction with drug age on shortage risks. As illustrated in Figure 3, these dynamics vary substantially across drug classes. In community drugs, higher package prices are consistently associated with lower shortage probabilities, with this effect remaining stable across all ages – highlighting the role of pricing in maintaining supply continuity. For dual-dispensed drugs, higher prices also reduce shortage risk, but the effect is stronger for newer products; among older drugs, the price effect diminishes, suggesting other factors may drive shortages in long-established products.
Interaction between package price and drug age on predicted probability of shortages.

Figure 3. Long description
Three line graphs depict the predicted probability of drug shortages based on median price per package and years since authorization. Panel A: Community drugs. The line graph shows the predicted probability of a shortage on the vertical axis and the median price per package on the horizontal axis. The lines represent different years since authorization: 0 years (yellow), 5 years (green), 10 years (blue), 20 years (cyan), and 40 years (purple). The probability of shortages decreases as the price per package increases. Panel B: Dual-dispensed drugs. The line graph shows the predicted probability of a shortage on the vertical axis and the median price per package on the horizontal axis. The lines represent different years since authorization: 0 years (yellow), 5 years (green), 10 years (blue), 20 years (cyan), and 40 years (purple). The probability of shortages decreases as the price per package increases. Panel C: Hospital drugs. The line graph shows the predicted probability of a shortage on the vertical axis and the median price per package on the horizontal axis. The lines represent different years since authorization: 0 years (yellow), 5 years (green), 10 years (blue), 20 years (cyan), and 40 years (purple). The probability of shortages decreases as the price per package increases.
Hospital drugs exhibit a more complex pattern. For older drugs (20+ years), higher prices are linked to reduced shortage risk, consistent with trends in other classes. However, for newer hospital drugs, higher prices correlate with slightly increased shortage probabilities, even after accounting for patent protection and product complexity.
Beyond price, drug age itself has a class-dependent influence. In both community and hospital settings, older drugs are generally more prone to shortage. In contrast, dual-dispensed drugs display a more differentiated pattern: shortages increase with age among high-priced products, while younger drugs are more vulnerable within the low-price segment.
4.1.5. Exposure versus prevalence of drug shortages
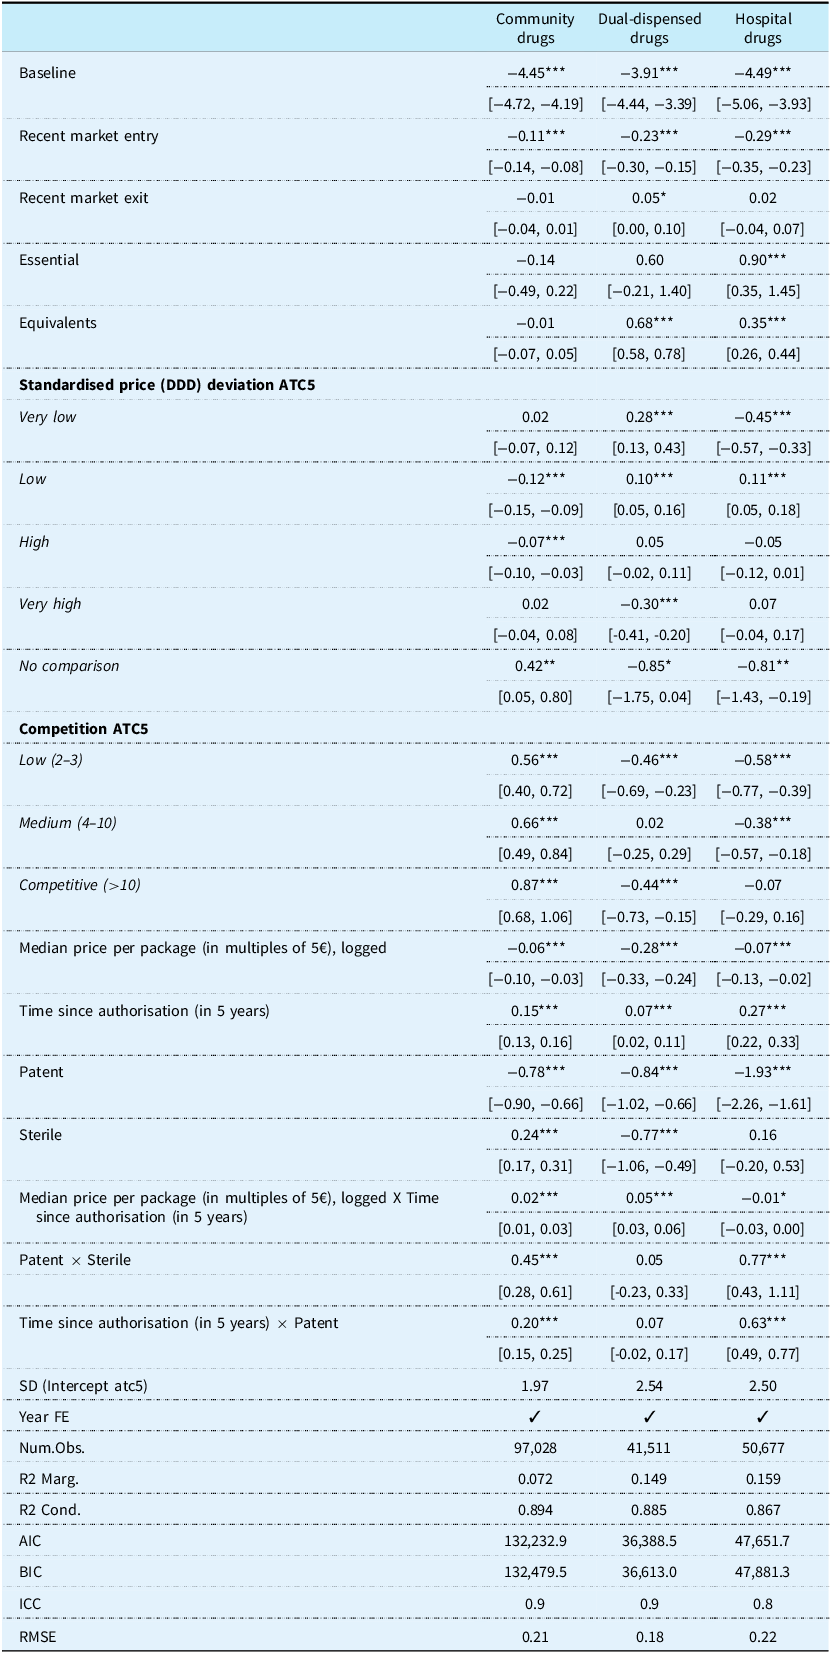
The baseline results focus on the extensive margin, whether at least one product within a group of substitutes experiences a shortage in a given month, because this outcome directly captures whether patients and providers are plausibly exposed to any access disruption at the therapeutic level. A mechanical implication of this indicator, however, is that groups with more products are more likely to register at least one shortage, simply because there are more products that could be affected. To distinguish exposure from within-market prevalence, we complement the baseline results with a binomial count specification that models the number of products in shortage relative to the total number of products observed in each group-month. Results from this prevalence model are reported in Table A4. In this specification, coefficients are identified from variation in the fraction of products in shortage (equivalently, the share of products in shortage), conditional on the number of products observed in the group-month via the binomial denominator. If a coefficient is large in the extensive model but disappears or attenuates in the intensive model, this indicates that a covariate primarily changes exposure rather than how widespread shortages are across products within a market. Importantly, this intensive-margin outcome does not measure shortage severity in terms of units, duration, or unmet demand.
The comparison yields a clear and consistent pattern. Several covariates that are strongly associated with shortages at the extensive margin, most notably the presence of therapeutic equivalents, exhibit substantially attenuated effects in the intensive-margin model. Operating in a regime where direct substitution is possible due to the availability of equivalent drugs increases exposure to shortages across all drug classes, consistent with an expansion in the number of products at risk. For community drugs, this effect operates almost entirely through market breadth, with no corresponding increase in per-product shortage risk once mechanical market-size effects are accounted for. By contrast, for dual-dispensed and hospital drugs, operating under a substitution regime remains positively associated with the per-product probability of shortage even conditional on market size. This indicates that in these settings, substitution regime status is correlated not only with greater exposure but also with higher underlying product-level fragility.
In contrast, factors linked to production economics and technological complexity, such as lower prices, greater drug age, lack of patent protection, and sterility, remain strongly predictive of per-product shortage risk. Importantly, competition continues to matter. Conditional on the number of products observed, greater supplier concentration (fewer MAHs) is associated with a higher per-product likelihood of shortage in dual-dispensed and hospital markets, while greater competition mitigates prevalence (though the degree of competition appears to matter less) even as it increases exposure at the extensive margin. Moreover, market entry is now consistently associated with a lower per-product shortage probability across all drug classes, in line with a potentially risk-diversifying role of new products, whereas recent exit mainly affects exposure rather than prevalence.
Overall, these results indicate that substitution possibilities and market expansion primarily affect exposure to shortages rather than intrinsic product fragility, whereas production economics and technological complexity continue to shape per-product shortage risk.
5. Discussion
This study provides a comprehensive analysis of drug shortages in Italy using a dataset that records product level shortages with officially reported causes by the MAHs. Italy’s reporting system, mandated by the national adoption of Article 23a of Directive 2001/83/EC, is a unique case in the European context, where the reporting of shortages is often voluntary, incomplete, or applied differently across member states.
A key innovation of this study is its dual-level approach: while most existing studies examine shortages at the product level, we assess them at the substitution level. This allowed us to capture clinically relevant risks for treatment continuity. At the same time, our analysis retains granularity by accounting for drug-specific characteristics, offering a more comprehensive understanding of the key drivers of supply disruptions between 2018 and 2023 and their implications for pharmaceutical policy and supply chain management.
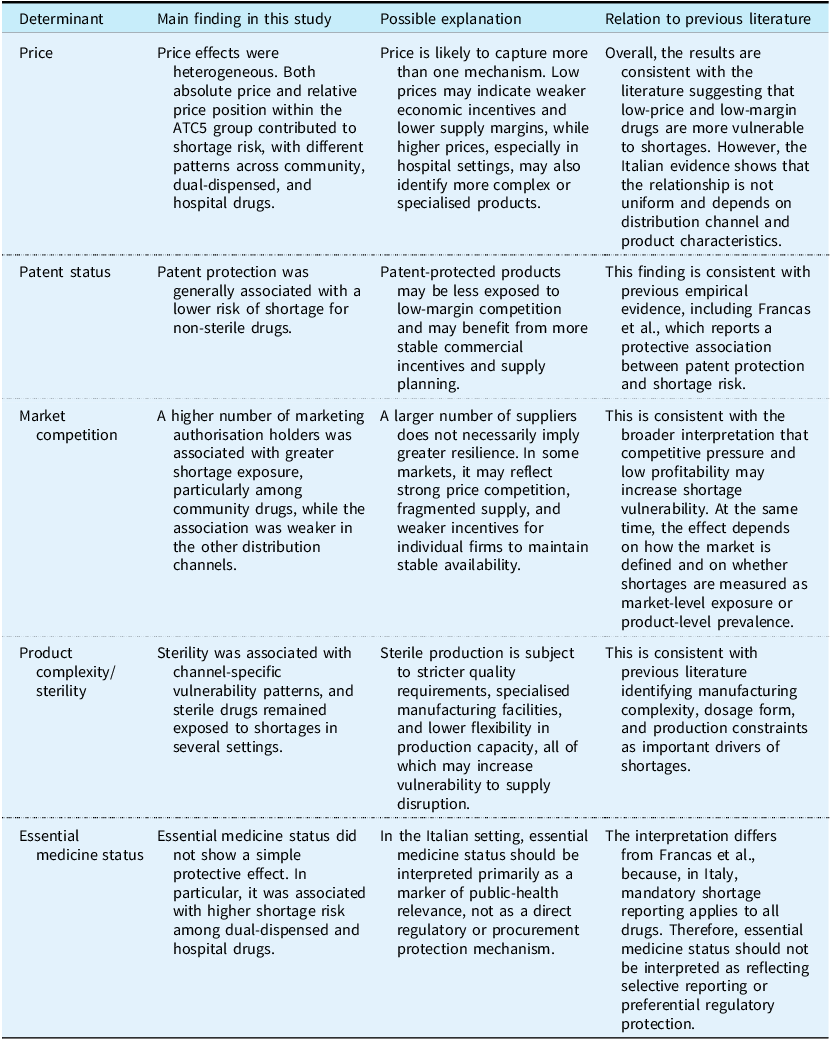
To improve the interpretation of the main findings and their relationship with previous evidence, Table 6 summarises the direction of the key effects observed in this study and compares them with the existing literature.
Summary of key determinants of drug shortages and comparison with previous literature

Table 6. Long description
A table comparing key determinants of drug shortages with previous literature. The table has four columns: Determinant, Main finding in this study, Possible explanation, and Relation to previous literature. It contains five rows of data. Row 1: Determinant: Price, Main finding in this study: Price effects were heterogeneous. Both absolute price and relative price position within the ATCS group contributed to shortage risk, with different patterns across community, dual-dispensed, and hospital drugs., Possible explanation: Price is likely to capture more than one mechanism. Low prices may indicate weaker economic incentives and lower supply margins, while higher prices, especially in hospital settings, may also identify more complex or specialised products., Relation to previous literature: Overall, the results are consistent with the literature suggesting that low-price and low-margin drugs are more vulnerable to shortages. However, the Italian evidence shows that the relationship is not uniform and depends on distribution channel and product characteristics. Row 2: Determinant: Patent status, Main finding in this study: Patent protection was generally associated with a lower risk of shortage for non-sterile drugs., Possible explanation: Patent-protected products may be less exposed to low-margin competition and may benefit from more stable commercial incentives and supply planning., Relation to previous literature: This finding is consistent with previous empirical evidence, including Franca et al., which reports a protective association between patent protection and shortage risk. Row 3: Determinant: Market competition, Main finding in this study: A higher number of marketing authorisation holders was associated with greater shortage exposure, particularly among community drugs, while the association was weaker in the other distribution channels., Possible explanation: This is consistent with the broader interpretation that competitive pressure and low profitability may increase shortage vulnerability. At the same time, the effect depends on how the market is defined and on whether shortages are measured as market-level exposure or product-level prevalence., Relation to previous literature: A larger number of suppliers does not necessarily imply greater resilience. In some markets, it may reflect strong price competition, fragmented supply, and weaker incentives for individual firms to maintain stable availability. Row 4: Determinant: Product complexity/sterility, Main finding in this study: Sterility was associated with channel-specific vulnerability patterns, and sterile drugs remained exposed to shortages in several settings., Possible explanation: Sterile production is subject to stricter quality requirements, specialised manufacturing facilities, and lower flexibility in production capacity, all of which may increase vulnerability to supply disruption., Relation to previous literature: This is consistent with previous literature identifying manufacturing complexity, dosage form, and production constraints as important drivers of shortages. Row 5: Determinant: Essential medicine status, Main finding in this study: Essential medicine status did not show a simple protective effect. In particular, it was associated with higher shortage risk among dual-dispensed and hospital drugs., Possible explanation: In the Italian setting, essential medicine status should be interpreted primarily as a marker of public-health relevance, not as a direct regulatory or procurement protection mechanism., Relation to previous literature: The interpretation differs from Franca et al., because, in Italy, mandatory shortage reporting applies to all drugs. Therefore, essential medicine status should not be interpreted as reflecting selective reporting or preferential regulatory protection.
The interpretation of essential medicine status requires caution. In this study, the variable identifies groups of substitutes included in the WHO essential medicines list and should therefore be understood as a marker of public-health relevance rather than as a direct regulatory or procurement mechanism within the Italian pharmaceutical system. Unlike the setting discussed by Francas et al., where the observed association may be related to the specific reporting system, the Italian shortage reporting framework is mandatory for all medicines. Therefore, an explanation based on preferential or selective reporting of essential medicines is not plausible for Italy. The observed association is more likely to reflect the structural characteristics of medicines classified as essential, including therapeutic area, market maturity, manufacturing complexity, and economic sustainability.
The results indicate that community drugs are the most affected by shortages, with disruptions driven by manufacturing and logistical issues (66.6%), which disproportionately impact low-cost, off-patent products. In addition, the cessation of commercialisation (19.8%) emerges as a relevant driver, potentially leading to the withdrawal of essential therapies from the market. Taken together, these findings point to price as a key economic determinant of supply stability, particularly in the community setting. The observed relationship between price, product age, and shortage risk further reinforces this interpretation. In the community setting, lower-priced and older medicines exhibit significantly higher vulnerability to shortages, whereas higher-priced products tend to show greater supply stability. This is consistent with a basic economic principle: manufacturers tend to favour markets and products that can guarantee sustainable margins, while low-priced drugs are more vulnerable to supply disruptions and market exits (Hernandez et al., Reference Hernandez, Sullivan, Hansen and Fendrick2024). This finding is also consistent with previous research that found lower prices to be associated with increased shortage risk (Dubois et al., Reference Dubois, Majewska and Reig2023). Furthermore, in the Italian context, low-priced class A drugs may also experience shortages due to strategic dynamics, such as the incentive to shift demand towards packages of the same active ingredient and the same AIC holder placed in class C, or due to withdrawal from the market with subsequent relocation to class C or price renegotiation. Accordingly, these results underscore the role of economic incentives in sustaining production continuity and align with empirical evidence from France and the United Kingdom, showing that stricter price regulation and lower regulated prices are associated with a higher likelihood and greater severity of drug shortages, while higher prices in other markets may reduce shortage probability but exacerbate their magnitude through international supply reallocation. Overall, higher prices mitigate shortage risk by supporting manufacturing viability and shaping international supply allocation (Dubois et al., Reference Dubois, Majewska and Reig2023).
Our findings also suggest that, in fragmented pharmaceutical markets, particularly for equivalents, greater competition, proxied by the number of MAHs, correlates with a higher risk of shortages. This pattern likely reflects margin erosion, duplication of production infrastructure, and weakened supply resilience. The presence of multiple equivalents within the same therapeutic group, while beneficial for patient choice, further amplifies this mechanism. Substitutable products tend to operate in highly price-sensitive environments, where limited profitability reduces incentives to maintain a stable supply, often resulting in market exits (Dave et al., Reference Dave, Pawar, Fox, Brill and Kesselheim2018).
Our results show that the relationship between market structure and drug shortages depends on both the distribution channel and the outcome considered. At the extensive margin, highly competitive markets were associated with greater exposure to shortages, particularly among community drugs. At the intensive margin, greater competition was associated with a lower prevalence of shortages in dual-dispensed and hospital markets. This distinction may help reconcile previous findings concerning competition, market concentration, and supply resilience (Dubois et al., Reference Dubois, Majewska and Reig2023; Francas et al., Reference Francas, Mohr and Hoberg2023; Rodriguez-Monguio et al., Reference Rodriguez-Monguio, Naveed and Seoane-Vazquez2021; Tadrous et al., Reference Tadrous, Kim and Hernandez2024).
An innovative contribution of this study is the comparison of shortage dynamics between different distribution channels, which reveals potentially distinct vulnerability profiles. Drugs dispensed in community setting (class A) may be more exposed to shortages due to economic pressures, typically associated with low prices, high competition, and products that have been on the market for longer. In this setting, prices are already regulated at relatively low levels, and, when community drugs are procured through public tenders, further price reductions may occur, potentially reducing margins below sustainable thresholds and increasing the risk of supply disruptions.
Conversely, shortages observed among drugs intended for hospital settings (class H) appear to be less sensitive to price levels, which in this case can also be very high, and may be more influenced by factors related to production complexity, including the presence of biological or technologically advanced products. Dual-dispensed drugs (class A-PHT) show an intermediate trend, combining possible sensitivity to price dynamics with procurement and distribution mechanisms typical of the hospital setting, and are often characterised by higher average costs and greater production complexity than exclusively community drugs. Overall, this evidence suggests that shortages are not a uniform phenomenon but depend significantly on the institutional and distributive context in which medicines are placed, as well as on the economic and technological characteristics that differentiate the various distribution channels.
Within this complex system, patent protection emerges as a generally protective factor against shortages across all distribution channels, in line with previous literature (Francas et al., Reference Francas, Mohr and Hoberg2023; Zhang et al., Reference Zhang, Guh, Sun, Lynd, Hollis, Grootendorst and Anis2020). Patented medicines are typically associated with higher margins, more centralised production structures, and better-controlled supply chains, allowing firms to recover R&D investments and plan manufacturing and distribution more predictably. However, this protective effect is substantially weaker for sterile products, where high manufacturing complexity, stringent regulatory requirements, and a limited number of qualified producers create structural vulnerabilities that cannot be fully offset by higher prices or market exclusivity (Rodriguez-Monguio et al., Reference Rodriguez-Monguio, Naveed and Seoane-Vazquez2021; Shukar et al., Reference Shukar, Zahoor and Hayat2021). The correlation between the pharmaceutical form and the likelihood of shortages has been investigated in many studies, with most studies finding an increased risk with formulation complexity (Francas et al., Reference Francas, Mohr and Hoberg2023; Tadrous et al., Reference Tadrous, Kim and Hernandez2024; Zhang et al., Reference Zhang, Guh, Sun, Lynd, Hollis, Grootendorst and Anis2020). In particular, injectable solutions and other more complex forms are more vulnerable to supply disruptions than simpler formulations such as oral tablets.
Overall, these findings suggest that adequate prices and margins are necessary, but not sufficient, conditions for supply stability, particularly for complex production technologies.
These channel-specific vulnerability profiles also help interpret the growing incidence of severe shortages observed in recent years, defined as situations in which all equivalents within a group of substitutes are simultaneously unavailable. While this phenomenon has remained stable in community settings, it has become increasingly frequent for hospital and dual-dispensed drugs since 2022, suggesting a shift of shortages toward more centralised and clinically sensitive areas of the healthcare system. This trend raises significant concerns for patient safety and continuity of care. However, part of this increase may be explained by the introduction of a national policy requiring MAHs to report potential shortages in advance. To avoid financial penalties, companies may preemptively declare shortages that ultimately do not materialise, thus bloating the number of reported cases and complicating data interpretation.
The results of this study contribute not only to the scientific literature on PSCs and drug shortages, but also carry relevant policy implications for stakeholders. First, the correlation between shortages and lower prices implies that greater attention must be paid to security of supply in price negotiations and regulation, thus shifting away from an approach focused exclusively on cost containment. Further implications of study results can be applied to the area of public procurement, which in Italy, is predominantly oriented toward short-term cost savings and often generates distortions that may exacerbate shortage phenomena. In this respect, shifting from single-winner tendering systems, particularly for more vulnerable products, could help improve supply resilience. This could be achieved by introducing other criteria that go beyond price, such as manufacturing reliability, supplier diversification, and guaranteed supply capacity.
Finally, the identification of shortage determinants through this work could provide a starting point for developing risk-based surveillance models capable of early identification of medicines at higher risk of supply disruption, thereby enabling the timely activation of preventive and mitigation strategies.
These considerations are particularly relevant in a context where the debate on drug shortages at the European level remains ongoing. In light of the current discussions on pharmaceutical legislation, the findings of this study support the need for stronger coordination and harmonisation of reporting procedures, as well as the development of effective and comparable monitoring systems across Member States.
Nonetheless, several limitations must be acknowledged. Reported causes are based on unstandardised declarations by MAHs, often using broad and ambiguous categories such as ‘production issues.’ A harmonised, structured classification system at the EU level would significantly enhance comparability and surveillance. Additionally, the dataset does not include market shares or sales volumes, making it impossible to distinguish shortages of widely used drugs from those of drugs with limited clinical relevance.
Furthermore, the analysis is based on public prices. It does not take into account reserved discounts, controlled entry agreements, or tender prices, which are particularly relevant for medicines purchased by health care facilities, given the limited price transparency in the pharmaceutical market. Consequently, the prices measured should be interpreted as standardised indicators of relative price levels rather than as precise estimates of procurement costs.
Although the inclusion of active ingredient random effects partially accounts for global supply dependencies, the analysis cannot fully capture disruptions in active pharmaceutical ingredient (API) sourcing or international trade. Furthermore, while the ATC7 based grouping captures therapeutic substitutability, it does not assess shortage severity – a key to understanding clinical impact. Finally, many drugs can be dispensed through the three distribution channels, complicating their classification and reflecting the fluidity of the Italian pharmaceutical supply system.
Despite these limitations, this research still has important implications for public health. By linking shortage risk to drug, economic and regulatory factors, the study identifies key vulnerabilities in drug supply. The evidence supports the need for risk-based surveillance, incentive-aligned procurement, and targeted interventions for low-margin, off-patent drugs. The Italian model highlights how regulatory design can shape both data quality and preparedness, offering lessons for broader efforts to improve pharmaceutical supply chain resilience.
Acknowledgements
None.
Author contributions
Benedetta Dal Canto: Conceptualisation, Data curation, Visualisation, Writing – Original Draft Preparation. Jan Panhuysen: Conceptualisation, Data curation, Formal Analysis, Methodology, Software, Writing – Original Draft Preparation. Giaele Moretti: Conceptualisation, Visualisation, Writing – Original Draft Preparation. Bruna Vinci: Conceptualisation, Validation, Supervision. Milena Vainieri: Conceptualisation, Validation, Supervision, Writing – Review & Editing.
Financial support
This research received no specific grant from any funding agency, commercial or not-for-profit sectors.
Competing interests
The authors declare no conflicts of interest.
Appendix
Pooled Summary of Drug Characteristics and Shortage Patterns at group of substitutes level by Drug Class

Table A1. Long description
A table summarizing drug characteristics and shortage patterns by drug class. The table has 30 rows and 5 columns. Column headers are Overall, Community drugs, Dual-dispensed drugs, and Hospital drugs. Row labels include General characteristics, Drug form, Groups of substitutes, Shortage episodes and frequency, Market dynamics and drug entry/exit, and Pricing and economic characteristics. Row 1: Overall, 3,013; Community drugs, 1,478; Dual-dispensed drugs, 671; Hospital drugs, 864. Row 2: ATC 1 classification a, 298 (9.9%), 171 (12%), 87 (13%), 40 (4.6%). Row 3: ATC 1 classification b, 235 (7.8%), 34 (2.3%), 120 (18%), 81 (9.4%). Row 4: ATC 1 classification c, 384 (13%), 313 (21%), 33 (4.9%), 38 (4.4%). Row 5: ATC 1 classification d, 52 (1.7%), 35 (2.4%), 7 (1.0%), 10 (1.2%). Row 6: ATC 1 classification g, 114 (3.8%), 62 (4.2%), 42 (6.3%), 10 (1.2%). Row 7: ATC 1 classification h, 147 (4.9%), 72 (4.9%), 62 (9.2%), 13 (1.5%). Row 8: ATC 1 classification j, 418 (14%), 175 (12%), 39 (5.8%), 204 (24%). Row 9: ATC 1 classification l, 526 (17%), 62 (4.2%), 119 (18%), 345 (40%). Row 10: ATC 1 classification m, 117 (3.9%), 79 (5.3%), 4 (0.6%), 34 (3.9%). Row 11: ATC 1 classification n, 529 (18%), 311 (21%), 139 (21%), 79 (9.1%). Row 12: ATC 1 classification p, 14 (0.5%), 11 (0.7%), 1 (0.1%), 2 (0.2%). Row 13: ATC 1 classification r, 137 (4.5%), 116 (7.8%), 18 (2.7%), 3 (0.3%). Row 14: ATC 1 classification s, 42 (1.4%), 37 (2.5%), 0 (0%), 5 (0.6%). Row 15: Drug form Solid, 1,656 (55%), 1,009 (68%), 369 (55%), 278 (32%). Row 16: Drug form Injectable, 988 (33%), 207 (14%), 255 (38%), 526 (61%). Row 17: Drug form Liquid, 290 (9.5%), 198 (13%), 40 (6.0%), 52 (6.0%). Row 18: Drug form Semisolid, 42 (1.4%), 28 (1.9%), 7 (1.0%), 7 (0.8%). Row 19: Drug form Ophthalmic liquid, 34 (1.1%), 33 (2.2%), 0 (0%), 1 (0.1%). Row 20: Drug form Ophthalmic semisolid, 3 (0.1%), 3 (0.2%), 0 (0%), 0 (0%). Row 21: Groups of substitutes on WHO essential drug list, 1,181 (39%), 566 (38%), 207 (31%), 408 (47%). Row 22: Groups of substitutes with sterile drug, 1,137 (38%), 324 (22%), 265 (40%), 548 (63%). Row 23: Groups of substitutes with drug under patent, 683 (23%), 158 (11%), 239 (36%), 286 (33%). Row 24: Groups of substitutes with any shortage, 1,821 (60%), 1,031 (70%), 353 (53%), 437 (51%). Row 25: Share of months with any shortage (Min, Max), 0.25 (0.00, 1.00), 0.31 (0.00, 1.00), 0.20 (0.00, 1.00), 0.20 (0.00, 1.00). Row 26: Groups of substitutes with any severe shortage, 781 (26%), 398 (27%), 158 (24%), 225 (26%). Row 27: Share of months with severe shortage (Min, Max), 0.06 (0.00, 1.00), 0.07 (0.00, 1.00), 0.04 (0.00, 0.86), 0.07 (0.00, 1.00). Row 28: Groups of substitutes with at least two shortage periods, 904 (30%), 567 (38%), 148 (22%), 189 (22%). Row 29: Average number of AICs within group of substitutes (Min, Max), 4.4 (1.0, 113.3), 6.1 (1.0, 113.3), 3.0 (1.0, 32.7), 2.5 (1.0, 24.5). Row 30: Average time since authorisation (in years) (Min, Max), 15 (1, 71), 20 (1, 71), 10 (1, 70), 10 (0, 69).
Notes: This table presents a pooled summary of characteristics for 17,619 unique drugs, grouped into 3,013 groups of substitutes, observed in Italy from January 2018 to December 2023. Severe shortages refer to cases where all drugs within groups of substitutes are reported as short. Categorical variables are presented as n (%), representing the proportion of groups of substitutes within each drug class that meet the specified criteria.
1 n (%).
Covariate values and baseline predicted probability of shortages

Table A2. Long description
The table compares baseline predicted probabilities of drug shortages for three drug classes: Community drugs, Dual-dispensed drugs, and Hospital drugs. It has 13 rows and 4 columns, including the headers. The columns are labeled Variable, Community drugs, Dual-dispensed drugs, and Hospital drugs. Each row lists a variable and its corresponding values for each drug class. The variables include Recent entry, Recent exit, Essential, Equivalent, Relative price (SD, ATC5 level), Competition (ATC5 level), Patent, Sterile, Year, Median price per package (in multiples of 5), Time since authorisation (in 5 years), and Baseline shortage probability. The values are specific probabilities or categories relevant to each variable and drug class. Notable trends include higher baseline shortage probabilities for Community drugs (0.04) compared to Dual-dispensed drugs (0.007) and Hospital drugs (0.021). The Essential and Equivalent variables show varying probabilities across the drug classes, with Hospital drugs having the highest Essential probability (0.491) and Community drugs having the highest Equivalent probability (0.588). The Patent and Sterile variables also show significant differences, with Dual-dispensed drugs having the highest Patent probability (0.273) and Hospital drugs having the highest Sterile probability (0.656). The Year is consistent across all drug classes (2018), while the Median price per package and Time since authorisation vary significantly.
Notes: This table presents the covariate values used to calculate the baseline predicted probability of shortages for each drug class. Categorical variables were set to the levels shown, while binary and continuous covariates were set at the reported class-specific values.
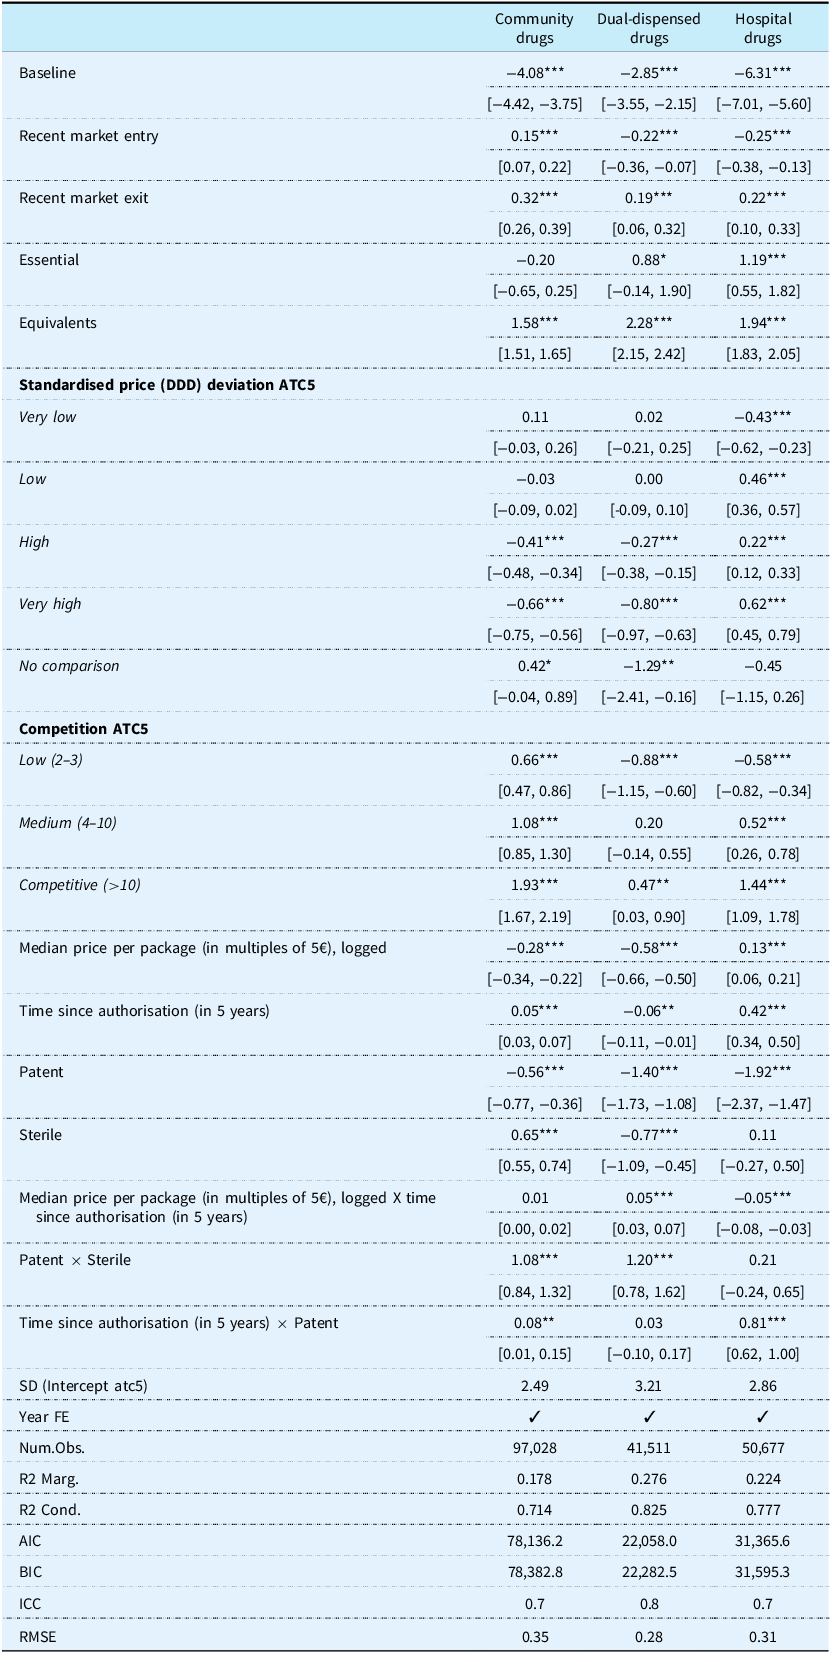
Regression output. Extensive-margin model (any shortage), by drug class

Table A3. Long description
A table with 32 rows and 11 columns comparing regression outputs for different drug classes. The columns are labeled as Community drugs, Dual-dispensed drugs, and Hospital drugs. The rows are labeled with various factors such as Baseline, Recent market entry, Recent market exit, Essential, Equivalents, Standardised price (DDD) deviation ATC5, Competition ATC5, Median price per package (in multiples of 5), logged, Time since authorisation (in 5 years), Patent, Sterile, Median price per package (in multiples of 5), logged X time since authorisation (in 5 years), Patent Sterile, Time since authorisation (in 5 years) Patent, SD (Intercept atc5), Year FE, Num.Obs., R2 Marg., R2 Cond., AIC, BIC, ICC, and RMSE. Each cell contains regression coefficients and 95% confidence intervals in brackets. Notable trends include variations in coefficients across different drug classes and factors.
Notes: Estimates from a logistic mixed-effects model where the dependent variable is 1 if at least one product in the ATC7 substitute group is in shortage in month t, and 0 otherwise. Models include the covariates listed, year fixed effects, and an ATC5 random intercept. Separate models are estimated by drug class. Coefficients are log-odds; 95% confidence intervals in brackets. *p < 0.1, **p < 0.05, ***p < 0.01.
Intensive-margin estimates: prevalence of drug shortages conditional on market size, by drug class

Table A4. Long description
The table presents intensive-margin estimates of drug shortages, focusing on the prevalence of shortages conditional on market size across different drug classes. It includes data for community drugs, dual-dispensed drugs, and hospital drugs. The table has 27 rows and 12 columns, with column headers including Baseline, Recent market entry, Recent market exit, Essential, Equivalents, Standardised price (DDD) deviation ATC5, Competition ATC5, Median price per package (in multiples of 5), logged, Time since authorisation (in 5 years), Patent, Sterile, Median price per package (in multiples of 5), logged X Time since authorisation (in 5 years), Patent Sterile, Time since authorisation (in 5 years) Patent, SD (Intercept atc5), Year FE, Num.Obs., R2 Marg., R2 Cond., AIC, BIC, ICC, and RMSE. Each row provides specific estimates and confidence intervals for various factors affecting drug shortages. Notable trends include the impact of recent market entry, essential drug status, and patent status on the prevalence of shortages. The table also includes statistical measures such as R-squared values and AIC for model evaluation.
Notes: Estimates from a binomial mixed-effects model where the dependent variable is the number of products in shortage out of the total number of products in the ATC7 substitute group in month t. This specification identifies effects on the share of products in shortage (i.e., the implied per-product shortage probability), conditional on the group-month market size via the binomial denominator. Models include the covariates listed, year fixed effects, and an ATC5 random intercept. Separate models are estimated by drug class. Coefficients are log-odds; 95% confidence intervals in brackets. *p < 0.1, **p < 0.05, ***p < 0.01.




 Open access

