INTRODUCTION
Conservation agriculture (CA) has been promoted and disseminated through large development programmes to restore soil fertility and productivity on family farms in sub-Saharan Africa. CA is based on three principles: (i) minimal soil disturbance, (ii) permanent soil cover and (iii) crop rotation (FAO, 2013). The combination of the three principles aims to maintaining soil fertility by avoiding the negative consequences of tillage-based conventional soil management and monoculture. CA can provide several agronomic benefits such as enabling early sowing by preserving soil moisture, reducing erosion by protecting the soil surface (Barton et al., Reference Barton, Fullen, Mitchell, Hocking, Liu, Wu Bo, Zheng and Xia2004; Scopel et al., Reference Scopel, Findeling, Guerra and Corbeels2005), enhancing infiltration of rainfall water, and reducing soil evaporation (Adekalu et al., Reference Adekalu, Olorunfemi and Osunbitan2007; Scopel et al., Reference Scopel, Da Silva, Corbeels, Affholder and Maraux2004; Thierfelder et al., Reference Thierfelder, Cheesman and Rusinamhodzi2013a) or increase crop yields in the long term by building up soil fertility (Thierfelder et al., Reference Thierfelder, Chisui, Gama, Cheesman, Jere, Trent Bunderson, Eash and Rusinamhodzi2013b; Reference Thierfelder, Mwila and Rusinamhodzi2013c). Still, its benefits in non-mechanised family farms in sub-Saharan Africa remain unclear (Bolliger et al., Reference Bolliger, Magid and Amado2006; Giller et al., Reference Giller, Witter, Corbeels and Tittonell2009; Scopel et al., Reference Scopel, Triomphe, Affholder, Da Silva, Corbeels, Xavier, Lahmar, Recous, Bernoux, Blanchart, Mendes and Tourdonnet2012). Most studies on the performance of CA in sub-Saharan Africa were done in research stations or by setting up experiments on farmer fields but managed by researchers, erasing the effect of any socio-economic constraint.
In southern Africa, maize grain yields increased under CA in the long term (up to 15 years), but there were no yield benefits in the short run, and losses were just as probable (Rusinamhodzi et al., Reference Rusinamhodzi, Corbeels, van Wijk, Rufino, Nyamangara, Giller and Wijk2011). Yield increases were obtained with CA in cotton production in north Cameroon, although it was difficult to distinctly separate the actual impact of CA from the impact of fertiliser use (Naudin et al., Reference Naudin, Gozé, Balarabe, Giller and Scopel2010). In the highlands of Madagascar, a long-term study of a soybean–maize rotation exhibited a higher level of soil organic carbon content under CA as compared to conventional tillage (Razafimbelo et al., Reference Razafimbelo, Albrecht, Oliver, Chevallier, Chapuis-Lardy and Feller2008). Few studies in Africa have reported agronomic benefits of CA on farmer's fields. Rotations of cotton and Sorghum in the mid Zambezi valley of Zimbabwe yielded similarly under CA or under current farmer practices in a two-year experiment on farmer fields (Baudron et al., Reference Baudron, Andersson, Corbeels and Giller2012). The low rate of CA adoption in sub-Saharan Africa raises the question of the relevance of CA at the farm, village, or region scale (Giller et al., Reference Giller, Witter, Corbeels and Tittonell2009). A critical issue hampering adoption of CA – as of other knowledge-intensive practices – is the risk of yield penalties during the transition period from current practices to full CA adoption. Reasons for potentially lower yields during the first years of CA adoption include (Affholder et al., Reference Affholder, Jourdain, Quang, Tuong, Morize and Ricome2010; Pannell et al., Reference Pannell, Marshall and Barr2006; Tittonell et al., Reference Tittonell, Scopel, Andrieu, Posthumus, Mapfumo, Corbeels, van Halsema, Lahmar, Lugandu, Rakotoarisoa, Mtambanengwe, Pound, Chikowo, Naudin, Triomphe and Mkomwa2012): (i) the time needed to learn and eventually master a new way of farming, (ii) profound changes in the flow of resources (including labour) within the farming system, and (iii) the competition for mineral nitrogen between crops and decomposing soil bacteria when crop residues are kept as mulch. Yet, these shortcomings could be traded off by improved rainwater productivity in regions with erratic rainfall (Scopel et al., Reference Scopel, Da Silva, Corbeels, Affholder and Maraux2004), making CA attractive to family farmers from the first year of implementation.
Since 2003, CA has been promoted and disseminated in a region of erratic rainfall around Lake Alaotra, Madagascar, where upland rice expansion is taking place. Our objective was to assess the impact of CA on yield and yield variability of upland rice during the first six years of CA adoption by local farmers. We monitored fields transitioning to CA over a period of four years in a series of locations and soil types, resulting in ca. 3800 site × season combinations. The data were analysed through classification and regression trees and boundary line models (Delmotte et al., Reference Delmotte, Tittonell, Mouret, Hammond and Lopez-Ridaura2011; Tittonell et al., Reference Tittonell, Shepherd, Vanlauwe and Giller2008) to unravel the effect of single factors.
MATERIALS AND METHODS
Site description
The Lake Alaotra region (17°35′S, 48°30′E) is a graben located in Toamasina province 250 km north of Antananarivo, Madagascar (Bakoariniaina et al., Reference Bakoariniaina, Kusky and Raharimahefa2006). The plain is located at 750-m elevation and covers an area of 180,000 ha. It is surrounded by high ferralitic hills raised on a granite-gneissic platform. A 25,000-ha shallow lake (2–4 m depth) is found in the centre of the plain. The region, which has always been a focus of rice production management strategies, is currently referred to as the ‘Madagascar rice granary’ (Devèze, Reference Devèze2006; Teyssier, Reference Teyssier1994): The region consists of almost 30,000 ha of irrigated paddy fields (fields benefiting from irrigation channel maintenance) and 72,000 ha of paddy fields with poor water control (unsecure fields that can undergo damaging silting, drought or floods; MAEP, 2004). The region attracts a high rate of immigration of farmers’ families, resulting in the highest population growth rate in Madagascar over the last 20 years, with 4.2% growth per year (the mean annual population growth rate of the country is 2.7%; Wilhelm and Ravelomanantsoa, Reference Wilhelm and Ravelomanantsoa2006). The Lake Alaotra population was estimated to have doubled since 1987 and reached 670,000 in 2005 (Devèze, Reference Devèze2006).
As the farming systems are mainly based on rice cultivation, the dramatic increase in population forced farmers to develop and intensify rainfed production. Rainfed crops are grown either on ferralitic soils of hillsides with gentle to steep slopes or on alluvial soil of non-irrigated lowlands with more or less access to the water table (respectively referred as hillside and lowland in this study). The region is characterised by an erratic humid tropical altitude climate with a mean annual temperature of 20 °C and a single rainy season, roughly from November to March, with a mean annual rainfall of 1000 mm. The rainy season is highly variable intra- and inter-annually in terms of duration, daily distribution and annual cumulated rainfall. In this context of hazardous climate, low capacity of investment combined with continuous tillage led to soil erosion and soil fertility losses, putting rainfed production at risk. Since 2003, the BV/Lac programme has promoted and disseminated CA on a large scale to address these issues.
Yield, weather and management data
After a first phase of promotion of CA, the BV/Lac programme entered a phase of dissemination of CA at a large scale based on farmers’ volunteering. The programme only provided technical advice at the field level and monitored main descriptive, management and yield information (Laurent et al., Reference Laurent, Mézino and Enjalric2011). Yields were calculated from the total weight of the grain harvested divided by the field area, which was known. Several CA cropping systems integrating rice in multi-year crop rotations and associations were proposed, most commonly:
-
(i) no-till maize associated with a legume during the first cropping season, followed by no-till upland rice on mulch of maize and legume residues during the second cropping season;
-
(ii) no-till maize associated with a legume during the first cropping season, followed by the growth of the legume that has not been harvested during the second cropping season, followed by no-till upland rice on mulch of maize and legume residues during the third cropping season.
For the first year of involvement with the programme (Y0), the soil was tilled and did not benefit from the mulch of the previous crop that has been conventionally grown. Tillage was then stopped from the second year of involvement with the programme and remained so year after year (Y1, Y2, Y3, Y4+). Often, farmers wanted to grow rainfed rice during Y0. In this case, crop management was similar to tillage-based conventional crop management of rainfed rice at the exception that rice straws were kept in the field after harvest. However, it required to grow a legume the next cropping season (Y1) to produce enough biomass to then start a CA rotation in Y3, as proposed. This rice cropping system, which only occurs in Y0, is referred to as Cv in the study.
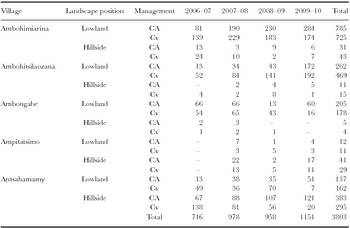
Data on rainfed rice production and management were collected for cropping seasons 2006–2007, 2007–2008, 2008–2009 and 2009–2010 around the five villages of the programme scope on lowland and hillside fields, resulting in 3803 site × management × soil × season combinations (Table 1). Analyses were conducted independently for hillside (n = 2946) and lowland (n = 857) fields.
CA and Cv field distributions around the five villages during four cropping seasons for two landscape positions.

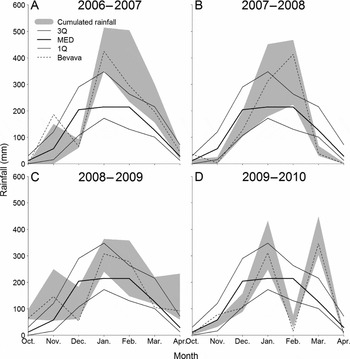
The four rainy seasons covered by the study differed with respect to both the total amount of rainfall and its distribution (Figure 1). The 2006–2007 season was above average, lasting 137 days from mid-November to early April, with 1272 mm of total rainfall. The monthly rainfall distribution remained above the median, except in December when it showed a deficit of 100 mm (Figure 1a). In 2007–2008, the onset of the rainy season was as late as mid-December, with a total of 887 mm, which fell over an 80-day period concentrated in January and February (Figure 1b). The 2008–2009 rainy season showed a quasi-similar pattern as in 2006–2007, with the same deficit in December. The January/February rainfall peak was smaller, but the season lasted 30 days longer, resulting in a total rainfall of only 80 mm less (Figure 1c). 2009–2010 was an average rainy season, with 960 mm falling in 111 days from late November to mid-March. However, there was an abnormal rainfall deficit in February and a violent tropical storm occurred in March (more than 400 mm fell around March 8th; Figure 1d; Waliser and Moncrieff, Reference Waliser and Moncrieff2011). Our study thus covered four unique years in terms of climate variability. Such variability was an opportunity to assess how these rain season profiles, among other agronomic, management and environmental factors, reflected on rainfed rice productivity.
Comparison, for each studied rainy season, between the actual monthly rainfall distribution (monthly rainfall distributions of the five localities are contained within the grey-coloured area) and an average monthly rainfall distribution calculated from a 39-year series (Bevava weather station, 1963–1988 and 1990–2004 datasets, 1Q = first quartile, MED = median, 3Q = third quartile). The dashed line corresponds to the actual monthly rainfall distribution at Bevava for each rainy season.

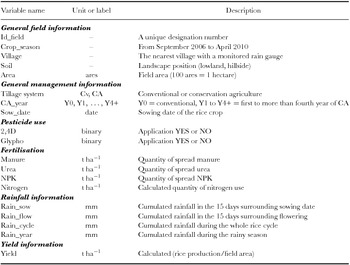
Using the daily rainfall series of the closest weather station from each field, we calculated the cumulated rainfall during: (i) the 15 days surrounding the sowing date, (ii) the 15 days before flowering, (iii) the entire development cycle and (iv) the entire rainy season. We estimated a single 120-day phenological cycle starting at the sowing date, with a flowering stage 70 days after sowing (J. Dusserre, 2012, personal communication). Finally, we obtained a dataset structured as described in Table 2, source of all the results obtained in this study.
List of variables included in the final dataset.

Analysing rice yield variability
All of the statistical analyses were performed using the R software version 2.14.1 (R Development Core Team, 2011). After a simple frequency distribution analysis of the entire dataset, we compared the impact of different factors on rice yield distributions. First, we focused on the effect of the number of consecutive years of CA cropping from Y0 (first year of involvement in the programme under Cv) to Y4+ (fourth to sixth consecutive year of CA) to detect whether there was a progressive or cumulative effect on yield distribution over time. Then, we focused on the effect of nitrogen fertilisation on yields. We only took the first two cropping seasons into account because chemical input prices tripled in 2008, which forced farmers to stop using fertilisers. Finally, we focused on the impact of the erratic rainfall distribution on sowing dates and consequently on yield, as early sowing is considered to be one of the main advantages of CA. We used two common methods to statistically analyse distribution differences. The Student's t-test allowed us to compare means of two groups. For multiple factor variables, we performed an analysis of variance and Duncan's Test to test significant differences between group means.
Yield being the result of complex interactions between soil, crops, management and environment, we decided to run a Classification and Regression Tree (CART) analysis for each landscape position in order to classify the weight of potential explanatory variables in the yield distribution. CART analyses can deal with non-linearity, thresholds, skewed distributions and a mix of continuous and categorical variables. This non-parametric method and its application in the agronomy field is fully explained in Tittonell et al. (Reference Tittonell, Shepherd, Vanlauwe and Giller2008). Thus, for each landscape position, we considered
 \begin{eqnarray*}
{\rm Yield} &=& f({\rm general}\;{\rm field}\;{\rm information},\;{\rm general}\;{\rm management}\;{\rm information},\\
&& {\rm pesticide}\;{\rm use},\;{\rm fertilisation},\;{\rm rainfall}\;{\rm information}),
\end{eqnarray*}
where general field information, general management information, pesticide use, fertilisation and rainfall information are categories pooling the variables presented in Table 2. With all these variables as candidate explanatory variables of yield, we generated complex trees and then pruned them back to select the most parsimonious tree models according to 20-fold cross-validations and the ‘1-Squared Error’ rule (Breiman et al., Reference Breiman, Friedman, Olshen and Stone1984).
RESULTS
Yield variability and short-term impact of CA
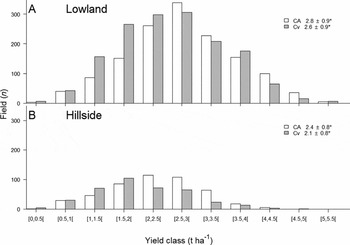
When considering all locations, years, landscape positions and soil management systems, the average rainfed rice yield of the whole dataset was 2.6 ± 0.9 t ha−1, which is above the average rainfed rice yield for the region (2.0 t ha−1; Penot et al., Reference Penot, Scopel, Domas and Naudin2010). Monitored fields presented a wide array of rice yields for both lowland and hillside. It ranged from 0.3 t ha−1 to 5.4 t ha−1 and from 0.4 t ha−1 to 4.5 t ha−1, respectively (Figure 2). The coefficient of variation, exceeding 30%, illustrates the large yield variability in the region. Given the number of fields considered in this study, we considered the highest yields compiled in this study to be fairly representative of the highest attainable upland rice yield for family farmers in the region, i.e. 5.4 t ha−1 on lowlands and 4.4 t ha−1 on hillsides. Maximum and average yields were higher on lowlands than on hillsides. Lowland alluvial soils provide a better agroecological environment and, consequently, higher soil fertility which resulted in an average 0.5 t ha−1 yield gap between lowland and hillside fields in our study.
Frequency distribution of yields among 11 classes for CA and Cv on: (A) lowland (n = 2946) and (B) hillside (n = 857). * indicates that the two group means are statistically different according to a Student's t-test.

When considering all years and locations, the average yields under CA were significantly higher than under Cv for the two landscape positions (0.2 t ha−1 higher on lowland and 0.3 t ha−1 higher on hillside; Figure 2), while the magnitude of yield variability was only slightly reduced under CA (the coefficient of variation was only 3 to 5% lower). As the maximum observed yield was the same under Cv and CA (5.4 t ha–1 on lowland and 4.4 t ha–1 on hillside), the net effect of CA was thus a significant reduction in the yield gap, without impacting – on average – on the maximum attainable yield on farmer's fields.
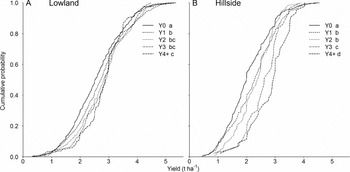
Consecutive years of CA on the same field progressively improved productivity and decreased yield variability from the first year of CA application. On lowland fields, average yields increased only slightly (+0.2 t ha−1) but significantly from the first year, under Cv, to the fourth to sixth consecutive year under CA (Figure 3), together with a 6% decrease in the coefficient of variation. On hillside fields, average yields increased by 0.7 t ha−1 after four years of CA, with a decrease in variance that resulted in a 13% decrease in the coefficient of variation. Although these are average yields from a large diversity of situations in terms of location, year, landscape position and farmer management decisions, CA exhibited a cumulative positive effect on yields year after year, starting from the first year of application.
Cumulative probability distribution of rainfed rice yield in: (A) lowland fields (n = 2946) and (B) hillside fields (n = 857) under conventional tillage (Y0) and under one to four or more consecutive years of conservation agriculture (Y1 to Y4+). Letters a, b, c and d pool homogenous groups according to Duncan's test.

Nitrogen fertilisation effect
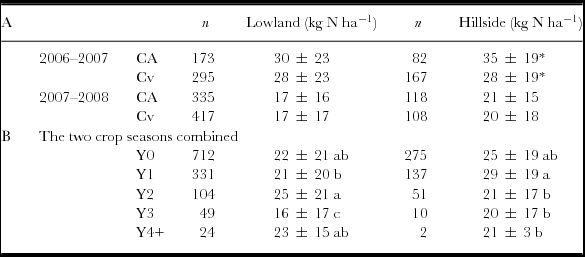
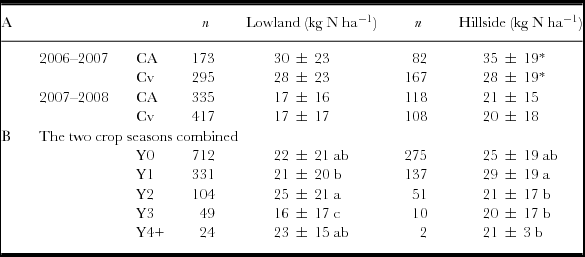
Mineral fertilisation was highly dependent on the market conditions. The soaring price paid locally for mineral fertilisers resulted in a dramatic decrease in their use. While more than 70% of the fields monitored had been fertilised with mineral N until 2008, only 18% of them received fertilisers in cropping season 2008–2009, and 0% in cropping season 2009–2010. Overall, nitrogen fertilisation was highly variable (coefficient of variation of almost 100%) and poorly correlated to yield (less than 5% of correlation). There was no obvious relationship between soil management and the fertilisation strategy, i.e. no clear pattern was noted after the comparison of nitrogen application depending on the number of continuous years of CA involvement (Table 3). The average fluctuated around 21 kg N ha−1 on lowland and 24 kg N ha−1 on hillside when fertilisers were used, regardless of CA or Cv management, so that the observed differences in yield between both systems were not due to significantly different N fertilisation rates.
Average nitrogen fertilisation rates, comparing (A) CA and Cv for 2006–2007 and 2007–2008 and (B) consecutive years of CA application, the two cropping seasons combined. * indicates that the two group means are statistically different according to a Student's t-test. For the same landscape position, letters a, b and c pool homogenous groups according to Duncan's test.
Effect of season and sowing date
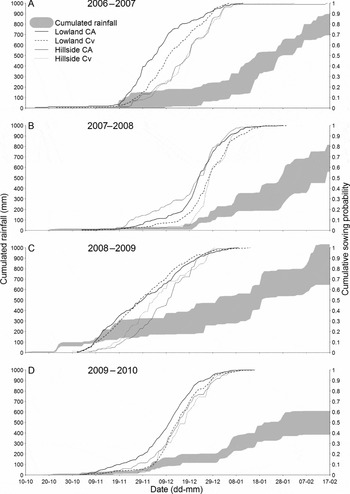
Given the contrasted climatic years (Figure 1), farmers had to adapt their sowing strategy to each rainy season pattern. In 2007–2008 and 2009–2010, the rainy season started late, and a large majority of fields were sown at the time of the first rainfall (81% of fields in 2007–2008; Figures 4b and 4d). For the two other cropping seasons (2006–2007 and 2008–2009), sowing strategies differed depending on landscape position. Lowland fields were sown earlier than hillside fields in both cropping seasons. When comparing tillage systems, we observed that the CA sowing peak occurred 10 days before the Cv sowing peak (Figures 4a and 4c). In 2006–2007, CA sowing was concentrated within a 20-day window, while Cv sowing was spread over 40 days. In 2008–2009, sowing was spread over 50 days for both tillage systems. Hillside fields were sown later than lowland fields and the sowing dates were spread over a 50-day period both years. CA and Cv fields were sown simultaneously in 2006–2007, but CA fields were sown slightly later in 2008–2009. No specific sowing strategy was pursued during these four seasons. Sowing was mostly driven by the rainfall distribution and particularly by the onset of the rainy season.
Cumulated rainfall (the grey-coloured area is limited by the minimum and maximum daily cumulated rainfall observed at the five villages) and cumulative probability of sowing date distribution under Cv and CA for both lowland and hillside during the four crop seasons.

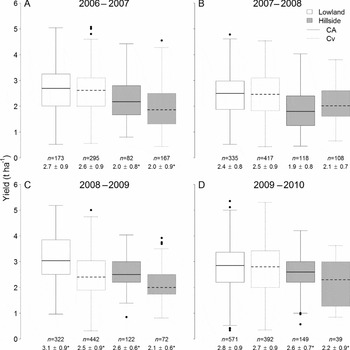
Irrespective of the sowing date, average yields under CA were always equivalent or higher than average yield under Cv each season (Figure 5). The lowest yields were observed during cropping season 2007–2008, the driest one, with no average difference between CA and Cv. Yield differences in favour of CA were observed on hillside fields during the three other rainy seasons and on lowland fields during 2008–2009. These three rainy seasons, averagely better than 2007–2008, underwent an important rainfall deficit during a month. Thus, the intra-annual variability of rainfall did not affect yield under CA when the rainy season was averagely good. For both landscape positions the highest average yield under CA was obtained during the cropping season 2008–2009, the longest and wettest.
Boxplot distribution of rice yields under Cv and CA for both landscape positions in: (A) 2006–2007, (B) 2007–2008, (C) 2008–2009 and (D) 2009–2010. * indicates that the two group means are statistically different according to a Student's t-test.

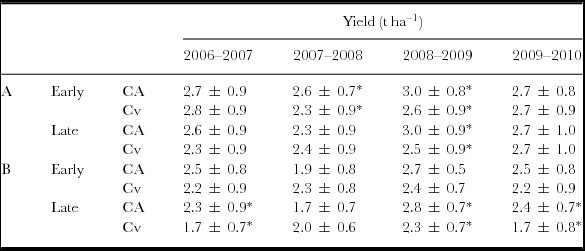
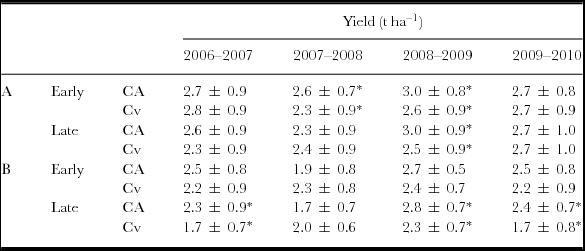
When focusing on extreme sowing dates, both the earliest and latest each year, we observed that average yields under CA were always equivalent or higher than under Cv (Table 4). Yield differences in favour of CA were mainly noted in late-sown fields in 2006–2007 and 2008–2009. In these two cropping seasons, there was a rain deficit in December (Figure 1), which had a higher negative impact on germination under Cv. CA appeared to allow not only early-planting but also delayed sowing which widens the sowing window and enables more flexibility in terms of labour allocation.
Focus on extreme sowing dates. Average yield comparison between CA and Cv for the four cropping seasons, considering the first 25% of sown fields (Early) and the last 25% of sown fields (Late) on: (A) lowland and (B) hillside. * indicates that the two group means are statistically different according to a Student's t-test.
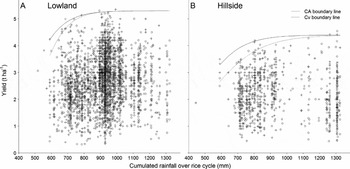
Under a certain threshold of cumulated rainfall during rice cycle, CA appeared to improve the rainfall use efficiency. The boundary line models, fitted to the maximum observed yields at each rainfall level indicate that the attainable yield in lowland fields (5.4 t ha–1) was reached at a threshold of total rainfall of 900 mm, and in hillside fields at 1300 mm. Below this threshold, the lower the total rainfall the larger the yield difference in favour of CA, which exceeded 0.5 t ha−1 for 600 mm of total rainfall in the two landscape positions (Figure 6).
The relationship between cumulated rainfall during rice cycle and yield for both landscape positions. Boundary line models were fitted to the maximum yield observed for each level of rainfall: (A) for Cv y = 5.3 × (1 / (1 + 614exp(–0.0122x))), r 2 = 0.99; for CA y = 5.3 × (1 / (1 + 125exp(–0.0105x))), r 2 = 0.94 and (B) for Cv y = 4.4 × (1/(1 + 31exp(–0.00655x))), r 2 = 0.95; for CA y = 4.4 × (1 / (1 + 50exp(–0.00846x))), r 2 = 0.93.

Ranking factors in the order of yield explicability
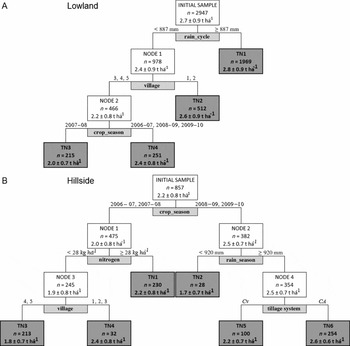
Until now, we focused on the individual effects of landscape position, tillage system, years under consecutive CA cropping, nitrogen fertilisation, rainfall and sowing date. These factors, which are in reality complexly intertwined, were categorised through classification and regression trees for both landscape positions, with ‘rice yield’ as target variable (Figure 7). On lowland fields (n = 2947; Figure 7a), total rainfall during the rice cycle was the main factor that explained the yield variability. Maximum average yields (2.8 ± 0.9 t ha−1 on average) were obtained on fields that received more than 887 mm of cumulated rainfall during the rice cycle (Terminal node 1, n = 1969 fields). Fields that received less than 887 mm of total rainfall (Node 1, n = 978) produced an average yield of 2.4 ± 0.9 t ha−1, and they were further split by village (Node 2, n = 466) and cropping season (Terminal node 3, n = 215). Fields located in Ambongabe, Ampitatsimo or Antsahamamy produced the smallest yields in 2007–2008, of 2.0 ± 0.7 t ha−1 on average, and yields that were on average 20% larger than the rest of the seasons (Terminal node 4, n = 251).
Classification and regression tree models to describe rice yield on: (A) lowland and (B) hillside as a function of agro-environmental and management variables. The initial sample is divided into two nodes (white square boxes) according to a splitting criterion (white font labels) and its threshold (mentioned on the branches). For qualitative variables, the threshold is a list of values such as a list of villages. Each node can be split into two smaller nodes while it is statistically relevant. When a node cannot be split further, it is called a terminal node (TN, grey square boxes). The number of observations and the average yield are contained in each node. The five villages are: 1 = Ambohimiarina, 2 = Ambohitsilaozana, 3 = Ambongabe, 4 = Ampitatsimo and, 5 = Antsahamamy.

On hillside fields (Figure 7b), yields were categorised not only by environmental variables such as locality or cropping season but also by management variables. The highest average yield (2.6 ± 0.6 t ha−1) was obtained in fields cultivated in 2008–2009 or 2009–2010, with more than 920 mm of annual rainfall, and under CA (Terminal node 6, n = 254). In 2006–2007 and 2007–2008, yields were lower and were further split by nitrogen application rate (above or below 28 kg ha–1), and fields receiving less nitrogen yielded more or less depending on the locality. Tillage system (CA vs. Cv) was a splitting criterion for yields in wetter seasons, resulting in the highest average yield, as mentioned above, but most importantly in the lowest standard deviation (23% coefficient of variation). These trees illustrated the weight of the environmental factors and particularly rainfall on rainfed rice production in our dataset, and indicated that the positive effect of CA was part of a combination of factors resulting in the highest yields for the lowest variability.
DISCUSSION
In many parts of sub-Saharan Africa, rainfall is typically erratic and unreliable (Giller et al., Reference Giller, Corbeels, Nyamangara, Triomphe, Affholder, Scopel and Tittonell2011). Combined with the farmers’ low capacity of investment and the poor fertility status of soils, rainfed crop production remains hazardous and unsteady. As shown in the climatic analysis (Figure 1) and the yield frequency distribution of the entire sample of fields monitored in this study (Figure 2), the Lake Alaotra region is not spared. In this context, CA appeared to decrease production risk by increasing yields, on average, and by reducing the coefficient of variation on short to mid-term. These observations were more notorious on hillside than on lowland fields and they contravene the common scheme of yield penalties during the first years of transition to CA that is often reported in the scientific literature (Abdalla et al., Reference Abdalla, Mohamed and Makki2007; Akinyemi Reference Akinyemi2003; Giller et al., Reference Giller, Witter, Corbeels and Tittonell2009). Significant – though relatively narrow – yield differences in favour of CA were observed from the first year of implementation, and they progressively kept on increasing year after year (Figure 3).
The implementation and eventual adoption of CA technologies often come along with an increased use of mineral fertilisers, and the extent of yield benefit actually due to the CA innovation itself becomes hard to identify and isolate (Giller et al., Reference Giller, Witter, Corbeels and Tittonell2009; Naudin et al., Reference Naudin, Gozé, Balarabe, Giller and Scopel2010). In our study, the bias related to the role of fertilisers in yield enhancement could be effectively avoided thanks to the large number of fields that were monitored, among which we observed variable rates of fertiliser use. We showed that even though N fertilisation had a significant positive yield impact for some hillside fields, it was not related to the application of the new CA technology. Indeed, CA did not go hand-in-hand with higher N fertilisation. When comparing yields under CA and Cv on different landscape positions, cropping seasons or consecutive years of CA practice, average yields obtained under CA were always equivalent or even higher, regardless of the extent of N fertilisation. The highest average yields on hillside, with the lowest variability, were obtained under CA without any fertiliser use because of the soaring fertiliser prices experienced since 2008. We thus showed that the increase in yield under CA was not due to an increase in fertiliser. Our results thus indicate that, in these soils, CA does not necessitate higher N input levels to achieve yields similar to those obtained with conventional cropping systems (Abiven and Recous, Reference Abiven and Recous2007). N immobilisation was not systematic under CA in this region, as noted in other sub-Saharan Africa regions (Giller et al., Reference Giller, Witter, Corbeels and Tittonell2009), probably because the CA systems assessed here were diversified crop rotations, with legume cover crops rotating or intercropped with maize prior to rainfed rice under CA.
Early sowing is considered to be one the main advantages of CA. It avoids competition with other crops in terms of labour, without any negative impact on yield. Nevertheless, no comparison across a range of sowing dates has been done to date (Giller et al., Reference Giller, Corbeels, Nyamangara, Triomphe, Affholder, Scopel and Tittonell2011). In this study, early sowing did not seem to be systematically applied on farmers’ fields. Although a small minority of fields under CA were sown earlier, especially during years with late rainy seasons, most fields were sown virtually at the same time. CA sowing was even delayed on hillsides during the 2008–2009 cropping season. Technical, economic and social enabling or constraining factors are intimately linked with farmers’ decision-making. In addition to the technical support provided by the programme, farmers’ own choices resulted in a wide array of probable crop husbandries. The intention to make use of the early sowing advantage of CA was slightly perceptible in the study. The yield comparison at early or late sowing dates showed that yields under CA were always equivalent to or higher than those under Cv. The synchrony between the sowing period and the occurrence of rain storms – which is relatively random – seemed to have a significant impact on productivity (Scopel et al., Reference Scopel, Da Silva, Corbeels, Affholder and Maraux2004). While germination in fields under CA might have benefitted from extra soil moisture due to mulching, germination under Cv suffered from the lack of rain in December during the 2006–2007 and 2008–2009 rainy seasons. These findings open up avenues of research on improving water capture to reduce yield variability associated with erratic rainfall regimes. CA appeared to widen the sowing window, allowing better flexibility not only limited to the early-planting benefit often highlighted in literature. Mulch offers a better environment for sowing, thus reducing the dependency and need for synchrony between the germination stage and major rainfall events, thereby spreading labour demands more evenly. At the farm level, this could be a considerable advantage by avoiding competition with other crops for labour use via backward or forward deferral of sowing.
The overall comparison of rice yields under CA and CV and the single factor comparisons (nitrogen, rainfall, sowing dates, landscape position) gave the same result each time: average yields under CA were equivalent to or even higher than average yields under Cv. The classification and regression tree analysis highlighted the importance of agro-environmental variables in determining yields, in line with empirical findings on maize in southern Africa (Rusinamhodzi et al., Reference Rusinamhodzi, Corbeels, van Wijk, Rufino, Nyamangara, Giller and Wijk2011), revealing that no crop husbandry can totally offset extreme climatic conditions. The 2007–2008 rainy season happened to be the shortest and driest one of the study, resulting in the lowest yields, with no significant yield differences noted between CA and Cv management.
CA showed its best potential under the overall best climatic conditions (Figures 1 and 7). These results could be explained by the weed-control function of mulch (Teasdale and Mohler, Reference Teasdale and Mohler2009). Farmers are better able to control weed emergence in conventional fields when the rainy season is dry. When rainfall is abundant, weeding becomes a real issue that can overwhelm farmers, who are unable to allocate enough labour to this activity (Naudin and Rasolofo, Reference Naudin and Rasolofo2012). In this latter case, the ‘weed prevention’ function of a dense mulch allows better initial crop development, thus increasing the yield difference between CA and Cv. In addition, mulching has a major influence on the water balance – it improves water use efficiency by reducing soil evaporation and run-off and increasing infiltration (Adekalu et al., Reference Adekalu, Olorunfemi and Osunbitan2007; Findeling et al., Reference Findeling, Ruy and Scopel2003; Scopel et al., Reference Scopel, Da Silva, Corbeels, Affholder and Maraux2004). Although the climatic conditions during the 2006–2007 and 2008–2009 rainy seasons appeared to be generally better, a rainfall deficit did occur during the crucial stage of rice germination. The greater yields observed under CA in these seasons suggest also that mulching contributed to buffer the variability associated with erratic rainfall distribution within a season.
CONCLUSION
In the context of Lake Alaotra, Madagascar, we showed clear evidence of CA benefits in short and mid-term for family farmers cultivating upland rice on a wide diversity of environments resulting from the combination soil types, land use history, seasons and management practices (3803 observations). Although the yield differences in favour of CA were only in the order of 20%, this study showed no evidence of yield penalties often observed during the first years of CA adoption. Implementation of CA practices by local family farmers over four consecutive years led to gradual yield increases and gradual reduction of yield variability, particularly on hillside fields, without increasing fertiliser use, and allowing more flexibility in sowing dates to cope with erratic rainfall. As the CA systems implemented included crop rotations, this contributed also to a diversification of the agricultural produce of these family farmers, who grow typically rice monocultures. In a constraining environment, in terms of both biophysical and socioeconomic conditions, the implementation of a new technology which is able to address a direct constraint will immediately express its potential. In the case of upland rice in Lake Alaotra, the capacity of CA to buffer the effect of erratic rainfall may facilitate the process of adoption by family farmers.
Acknowledgements
This paper could not have been published without the support of AIRD/CIRAD within the ‘Doctorant du Sud’ programme and the ABACO project (DCI-FOOD 2010/230-178). We thank all BV/Lac project technicians who actively compiled the on-farm data.