


1. Introduction
Fluid flow around bluff bodies is an important phenomenon that has been extensively studied in fluid mechanics. Bluff body wakes are complex because they involve the interactions of three shear layers in the same problem, a boundary layer, a separating free shear layer and a wake (Williamson Reference Williamson1996). As a basic model for such flows, and with a wide range of engineering applications in its own right, the flow over a circular cylinder has garnered much interest of researchers such as Rayleigh (1879), Bénard (Reference Bénard1908) and Von Karman (Reference Von1911). It is well known that the separated flow behind the cylinder forms a steady and symmetric closed wake for a range of
 $Re$
from around 5–47 (Canuto & Taira Reference Canuto and Taira2015). As
 $Re$
increases beyond the critical Reynolds number (
 $Re_{cr}$
), the flow around the stationary cylinder becomes unstable due to Hopf bifurcation, exhibiting the periodic von Kármán vortex shedding phenomenon (Williamson Reference Williamson1996). This gives rise to strong force fluctuations that are responsible for structural vibrations and acoustic noise. Therefore, extensive research has been conducted on the suppression of vortex shedding using various passive and active control techniques, as summarised by Choi, Jeon & Kim (Reference Choi, Jeon and Kim2008). Although previous research shows that designing flow control strategies mainly relies on expert knowledge, theories that guide effective control design have also been established to enhance the exploration of better control laws (Giannetti & Luchini Reference Giannetti and Luchini2007). Among all control strategies, passive control is simple to implement in engineering practice, while its design is usually empirical and lacks theoretical guidance.
As noted in Lorente-Macias, Bengana & Hwang (Reference Lorente-Macias, Bengana and Hwang2023), an ultimate form of passive flow control is optimal shape design, which deforms the geometry of bodies to maximise or minimise the given objective function to delay the onset of the instability. Generally, the objective function can be formulated in two ways. The first is to adopt the integral aerodynamic coefficients that are either time varying or time averaged. Srinath & Mittal (Reference Srinath and Mittal2010a ) proposed the continuous adjoint approach for the optimisation design of airfoils in unsteady viscous flows, simultaneously improving time-averaged aerodynamic coefficients and enhancing flow stability. Srinath & Mittal (Reference Srinath and Mittal2010b ) also employed three different objective functions to obtain a variety of optimal airfoil geometries: maximise lift, minimise drag and minimise the ratio of drag to lift. Chen, Li & Zhang (Reference Chen, Li and Zhang2019) employed gradient-based shape optimisation to suppress the periodic vortex shedding in the flow past a circular cylinder. The objective function of the optimisation is the integral of the absolute value of the lift coefficient over a vortex shedding period at supercritical Reynolds numbers. After that, Chen et al. (Reference Chen, Gao, Zhang and Gong2022) also adopted the variance of lift coefficient in a period as the optimisation objective to suppress transonic buffet. These attempts are effective but are not computationally efficient, due to the full resolution of unsteady flows.
Global linear instability has generally been identified as responsible for the onset of the vortex shedding process and can help to determine the control strategy in the flow past a cylinder. It predicts how small flow perturbations grow or decay with respect to the base flow with the growth rate (Theofilis Reference Theofilis2011). To search for aerodynamic configurations with enhanced stability, a straightforward consideration is to couple stability analysis and optimisation design. With the growth rate obtained by linear stability analysis at subcritical flows as the optimisation objective, the shape can be optimised to delay the onset of flow unsteadiness, while improving the simulation efficiency. For example, Heuveline & Strauß (Reference Heuveline and Strauß2009) implemented a sequential quadratic programming methodology to find a design that minimises the drag forces and ensures linear stability of the hydrodynamic system. Martinez-Cava et al. (Reference Martinez-Cava, Chávez-Modena, Valero, de Vicente and Ferrer2020) developed a general discrete framework to compute the gradients of a selected global mode (both growth and frequency) obtained from the stability analysis to surface modifications, and applied shape optimisation based on gradients. Wang et al. (Reference Wang, Ferrer, Martínez-Cava, Zheng and Valero2019) stabilised the global instability present on channel contraction, using a genetic algorithm to minimise the real part of the least stable eigenvalue. However, the computation of different eigenvalue spectra often needs different spectral transformations in linear stability analysis (Theofilis Reference Theofilis2011). This increases the difficulty of gradient-based shape optimisation.
Besides stability analysis, resolvent analysis characterises the system behaviours by investigating the frequency responses of the high-dimensional transfer functions. It formulates the governing equations from the perspective of input--output dynamic systems, and analyses the most responsive forcings, the most receptive states and their gains of the dynamical system at a given base flow. It can capture short-term characteristics and transient energy amplification of the perturbation to characterise the flow stability (Schmid Reference Schmid2007; Schmid & Brandt Reference Schmid and Brandt2014; Yuan et al. Reference Yuan, Kou, Gao and Zhang2024). Resolvent analysis was first used in the seminal work of Trefethen et al. (Reference Trefethen, Trefethen, Reddy and Driscoll1993) to identify the non-normality of the linearised operator as the cause of the transient energy amplification of disturbances, even for cases deemed as stable by eigenvalue analysis. It allowed the study of the response of fluid flows to stochastic inputs (Farrell & Ioannou Reference Farrell and Ioannou1993) and harmonic forcing (Hwang & Cossu Reference Hwang and Cossu2010). Sipp et al. (Reference Sipp, Marquet, Meliga and Barbagallo2010) reviewed the methods and results based on the linearisation operator of discrete governing equations, analysed the dynamic characteristics of linear instability and transient amplification in the flow. Thereafter, McKeon & Sharma (Reference McKeon and Sharma2010) proposed the resolvent formulation that treats the nonlinear term in the Fourier-transformed Navier–Stokes (NS) equations as an exogenous harmonic forcing. Iwatani et al. (Reference Iwatani, Asada, Yeh, Taira and Kawai2023) investigated the self-sustaining mechanism of transonic shock buffet through resolvent analysis, revealing that the forcing modes indicated the bypassing of separation-induced pressure pulsations beyond the shock wave to the upstream region, causing shock wave oscillations. Other reseachers have also used this method to analyse the mechanism of buffet (Sartor, Mettot & Sipp Reference Sartor, Mettot and Sipp2015; Houtman, Timme & Sharma Reference Houtman, Timme and Sharma2023), the flow past bluff bodies (Symon et al. Reference Symon, Rosenberg, Dawson and McKeon2018; Yuan et al. Reference Yuan, Kou, Gao and Zhang2023), turbulent channel flows (Moarref et al. Reference Moarref, Sharma, Tropp and McKeon2013), turbulent jets (Schmidt et al. Reference Schmidt, Towne, Rigas, Colonius and Brès2018; Lesshafft et al. Reference Lesshafft, Semeraro, Jaunet, Cavalieri and Jordan2019) and so on. The resolvent framework can also be augmented by adding eddy viscosity to better model nonlinear processes in the input. To this end, Fan et al. (Reference Fan, Kozul, Li and Sandberg2024) proposed two improved eddy-viscosity models. Wu & He (Reference Wu and He2023) and Ying et al. (Reference Ying, Liang, Li and Fu2023) established the multiple-resolvent composition and the resolvent-informed white-noise-based estimation model, respectively. Lazpita et al. (Reference Lazpita, Garicano-Mena, Paniagua, Le Clainche and Valero2024) examined the broad applicability of resolvent analysis across diverse base flows and established a data-driven framework for deriving the resolvent operator. Both the computational efficiency and the practical utility of resolvent analysis have been improved.
From an input–output viewpoint that focuses on the particular response under certain forcings, resolvent analysis is particularly relevant for flow control (Jovanović & Bamieh Reference Jovanović and Bamieh2005; Jovanović Reference Jovanović2021). For example, Kojima et al. (Reference Kojima, Yeh, Taira and Kameda2020) identified the principal sensitive areas of transonic shock buffet through resolvent analysis, which coincided with the regions where flow control performs well. According to the framework of resolvent analysis, the forcing mode provides the sensitivity to external excitation and guides the design of the actuation position. This idea has also been adopted in passive or active control for supersonic flow (Doshi et al. Reference Doshi, Ranjan, Liu, Gist, Gaitonde and Glauser2021), laminar flow separation (Gross, Marks & Sondergaard Reference Gross, Marks and Sondergaard2024), turbulent cavity flow (Liu et al. Reference Liu, Sun, Yeh, Ukeiley, Cattafesta and Taira2021) and so on. The actuation frequency of active control can be designed by the resolvent gain (Gross et al. Reference Gross, Marks and Sondergaard2024) and the integrated kinetic energy (Liu et al. Reference Liu, Sun, Yeh, Ukeiley, Cattafesta and Taira2021). Yeh & Taira (Reference Yeh and Taira2019) identified the actuation frequency and wavenumber that lead to large perturbation energy amplification to provided design guidelines for separation control through resolvent analysis. Herrmann et al. (Reference Herrmann, Baddoo, Dawson, Semaan, Brunton and McKeon2023) introduced interpolatory input and output projections that can be leveraged for sensor and actuator placement and open-loop control design. With the body forces that serve as an actuator, Jin, Illingworth & Sandberg (Reference Jin, Illingworth and Sandberg2020) established the reduced-order model of closed-loop control based on resolvent analysis to find the optimal control law. Taira et al. (Reference Taira, Brunton, Dawson, Rowley, Colonius, McKeon, Schmidt, Gordeyev, Theofilis and Ukeiley2017, Reference Taira, Hemati, Brunton, Sun, Duraisamy, Bagheri, Dawson and Yeh2020) reviewed the theoretical framework and the applications of resolvent analysis to study, model and control canonical flows. By comparing resolvent modes and gains before and after flow control, researchers have analysed the effects of flow control on drag reduction (Luhar, Sharma & McKeon Reference Luhar, Sharma and McKeon2014; Nakashima, Fukagata & Luhar Reference Nakashima, Fukagata and Luhar2017; Kawagoe et al. Reference Kawagoe, Nakashima, Luhar and Fukagata2019). Zhuang et al. (Reference Zhuang, Wan, Liu, Sun and Lu2024) examined the influence of the blowing/suction flux and amplitude on instability through resolvent analysis, which demonstrates that disturbances dominating the early transition stage are dampened in the controlled flow.
As an alternative to stability-based aerodynamic shape optimisation, it is naturally to couple resolvent analysis and shape optimisation for passive flow control to enhance the flow stability. To the best of our knowledge, Chavarin & Luhar (Reference Chavarin and Luhar2022) were the first to propose shape optimisation strategy based on resolvent analysis. The objective is to reduce the total drag for channel flows by incorporating the effects of riblets, which behave like a noise amplifier (Chavarin & Luhar Reference Chavarin and Luhar2020). In this paper we extend their work for oscillator-type flows utilizing the analytical correlation between resolvent analysis and linear stability analysis. This approach successfully enhances the stability of flow over a circular cylinder. To establish the optimisation framework, we adopt the maximum resolvent gain as the objective function, differing from traditional approaches for oscillator-type flows that rely on stability analysis. Our results demonstrate that the optimised configuration effectively delays flow separation while reducing lift oscillations and time-averaged drag. Furthermore, the drag reduction persists even at a Reynolds number of 3900, where turbulent wake flows are present.
The rest of this paper is organised as follows. Section 2.1 provides a concise overview of resolvent analysis and input--output analysis. Thereafter, in § 2.2 we elucidate the relationship between resolvent analysis and stability analysis. We propose to use the maximum resolvent gain in the objective function for shape optimisation, as it effectively characterises global flow stability and simplifies the calculation. The optimisation problem can be efficiently solved using the nonlinear conjugate gradient algorithm in § 2.3. We then test the proposed resolvent-based optimisation through improving the stability of the one-dimensional Ginzburg–Landau (GL) equation in § 2.4. Furthermore, this methodology is implemented to passively control and suppress vortex shedding of a circular cylinder. Detailed results are presented in § 3.1. Furthermore, we perform dynamic mode decomposition (DMD) on the initial and optimised shapes in § 3.2. We also analyse the physical mechanisms of enhanced flow stability and drag reduction in § 3.3. Finally, the conclusions are summarised in § 4.
2. Methodology
This section introduces the proposed optimisation framework. Firstly, we present a brief formulation of resolvent and input–output analysis. Secondly, we show the correlation between resolvent and stability analyses and suggest use of the optimisation objective based on the resolvent gain. Finally, we define the generalised optimisation problem and test it on the one-dimensional GL equation.
2.1. Resolvent and input–output analyses
In resolvent analysis, the governing equations under the semi-discrete operator form is first established, i.e.
 \begin{equation} \frac {\partial \boldsymbol{q}}{\partial t} = \boldsymbol{R}(\boldsymbol{q}(\boldsymbol{x},t)), \end{equation}
where
 $\boldsymbol{q}$
and
 $\boldsymbol{R}$
are the flow variables and nonlinear operators of fluid governing equations, respectively. Considering the Reynolds decomposition of the flow variables
 $\boldsymbol{q}(\boldsymbol{x},t) = \boldsymbol{\bar {q}}(\boldsymbol{x})+\boldsymbol{q}'(\boldsymbol{x},t)$
, where
 $\boldsymbol{\bar {q}}(\boldsymbol{x})$
is base flow and
 $\boldsymbol{q}^{\prime}(\boldsymbol{x},t)$
is the perturbation of the flow field. Substituting the Reynolds decomposition into (2.1), a forced linearised dynamical system can be obtained, i.e.
 \begin{equation} \frac {\partial \boldsymbol{q}'}{\partial t}=\boldsymbol{Aq}'+\boldsymbol{f}, \end{equation}
where
 $\boldsymbol{A}= {\partial \boldsymbol{R}}/{\partial \boldsymbol{q}}$
is the linearised operator of the governing equations (i.e. the Jacobian matrix of the fluid system). Here
 $\boldsymbol{f}$
is an external forcing that contains the nonlinear term in the governing equations, disturbances from the environment and so on. The forcing and corresponding flow response, given a harmonic forcing with frequency
 $\omega$
, are further expressed as
 \begin{align}& \boldsymbol{f}(t)=\hat {\boldsymbol{\kern-2pt f}} e^{i\omega t}+c . c . ,\end{align}
 \begin{align}& \boldsymbol{q}'(t)=\hat {\boldsymbol{q}} e^{i\omega t}+c . c ., \\[12pt] \nonumber \end{align}
where
 $c.c.$
means complex conjugate. Substituting these into (2.2), the transfer functions of the forcing and response of the dynamic system are obtained as
 \begin{equation} \hat {\boldsymbol{q}}=(i \omega \boldsymbol{I}-\boldsymbol{A})^{-1} \hat {\boldsymbol{\kern-2pt f}}, \end{equation}
where
 $\boldsymbol{H}(\omega )=(i \omega \boldsymbol{I}-\boldsymbol{A})^{-1}$
is the matrix approximation of the resolvent operator.
In order to study the amplification of the system subjected to harmonic forcings with different frequencies, the physically relevant norm of the state vector is defined as
 $\|\boldsymbol{q}\|_Q^2=\boldsymbol{q}^{*}\boldsymbol{Q}\boldsymbol{q}$
. Here
 $\boldsymbol{Q}=\boldsymbol{F}^{*}\boldsymbol{F}$
is the positive-definite weighting matrix, where
 $*$
represents the Hermitian transpose. This weighting can account for integration quadratures, non-uniform spatial discretisations (Yuan et al. Reference Yuan, Kou, Gao and Zhang2023) or energy distribution (Yeh & Taira Reference Yeh and Taira2019) in physical systems. The relation between the physically relevant norm and the standard Euclidean 2-norm is
 $\|\boldsymbol{q}\|_Q^2=\|\boldsymbol{F} \boldsymbol{q}\|_2^2$
. Thus, the amplification of the system subjected to harmonic forcings can be quantified by the ratio of the physically relevant norm of the response to the forcing (Herrmann et al. Reference Herrmann, Baddoo, Semaan, Brunton and McKeon2021):
 \begin{equation} \sigma _1(\omega )=\max _{\hat {\boldsymbol{\kern-2pt f}} \neq 0} \frac {\|\hat {\boldsymbol{q}}\|_Q^2}{\|\hat {\boldsymbol{\kern-2pt f}}\|_Q^2}=\max _{\hat {\boldsymbol{\kern-2pt f}} \neq 0} \frac {\|\boldsymbol{H}(\omega ) \hat {\boldsymbol{\kern-2pt f}}\|_Q^2}{\|\hat {\boldsymbol{\kern-2pt f}}\|_Q^2}=\|\boldsymbol{F} \boldsymbol{H}(\omega ) \boldsymbol{F}^{-1}\|_2^2 .\end{equation}
The resolvent gain
 $\sigma _1(\omega )$
, along with a hierarchy of optimal forcing and response modes, is given by the singular value decomposition (SVD) of the weighted resolvent operator
 \begin{equation} \boldsymbol{F H}(\omega ) \boldsymbol{F}^{-1}=\boldsymbol{\Psi }_F(\omega ) \boldsymbol{\Sigma }(\omega ) \boldsymbol{\Phi }_F^*(\omega ), \end{equation}
where
 $\boldsymbol{\Sigma }(\omega )$
is a diagonal matrix containing the singular values
 $\sigma _1(\omega )\gt \sigma _2(\omega )\gt \cdots \gt \sigma _i(\omega )\gt \cdots \gt \sigma _n(\omega )$
, and
 $\sigma _i(\omega )$
is known as the
 $i$
th order resolvent gain. The resulting frequency-gain curve can characterise the amplification of the system to the external input with different frequencies. The frequency corresponding to the maximum resolvent gain is called the most sensitive frequency. The column vectors of
 $\boldsymbol{F}^{-1}\boldsymbol{\Psi }_F(\omega )$
and
 $\boldsymbol{F}^{-1}\boldsymbol{\Phi }_F(\omega )$
(i.e.
 $\boldsymbol{\psi }_i,\boldsymbol{\phi }_i$
) are the corresponding response and forcing modes, respectively.
Based on the conventional resolvent analysis, input--output analysis further restricts the subspaces according the quantities of interest. In particular, it allows the analysis where only certain measurements are available (e.g. on a specific region of the spatial domain) and where the possible types of actuation are limited (Kojima et al. Reference Kojima, Yeh, Taira and Kameda2020):
 \begin{equation} \boldsymbol{y}=\boldsymbol{C}\hat {\boldsymbol{q}},\quad \hat {\boldsymbol{\kern-2pt f}}=\boldsymbol{B}\boldsymbol{u} .\end{equation}
Substituting these into (2.5), the transfer functions of the dynamic system can also be obtained:
 \begin{equation} \boldsymbol{y}=\boldsymbol{C}(i \omega \boldsymbol{I}-\boldsymbol{A})^{-1}\boldsymbol{B}\boldsymbol{u}. \end{equation}
Norms based on inner products for the input and output spaces then become
 \begin{align} \|\boldsymbol{y}\|^2_{Q_y}=\boldsymbol{y}^{*}\boldsymbol{Q}_y\boldsymbol{y}=\boldsymbol{y}^{*}\boldsymbol{F}_y^*\boldsymbol{F}_y\boldsymbol{y}, \notag\\ \|\boldsymbol{u}\|_{Q_u}^2=\boldsymbol{u}^{*}\boldsymbol{Q}_u\boldsymbol{u}=\boldsymbol{u}^{*}\boldsymbol{F}_u^*\boldsymbol{F}_u\boldsymbol{u} .\end{align}
Similarly, input–output analysis then amounts to taking the SVD of the windowed resolvent operator
 $\boldsymbol{C H}(\omega )\boldsymbol{B}$
,
 \begin{equation} \boldsymbol{F}_y \boldsymbol{C H}(\omega ) \boldsymbol{B}\boldsymbol{F}_{u}^{-1}=\boldsymbol{\Psi }_C(\omega ) \boldsymbol{\Sigma }(\omega ) \boldsymbol{\Phi }_B^*(\omega ) ,\end{equation}
where
 $\boldsymbol{\Sigma }(\omega )$
is a diagonal matrix that the input-output gains located in diagonal elements, and the input and output modes are given by the column vectors of
 $\boldsymbol{F}^{-1}_u\boldsymbol{\Phi }_B(\omega )$
and
 $\boldsymbol{F}^{-1}_y\boldsymbol{\Psi }_C(\omega )$
, respectively. The structure and the interpretation of the resolvent operator differ between the compressible (Rolandi et al. Reference Rolandi, Ribeiro, Yeh and Taira2024) and incompressible (McKeon & Sharma Reference McKeon and Sharma2010) formulations of the NS equations, while the focus of this paper is on the compressible formulation.
2.2. Optimisation objective
This section justifies the use of resolvent gain as the objective function for the present optimisation task, through clarifying the correlations between resolvent and global linear stability analyses. Here, we consider global linear stability analysis based on the same base flow and linearised system and resolvent analysis. Substituting the eigendecomposition of the Jacobian matrix into the resolvent operator, the resolvent gain becomes
 \begin{equation} \sigma _1(\omega )=\|\boldsymbol{H}(\omega )\|_Q^2=\|\boldsymbol{G}(i \omega \boldsymbol{I}-\boldsymbol{\Lambda })^{-1}\boldsymbol{G}^{-1}\|_Q^2 . \end{equation}
where
 $\boldsymbol{A} = \boldsymbol{G} \boldsymbol{\Lambda }\boldsymbol{G}^{-1}$
and
 $\boldsymbol{\Lambda }, \boldsymbol{G}$
are the matrices containing eigenvalues and eigenvectors of the Jacobian matrix, respectively.
Firstly, considering normal systems, the Jacobian matrix
 $\boldsymbol{A}$
has orthogonal eigenvectors. Therefore, the resulting unitary matrices
 $\boldsymbol{G}$
and its inverse does not affect the value of the norm
 \begin{equation} \sigma _1(\omega )=\|(i \omega \boldsymbol{I}-\boldsymbol{\Lambda })^{-1}\|_Q^2 .\end{equation}
This indicates that when excitation frequency is equal to one of the eigenfrequencies of the forced system,
 $\sigma _1$
tends to reach the local maximum, which aligns with the classical definition of a resonance. Among these eigenmodes, the least stable one will lead to the strongest resonance, corresponding to the maximum resolvent gain. Therefore, resolvent gain can directly characterise the stability for normal systems.
However, realistic flow systems are always non-normal, thus complicating the analysis. For non-normal systems, the most sensitive frequency can be far from any eigenfrequency of the Jacobian matrix
 $\boldsymbol{A}$
, which is referred to as pseudoresonances (Schmid & Brandt Reference Schmid and Brandt2014). In such scenarios, the resolvent operator can be expressed by the gain and corresponding resolvent modes, using the discrete form of the SVD
 \begin{equation} \boldsymbol{H}(\omega ) = \sum _{j=1}^{n} \boldsymbol{\psi }_{j} (\omega ) \sigma _j (\omega ) \boldsymbol{\phi }_{j}^* (\omega ). \end{equation}
In the frequency range satisfying
 $\sigma _1 (\omega )\gt \gt \sigma _2 (\omega )$
, where the amplification between the forcing and response are mainly dominated by the first-order resolvent properties, the resolvent operator can be approximated as
 \begin{equation} \boldsymbol{H}(\omega ) \approx \boldsymbol{\psi }_{1} (\omega ) \sigma _1 (\omega ) \boldsymbol{\phi }_{1}^* (\omega ) .\end{equation}
This is called the rank-1 approximation of the resolvent operator. Meanwhile, the resolvent operator can also be expanded by the forward and adjoint modes of the Jacobian matrix (Symon et al. Reference Symon, Rosenberg, Dawson and McKeon2018)
 \begin{equation} \boldsymbol{H}(\omega ) = \sum _{j=1}^{n} (i \omega -\eta _j)^{-1} \boldsymbol{g}_{j} \boldsymbol{h}_{j}^*, \end{equation}
where
 $\eta _j$
is the
 $j$
th eigenvalue obtained by linear stability analysis, sorted in descending order according to the real part, i.e. the growth rate.
 $\boldsymbol{g}_{j}$
and
 $\boldsymbol{h}_{j}$
are the corresponding forward and adjoint modes, respectively. When the forcing frequency is identical to the least stable frequency, if the least stable eigenvalue is far from the other eigenvalues and the real part of it is close to zero, its contribution to the series dominates over the contributions from all other eigenvalues. Then (2.16) can be approximated as
 \begin{equation} \boldsymbol{H}(\omega ) \approx (i \omega -\eta _1)^{-1} \boldsymbol{g}_{1} \boldsymbol{h}_{1}^* ,\end{equation}
which represents the other rank-1 approximation of the resolvent operator. It holds only when the flow is close enough to the critical state and there is sufficient separation of eigenvalues at the least stable frequency. As the flow gradually becomes unstable, the first-order eigenmode will dominate the forced response of the system, i.e.
 $\sigma _1 (\omega )\gt \gt \sigma _2 (\omega )$
. Taking (2.15), we have
 \begin{equation} \sigma _1 (\omega ) \boldsymbol{\psi }_{1} (\omega ) \boldsymbol{\phi }_{1}^* (\omega ) \approx (i \omega -\eta _1)^{-1} \boldsymbol{g}_{1} \boldsymbol{h}_{1}^* ,\end{equation}
which leads to two observations: (i) the least stable frequency corresponds to the maximum gain, and (ii) the maximum gain is proportional to the reciprocal of the absolute value of the growth rate. Therefore, the larger the growth rate, the greater the maximum gain becomes. The leading resolvent response and forcing modes are proportional to the forward and adjoint eigenmodes, respectively (Symon et al. Reference Symon, Rosenberg, Dawson and McKeon2018).
Nevertheless, not all types of flow satisfy the rank-1 approximation. According to Sipp et al. (Reference Sipp, Marquet, Meliga and Barbagallo2010), occurrences of unsteadiness in flows can be classified into two main categories: oscillators and noise amplifiers. The concepts of absolute and convective instabilities were also introduced to describe the dynamics of the oscillator and amplifier, respectively. The oscillator-type flow refers to the system dominated by one pair of eigenmodes that is distinct from others. Therefore, the response of the flow system to external excitation remains dominated by this pair of eigenmode, making the rank-1 approximation hold. Apparently, both the least stable growth rate and maximum resolvent gain can characterise the flow stability. For example, the flow around a cylinder at low Reynolds numbers (e.g.
 $47 \lt Re \lt 180$
) is typical of the oscillator-type flow. However, accurately computing the growth rate of the most unstable mode from stability analysis during shape optimisation can be significantly more challenging. This difficulty primarily arises from the challenge of determining appropriate parameters for spectral transformation (Theofilis Reference Theofilis2011) as the geometry evolves. Consequently, the extraction of the most unstable eigenvalue can be easily contaminated by non-physical modes. Therefore, the mode selection algorithm and the surrogate model are usually considered (Wang et al. Reference Wang, Ferrer, Martínez-Cava, Zheng and Valero2019). In contrast, spectral transformation is not necessary for resolvent analysis. This resolvent-based optimisation framework not only improves computational efficiency but also eliminates the need for the complex mode selection process typically required in stability analysis.
For noise amplifiers, the separation between eigenvalues in the complex space is not obvious, indicating multiple dominant eigenmodes exist that violate the rank-1 approximation. Owing to the non-orthogonality of these eigenmodes, small perturbations may be significantly amplified, even though all eigenvalues of the system are stable (Schmid Reference Schmid2007). This is the main difference compared with oscillator-type flows, making traditional stability analysis fail. For example, a homogeneous jet or a boundary-layer flow is representative of noise amplifiers. To enhance the stability of these flows, it is essential to reduce the maximum amplification across all frequencies, where resolvent gain becomes the natural choice. Although this is beyond the scope of the present work, it gives promising research direction in the future.
According to these two types of unsteadiness, existing works on shape optimisation can be classified as shown in table 1. Since this paper focuses on the flow past a cylinder, resolvent-based optimisation for oscillator-type flows is studied. This offers an alternative approach for such flows, which is more computationally efficient compared with stability-based optimisation, as described above.
Research on shape optimisation of unsteady flow over obstacles according to different types of unsteadiness.

2.3. Nonlinear conjugate gradient algorithm
In general, the resolvent optimisation framework can be formulated as
 \begin{align} &min\{\sigma _{max} (\boldsymbol{D}_k)\}\notag \\ &s.t. \text{ } g(\boldsymbol{D}_k) \geqslant 0 ,\end{align}
where
 $\boldsymbol{D}_k$
contains the design parameter after
 $k$
times of optimisation. Here
 $\sigma _{max} (\boldsymbol{D}_k)$
and
 $g(\boldsymbol{D}_k)$
are the corresponding maximum resolvent gain and constraint function, respectively. The penalty method is used to transform the constrained optimisation problem into an unconstrained one, and the transformed objective function
 $f(\boldsymbol{D}_k)$
at step
 $k$
is defined as
 \begin{equation} f(\boldsymbol{D}_k)=\sigma _{max}(\boldsymbol{D}_k)+\lambda *\max \{-g(\boldsymbol{D}_k),0 \} ,\end{equation}
where
 $\lambda$
is the penalty parameter. This problem can be efficiently solved by the nonlinear conjugate gradient method that yields the largest reduction in resolvent gain. The search direction
 $\boldsymbol{p}_k$
at step
 $k$
is computed by the superposition of the gradient of the objective function
 $\nabla f_k$
and the previous direction
 \begin{equation} \boldsymbol{p}_k=-\nabla f_k+\beta _k \boldsymbol{p}_{k-1}. \end{equation}
In the conjugate gradient method for linear systems,
 $\beta _k$
is a constant that ensures the new search direction is orthogonal to the previous search direction. For nonlinear problems, we implement the modified Polak–Ribière–Polyak (PRP) procedure with a restart procedure (Chavarin & Luhar Reference Chavarin and Luhar2022):
 \begin{equation} \left \{ \begin{aligned} &\beta _k^{PRP}=\frac {\nabla f_k^T(\nabla f_k-\nabla f_{k-1})}{\nabla f_{k-1}^T\nabla f_{k-1}},\\ &\beta _k=\max \{0,\beta _k^{PRP}\}. \end{aligned} \right . \end{equation}
The PRP method avoids the computation of the Hessian of the objective function and instead uses a relaxed conjugacy condition. When the objective function fails to decrease at step
 $k$
(
 $\nabla f_k=\nabla f_{k+1}$
causes
 $\beta _{k+1}=0$
), the algorithm restarts and discards all the information collected from the previous steps. With an updated search direction, a suitable step size
 $\alpha _k$
must be computed to advance the optimisation:
 \begin{equation} \boldsymbol{D}_{k+1}=\boldsymbol{D}_{k}+\alpha _k \boldsymbol{p}_{k} .\end{equation}
This step size is obtained by solving the one-dimensional minimisation problem
 $\min \limits _{\alpha _k} f(\boldsymbol{D}_k+\alpha _k \boldsymbol{p}_{k})$
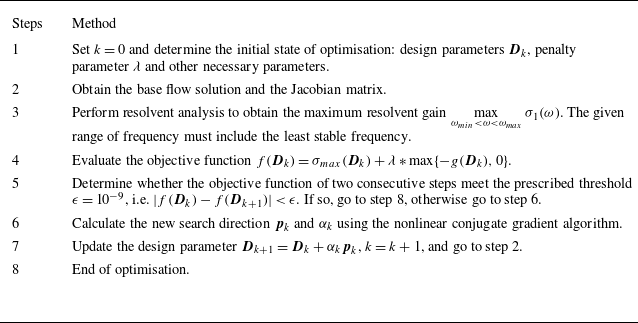
. The optimisation process is summarised in table 2 and figure 1. We used the finite difference method to calculate the gradient of the resolvent gain with respect to design variables. This approach is both reliable and straightforward to implement within any numerical framework. It is worth noting that the algorithm has a restart procedure. Therefore, only when the objective function of two consecutive steps meet the prescribe threshold
 $\epsilon$
, i.e.
 $|f(\boldsymbol{D}_k)-f(\boldsymbol{D}_{k+1})|\lt \epsilon$
, the optimisation terminates.
The proposed resolvent-based optimisation algorithm.

The proposed resolvent-based optimisation process.

2.4. Resolvent-based optimisation for the GL equation
In this section we test different optimisation frameworks through improving the stability of the one-dimensional GL equation. The optimised results with different objective functions are compared. The GL equation is a classic model for instabilities in spatially evolving flows, which can mimic convection, dissipation and exponential instability in the flow:
 \begin{equation} \left \{ \begin{aligned} \dot {u}=-v \frac {\partial u}{\partial x}+\gamma \frac {\partial ^{2} u}{\partial x^{2}}+\mu (x) u, \\ \mu (x)=\left (\mu _{0}-c_{u}^{2}\right )+\left (\mu _{2} / 2\right ) x^{2}. \end{aligned} \right . \end{equation}
Here the convection and the dissipation of the modelled flow are represented by the complex terms
 $v=U+2ic_u$
and
 $\gamma =1+ic_d$
, respectively. The parameter
 $\mu _2$
plays a dual role: for large values, the system is strongly non-parallel but weakly non-normal; otherwise the system represents weakly non-parallel but strongly non-normal flow. The real-valued term
 $\mu _{0}-c_{u}^{2}$
is related to exponential instability. The eigenvalue problem of the Jacobian matrix for the GL equation can be solved analytically (Bagheri et al. Reference Bagheri, Henningson, Hœpffner and Schmid2009), i.e.
 \begin{equation} \eta _n=(\mu _{0}-c_{u}^{2})-(v^2/4\gamma )-(n+1/2)\sqrt {-2 \mu _2 \gamma } ,\end{equation}
where
 $\eta _n$
is the
 $n$
th eigenvalue of the system (
 $n$
starts from 0), which is only related to parameters of the equation. Therefore, the design parameters are set as
 $\boldsymbol{D}_k=\{\mu _0,v,\mu _2,c_u,\gamma \}_k$
. The initial state is
 $\mu _{0}=0.23, \mu _{2}=-0.01, v=2+0.4i, \gamma =1-i$
, which is the same as Herrmann et al. (Reference Herrmann, Baddoo, Semaan, Brunton and McKeon2021) to ensure the accuracy of the results.
Apparently, the GL equation represents a linear system and the goal of optimisation is to make the eigenvalue in (2.25) more stable. Its steady solution is
 $u_B(x,t) = 0$
and the initial state is linearly stable. Using the Chebyshev spectral method for accurate numerical discretisation on
 $x\in [-85,85]$
, the matrix representation of the linear operator (i.e. the Jacobian matrix
 $\boldsymbol{A}$
) can be obtained. The most sensitive frequency obtained from the standard resolvent analysis is
 $\omega =0.56$
. Therefore, the objective function of optimisation based on resolvent analysis is set to the maximum gain within
 $\omega \in [-3,3]$
. Since the dimension of the Jacobian matrix
 $\boldsymbol{A}$
is only
 $\mathcal{O}(10^2)$
, eigenvalue decomposition can be directly performed to obtain the full eigenspectrum. The maximum value of its real part is the objective function for the stability-based optimisation framework, which can be expressed as
 \begin{align} &min\{Re_{max} (\boldsymbol{D}_k)\}\notag\\ &s.t. \left \{ \begin{aligned} &\Vert \boldsymbol{D}_k \Vert _1 \approx \Vert \boldsymbol{D}_0 \Vert _1,\\ &Re_{max} = \max \{real(eig (\boldsymbol{A}))\} .\end{aligned} \right . \end{align}
The constraint function and the optimisation method are consistent with the resolvent-based optimisation framework. Both optimisation methods utilise the
 $L_1$
norm of the design variables as a constraint function. It is worth noting that such stability-based optimisation is very difficult to implement in more complex flows whose dimension is much higher.
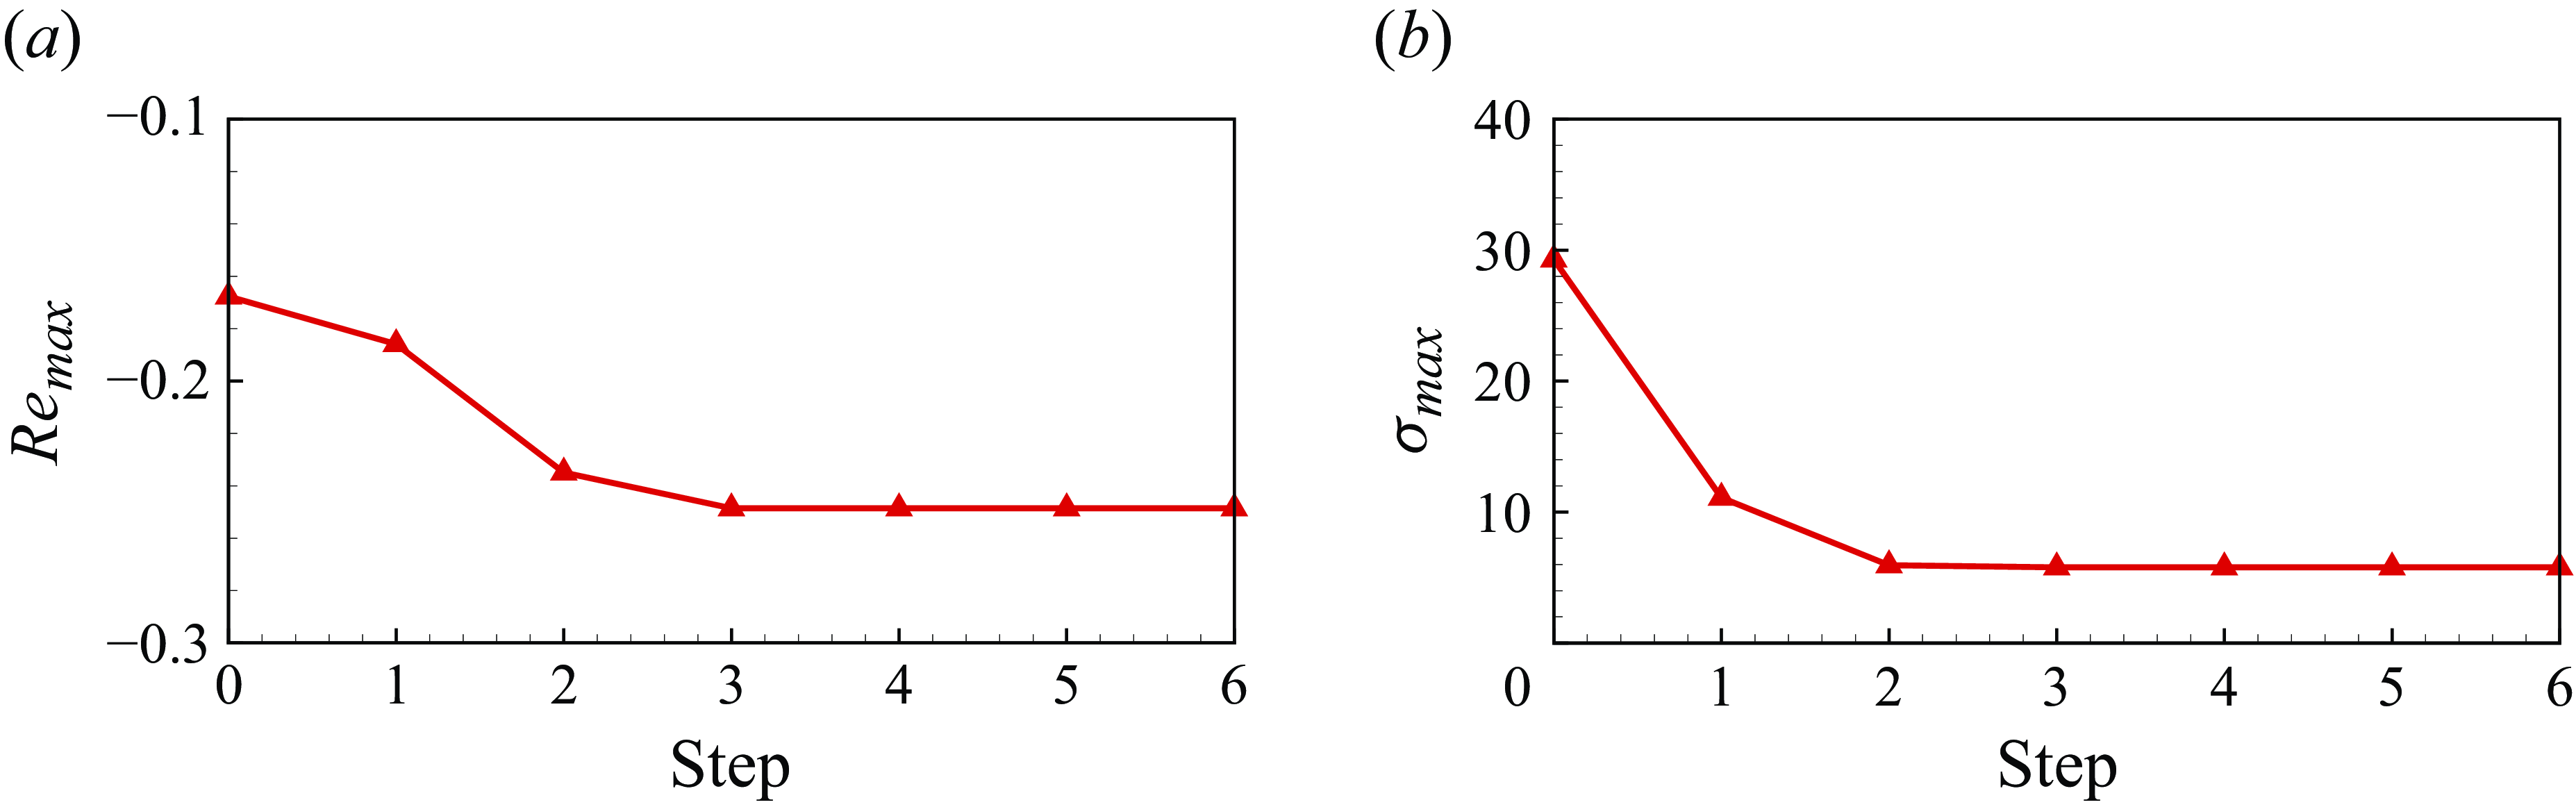
The convergent histories of different types of optimisation are shown in figure 2. The objective functions of both stability-based and resolvent-based optimisations are significantly reduced, and the convergence is achieved after the sixth step. The least stable growth rate is reduced from −0.17 to −0.25, which is about
 $47\, \%$
reduction. The maximum resolvent gain is reduced from 29.3 to 5.8, which is about
 $80\, \%$
reduction. The frequency-gain curves of the GL equation before and after optimisation are shown in figure 3. Although only the maximum gain is taken as the objective function, resolvent gain corresponding to a large range of frequency decreases after optimisation. The most sensitive frequency of the optimised system is 0.52, which remains almost unchanged.
Convergent history of different types of optimisations. (a) The least stable growth rate in stability-based optimisation. (b) The maximum resolvent gain in resolvent-based optimisation.

The frequency-gain curve of GL equation before and after optimisation.

To evaluate the optimisation effect, we apply linear stability analysis to the system before and after optimisation. Figures 4(a) and 4(b) show the eigenvalue spectra of the system before and after the optimisation based on different strategies. Compared with the initial system, the growth rate of the optimised systems have both been reduced, indicating that both methods can effectively improve the stability of the GL equation. Comparison of the global spectra of the two optimised systems is shown in figure 4(c). Although resolvent gain is an indirect objective to characterise the flow stability, the optimised system can become more stable. This shows the validity of the proposed resolvent-based optimisation method.
The comparison of linear stability analysis in different systems. (a) The initial and stability-based optimised systems. (b) The initial and resolvent-based optimised systems. (c) The stability-based and resolvent-based optimised systems.

3. Results and discussion
In this section we apply the proposed optimisation framework to flow past a cylinder. Through shape optimisation, the flow stability is improved, leading to the reduction of vortex shedding and drag forces. Detailed investigations are performed on analysing the physical mechanism of improved stability and drag reduction of the optimised geometry.
3.1. The optimisation problem and results
The flow past cylinders widely exists in nature and engineering practice, which contains many complex phenomena, such as flow separation, shear layer instability and turbulence. A circular cylinder is a representative bluff body commonly investigated in the community. The flow past a stationary cylinder behaves like a typical oscillator that becomes unstable due to global instability. Therefore, we utilise the proposed optimisation framework to achieve passive control that suppresses the vortex shedding and enhances flow stability.
Graphic illustration of the proposed resolvent-based shape optimisation of two-dimensional cylinders.

To describe the geometry of bluff bodies, the class-shape function transformation (CST) parameters of the cylinder is used as the design variable. It can fit more complex shapes with fewer parameters, thereby reducing the number of design variables and improving computational efficiency. Computing the gradient of the resolvent gain with respect to eight CST design parameters requires approximately an hour of computation time based on the present 21,702-element grid for a workstation using a single Intel(R) Xeon(R) Platinum 8251C CPU @ 3.80 GHz. To obtain the representative base flow solution and maintain low computational cost, the subcritical state
 $Re=40$
that is close to instability is taken as the design state. The forcing frequency range is
 $0\lt St\lt 0.16$
, encompassing the least stable frequency that is almost equal to the most sensitive frequency corresponding to the maximum gain, i.e. the objective function (
 $St=f_vD/U_{\infty }$
, where
 $f_v$
is the vortex shedding frequency). To ensure reasonable optimisation, the area of the optimised shape should not be less than the initial value. The penalty method is used to deal with the area constraint. We set lower bounds for the CST parameters to ensure that the optimisation process does not generate infeasible geometries or excessive deformations that could lead to invalid grids. This is achieved by limiting the step size in the optimisation process. The shape optimisation problem is expressed as
 \begin{align} &min\{\sigma _{max} (\boldsymbol{D}_k)\}\notag\\ &s.t. \left \{ \begin{aligned} &S(\boldsymbol{D}_k) \geqslant S(\boldsymbol{D}_0),\\ &min\{\boldsymbol{D}_k\}\gt 0.6, \end{aligned} \right . \end{align}
where
 $\boldsymbol{D}_k=\{a_{1,k}, a_{2,k}, \cdots , a_{8,k}\}$
is the CST parameter vector controlling the upper surface after
 $k$
times of optimisation. Note here we consider the symmetrical bluff bodies. According to Chen et al. (Reference Chen, Li and Zhang2019), the accuracy of the CST method with eight parameters is acceptable. Here
 $S(\boldsymbol{D}_k)$
represents the area of the cross-section. The process of shape optimisation of the cylinder based on resolvent analysis is shown in figure 5.
Furthermore, an accurate computational fluid dynamics (CFD) solver is the basis of the current test case. The compressible NS equations were utilised to simulate the two-dimensional laminar flow past bluff budies at low Reynolds numbers
 $(Re\lt 200)$
. The optimisation objective is the maximum resolvent gain based on the compressible NS equations. The Mach number was set to be
 $Ma=0.1$
. The governing equations are solved by an in-house CFD solver based on the finite-volume discretisation. Radial basis function interpolation is utilised to achieve mesh deformation that accounts for the geometry change. The base flow and its numerical Jacobian matrix also needs to be recalculated after updating the geometry. More details about the simulation can be seen in Zhang et al. (Reference Zhang, Li, Ye and Jiang2015). Based on this solver, we verify the correctness of the Jacobian matrix in Appendix A. Results of resolvent analysis have also been verified in previous works (Yuan et al. Reference Yuan, Kou, Gao and Zhang2023).
Optimisation results with different penalty parameters
 $\lambda$
. (a) The maximum resolvent gain
 $\sigma _{max}$
and its related constrained function
 $\Gamma$
. (b) The critical Reynolds number
 $Re_{cr}$
.

The optimised shapes with different penalty parameters
 $\lambda$
: (a)
 $\lambda \lt 22\,000$
, (b)
 $\lambda \gt 22\,000$
.

The effect of the penalty parameter on the optimised results is firstly examined to well balance the geometric constraint and the flow stability. Figure 6 shows the maximum resolvent gain
 $\sigma _{max}$
, the constrained function
 $\Gamma$
and the critical Reynolds number
 $Re_{cr}$
of the optimised shape with different penalty parameters
 $\lambda$
, where
 $\Gamma =\max \{ S(\boldsymbol{D}_0)-S(\boldsymbol{D}_k),0 \}$
. The critical Reynolds numbers of all optimised shapes increase and the maximum gain decreases compared with the initial shape, indicating that the flow becomes more stable. As shown in figure 7, all optimised shapes with different penalty parameters all indicate that upstream and downstream parts are thicker than the corresponding parts of the circular cylinder, while the middle part is thinner. When
 $\lambda \lt 22\,000$
, the critical Reynolds numbers of the optimised shapes increase while the overall area reduces with the decrease of penalty parameter in figure 6. On the contrary, figure 6(a) shows that it has effectively constrained the area of the optimised shape with
 $\lambda =22\,000$
. The critical Reynolds numbers of the optimised shapes will decrease with
 $\lambda \gt 22\,000$
as shown in figure 6(b). The optimisation result has tended to be stable. The benefit brought by further subdividing the interval of penalty parameter does not match the high computational cost. Therefore, the optimised shape obtained with
 $\lambda =22\,000$
is examined in detail. It is worth noting that with increasing penalty parameter
 $\lambda$
, the constraint function
 $\Gamma$
is not necessarily zero. There may be two main reasons. On the one hand, an excessively large penalty parameter may have caused the optimisation algorithm to become trapped in a local optimum. On the other hand, the gradient-based penalty function optimisation method may be numerically unstable (Nguyen & Strodiot Reference Nguyen and Strodiot1979; Lootsma Reference Lootsma1970).
The convergent history of the maximum gain and constrained function during optimisation with
 $\lambda =22\,000$
.

Figure 8 shows the convergent history of the maximum gain and constrained function. The convergence is achieved after seven iterations. The optimised CST parameters are displayed in table 3. In figure 9 we summarise the effect of the shape optimisation based on resolvent analysis, including gain reduction, improved stability and drag reduction. Firstly, figure 10(a) shows the detailed comparison of frequency-gain curves of the system before and after optimisation. The first-order resolvent gain decreases significantly after shape optimisation at low frequencies, and the high-frequency gain increases slightly. The second-order gain is almost unchanged. The maximum resolvent gain is reduced from 7662.65 to 2469.58 about
 $68\, \%$
.
Optimised CST parameters compared with the original parameters.

The effect of shape optimisation compared with the initial shape.

The comparison of (a) frequency-gain curves of the system at
 $Re=40$
, and (b) oscillation range of the lift coefficient at higher Reynolds numbers before and after optimisation with
 $\lambda =22\,000$
.

Secondly, the flow stability has also been improved at supercritical Reynolds numbers, though the resolvent-based optimisation is performed at the subcritical state
 $Re = 40$
, as shown in figure 5 and 9(b). The critical Reynolds number of the optimised shape increases from 47 to 60, indicating that the vortex shedding is completely eliminated below
 $Re=60$
, as shown in figure 6(b) and 9(b). We continue to investigate the vortex shedding phenomenon at higher Reynolds numbers between the initial and optimised shapes. We also present the amplitudes of lift coefficient oscillation at several typical Reynolds numbers shown in figure 10(b). The detailed lift-time curves are shown in figure 11(a). The amplitudes are reduced by nearly
 $67.6\, \%$
on average through shape optimisation.
The (a) lift and (b) drag coefficients of the initial ( ) and the optimised (
 ) shapes at different
 $Re$
.

Finally, although the objective function only contains the maximum gain, the drag reduction is also achieved through shape optimisation, as shown in figure 9(c). The detailed time history of the drag coefficient is shown in figure 11(b). The time-average drag is reduced by more than
 $18\, \%$
on average at various Reynolds numbers. The oscillation of the drag coefficient also decreases.
3.2. Modal analysis
In the previous section it was observed that the flow stability increased. To offer more details, we use the DMD to perform linear stability analysis of the flow. The results are also compared with resolvent analysis to validate the validity of the rank-1 approximation. Dynamic mode decomposition is a data-driven method that can extract dynamic information from flow snapshots generated by either numerical simulations or physical experiment (Rowley et al. Reference Rowley, Mezic, Bagheri, Schlatter and Henningson2009; Schmid Reference Schmid2010). Each DMD mode relates to a single frequency and growth rate, which can be interpreted as a generalisation of global stability modes (Taira et al. Reference Taira, Brunton, Dawson, Rowley, Colonius, McKeon, Schmidt, Gordeyev, Theofilis and Ukeiley2017). It is noted that Aaron, Schmidt & Tim (Reference Aaron, Schmidt and Tim2017) demonstrated the correlation between DMD and spectral proper orthogonal decomposition (SPOD), SPOD and resolvent analysis through theoretical derivation. At supercritical Reynolds numbers, we directly obtain the snapshots in the linear growth regime of the unsteady flow. For stable flow, a small-amplitude impulse in the transverse direction of the cylinder is imposed, and snapshots describing the flow decaying are collected for the DMD analysis. For more details, we refer the reader to Kou et al. (Reference Kou, Zhang, Liu and Li2017).
Comparison of the (a) least stable growth rates and (b) corresponding frequencies of the initial and optimised shapes, containing the dominant DMD modes of pressure at different
 $Re$
.

We perform DMD on the flow past the initial and optimised shapes at several typical Reynolds numbers. Results are summarised in figure 12, where the pressure modes are given. The dominant DMD modes of the initial and optimised shapes all are von Kármán modes, inducing the periodic vortex shedding in both flows at supercritical
 $Re$
. The least stable growth rate of the optimised shape becomes positive at about
 $Re=60$
(figure 12
a), characterizing the flow instability. This is much higher than the initial
 $Re_{cr}=47$
. As the Reynolds number increases, the least stable growth rate of the optimised shape is always smaller than that of the initial shape at all
 $Re$
(figure 12
a), indicating improved stability and reduced vortex shedding for the optimised shape. The least stable frequencies of the optimised shape are larger than that of the initial shape at all
 $Re$
(figure 12
b). Compared with the circular cylinder, a decrease in the least stable growth rate of the optimised shape generally leads to an increase in the corresponding frequency, which aligns closely with the optimisation results based on stability analysis obtained by Martinez-Cava et al. (Reference Martinez-Cava, Chávez-Modena, Valero, de Vicente and Ferrer2020).
In addition, to further validate the rank-1 approximation at the design state
 $Re=40$
, we perform resolvent analysis on the flow past different shapes and compare the results with DMD. For both the initial and optimised shapes, the least stable characteristic frequency and the most sensitive frequency are almost the same, as shown in table 4. The corresponding DMD modes, the forcing and response modes of pressure at the least stable frequencies are calculated in figure 13. The dominant DMD modes and response modes all characterise the vortex shedding modes. According to § 2.2, the consistency of the frequencies and modes obtained by resolvent analysis and DMD indicates that both the flow past the initial and optimised shapes satisfy the rank-1 approximation.
The comparison of different frequencies at
 $Re=40$
.

Dominant DMD and resolvent modes of pressure of the initial and optimised shapes corresponding to their least stable frequencies at
 $Re=40$
.

3.3. Mechanisms of drag reduction and stability enhancement
This section explains the physical mechanism of stability enhancement and drag reduction coming from the proposed optimisation. As shown in figure 14, the flow behaviour is investigated in detail. Owing to the combined effect of the flattened surface and the Coanda effect, the flow has been more stable and the drag coefficient has been reduced.
The mechanism of drag reduction and stability enhancement.

On the one hand, as shown in figure 14(a), the thickness distribution and wall curvature of the bluff body are changed through shape optimisation. The flattened surface of the geometry can help to improve the flow stability and reduce the drag. In similar works, the optimised shapes all have thickness reduction and flattened surfaces compared with the circular cylinder (Heuveline & Strauß Reference Heuveline and Strauß2009; Chen et al. Reference Chen, Li and Zhang2019), which aligns with our study. As the cylinder geometry flattens, the local dynamics of the separation bubble undergo significant change (Chiarini, Quadrio & Auteri Reference Chiarini, Quadrio and Auteri2021). Reduced flow separation intensity directly correlates with diminished drag. Therefore, this is also one of the important reasons for the stability improvement and drag reduction after shape optimisation.
On the other hand, the Coanda effect is also important. The final optimised shape becomes flattened with varying degrees of bulging at the front, middle and trailing edges. Compared with the initial shape, the separation point of the optimised shape is actually located after the trailing edge corner at
 $Re=40$
(figure 14
c). This indicates that the flow remains attached even after passing the blunt corner, where the flow direction is significantly deflected as the flow moves over protrusions at various locations. This behaviour delays flow separation and is a typical characteristic of the Coanda effect (Wille & Fernholz Reference Wille and Fernholz1965), whose influence cannot be overlooked.
3.3.1. Connections between drag and resolvent gain
To show that the results we obtained are not by chance, the connection between drag and resolvent gain is explored further. Since the mathematical/theoretical connection between the maximum resolvent gain and drag can be difficult to establish, we compare these two factors across different geometries and Reynolds numbers (figure 15). It is worth noting that we performed finite-time horizon resolvent analysis of an unstable system at
 $Re \gt 47$
(Yeh & Taira Reference Yeh and Taira2019), and the drag for supercritical Reynolds numbers is obtained based on the unstable steady base flow. From figure 15 it can be clearly seen that the maximum resolvent gain varies proportionally with drag across various geometric configurations. The proportional relationship remains valid for both subcritical and supercritical Reynolds numbers. Furthermore, for a fixed Reynolds number, as the optimisation evolves, the intensity of flow separation is reduced, leading to improved flow instability and drag reduction.
The maximum resolvent gain and drag for different geometries during optimisation at (a) subcritical and (b) supercritical Reynolds numbers.

As reported by Chavarin & Luhar (Reference Chavarin and Luhar2022), as the riblet size for channel flows varies, the total drag reduction and the attenuation of resolvent gain for the near-wall mode exhibited consistent trends. Therefore, the attenuation of resolvent gain for the near-wall mode can be chosen as the objective function, thereby the optimised shapes are expected to exhibit reduced drag. Furthermore, it is also important to mention that Chen et al. (Reference Chen, Li and Zhang2019) obtained similar geometry by minimizing the oscillation area of the lift in a cycle of the limit cycle oscillation (LCO) state at
 $Re=100$
. After shape optimisation, the drag is also reduced. Detailed information is given in Appendix B. This demonstrates that flow stabilisation correlates with the reduction of both lift oscillation and time-averaged drag.
In summary, while maximum resolvent gain seems like an indirect optimisation objective, it is indeed strongly connected (and proportional) to the drag and growth rate of the stability. However, future works are still needed to obtain the mathematical expression between the maximum resolvent gain and drag.
3.3.2. Shape changes during the optimisation process
Changes in (a) resolvent gain and constraint function, (b) separation point location, (c) shape and (d) pressure coefficient during the optimisation process.

To explore whether the improved flow stability and the drag reduction of the optimised shape are due to the combined effect of the flattened surface and the Coanda effect, we further investigate the change of optimised shape during the optimisation process. According to the simulation results in the paper, the optimised shape is obtained after five optimisation iterations at
 $\lambda =22\,000$
. The optimal shape at each iteration, as well as the changes in the separation point, maximum gain and the steady solution of the pressure coefficient at
 $Re = 40$
, are shown in figure 16. Initially, the entire shape becomes flattened and there are no bulging parts at the trailing edge. The separation point is delayed and the resolvent gain is reduced. Moreover, there is no low-pressure region at the trailing edge in the pressure distribution, and the Coanda effect has little influence. This shows that a flattened geometric surface can improve flow stability. However, the area of this geometry is reduced significantly, which can be further optimised. During the subsequent steps, different sections of the shape begin to bulge outward, expanding the surface area. This results in enhanced performance gains, upstream migration of the separation point and a reduction in flow stability. Simultaneously, a localised low-pressure zone forms in the bulged region, which promotes sustained flow attachment (Panitz & Wasan Reference Panitz and Wasan1972). Finally, the geometry transitions into a rounded-square configuration, with contoured surfaces concentrated near the leading and trailing edges. During this optimisation process, redistribution enhances the Coanda effect while mitigating the destabilizing influence of surface-area expansion on flow stability.
In contrast to circular or square cylinders, the optimised geometry evolves into a flattened profile with strategically distributed bulging along the front, mid-section and trailing edge. While the flattened profile delays flow separation, it does so at the expense of reduced surface area. However, localised bulging creates favourable conditions for the Coanda effect, which simultaneously delays flow separation and partially offsets surface-area losses. The optimised design thus achieves an optimal balance, enabling synergistic interaction between these mechanisms to maximise flow stability enhancements while maintaining a constant surface area.
3.3.3. The change of attached vortex affects drag coefficient components
Furthermore, we study the influence on the structure of the attached vortex by giving the pressure coefficients on the surface of the initial and optimised shapes (figure 17 b). The pressure coefficients have three peaks in the front, middle and back positions, which are also highlighted in figure 17(a). The first peak is the minimum, indicting that the pressure starts to rise earlier than the circular cylinder. The position of the middle peak is consistent with the maximum thickness position of the optimised shape. This peak is the least obvious while playing a key role in undertaking the flow from the leading edge and helping it remain attached until the trailing edge. The peak on the trailing edge is due to the fact that the optimised shape is slightly bulging. Three distinct pressure peaks lead to three regions of negative pressure gradients, which help the flow become attached until it bypasses the trailing edge of the optimised shape. Therefore, the size of the separation bubble is much smaller than that of the initial shape, making the attached vortex of the optimised shape more stable than that of the initial shape (figure 18).
Comparison of (a) the surface and (b) the steady solution of pressure coefficient (
 $C_p$
) at
 $Re=40$
of the initial and optimised shape. The black point represents the peak of
 $C_p$
and its specific location on the surface of the optimised shape.

The steady solution of vorticity of (a) the initial and (b) the optimised shapes at
 $Re=40$
. The red dot indicates the flow separation point.

The change of vortex structure and pressure distribution will inevitably affect the drag, which is composed of pressure and viscous components. The decomposed drag coefficient of the initial and optimised shapes are given in table 5, where both the pressure and viscous drag have been reduced after optimisation. Compared with the initial shape, the optimised shape experiences delayed flow separation, and the separation bubble decreases, resulting in a decrease in drag coefficient. Since the optimised geometry can be approximately regarded as a rectangular, the pressure drag mainly comes from the leading and trailing edges (figure 19 a). This steeper leading edge leads to significantly larger viscous drag than that of the initial shape. Thereafter, the viscous drag decreases rapidly because the flow remains attached to the surface (figure 19 b).
The steady solution of different drag coefficients components of the initial and the optimised shapes at
 $Re=40$
.

The steady solution of the (a) pressure
 $C_{dp}$
and (b) viscous
 $C_{df}$
components of drag of the initial and optimised shapes at
 $Re=40$
.

The (a) lift and (b) drag coefficients of the initial and optimised shapes at
 $Re=100$
. The instantaneous flow field of the transverse velocity at the corresponding moment is also given.

The (a) pressure and (b) viscous components of the drag coefficients of the initial and optimised shapes at
 $Re=100$
.

3.3.4. Drag reduction at supercritical
 $Re$

As the Reynolds number increases, both the flow past the initial and optimised shapes becomes unstable. We first compare the lift and drag curves of two shapes at
 $Re=100$
. The flow field of the instantaneous transverse velocity is also given in figure 20, where the instantaneous flow field is marked in the lift curve. The vortex shedding of the optimised shape is suppressed, resulting in the reduced amplitude of lift and drag. In addition, the time-averaged drag of the optimised shape is also smaller than that of the initial shape. Considering the pressure and viscous components of the drag, we find that both of them have greatly reduced (figure 21), where the reduction of viscous drag is less than that of pressure drag.
The comparison of the time-averaged separation points of the initial and optimised shapes at different
 $Re$
.

The time-averaged (a) pressure and (b) viscous components of the drag coefficients of the initial and optimised shapes at different
 $Re$
.

We continue to analyse the physical mechanism at supercritical
 $Re$
. The separation points of the time-averaged flows at different
 $Re$
are given in figure 22. As the Reynolds number increases, the separation point of the optimised shape remains nearly unchanged. Therefore, the strength of flow separation does not change much with increasing Reynolds number, making the pressure drag almost unchanged (figure 23
a). In contrast, as the Reynolds number increases, the separation point of the circular cylinder shifts toward the leading edge, resulting in a continuous intensification of vortex shedding. Therefore, the flow becomes unstable at earlier
 $Re$
compared with the optimised shape and the pressure drag also increases with the increase of
 $Re$
. The viscous drag of both shapes decreases with the increase of Reynolds number. Owing to the delayed flow separation of the optimised shape, the viscous drag at the same Reynolds number is always smaller than that of the initial shape (figure 23
b). From both figures, it can be observed that the reduction of total drag becomes more apparent as the Reynolds number increases.
In general, the proposed optimisation strategy makes the shape automatically evolve in the direction of delaying separation. Owing to the synergistic effect of the flattened surface and the Coanda effect, the flow separation of the optimised shape is delayed, leading to the enhanced stability and drag reduction.
3.4. Validation of drag reduction at Re = 3900
As the first step to show the proposed optimisation framework is applicable to more complex flows, the optimised geometry has been studied in the turbulent flow states. We performed large eddy simulations (LES) on the optimised geometry and the circular cylinder at
 $Re=3900$
, respectively. The calculation was performed using the finite-volume solver PHengLEI (Zhao, He & He Reference Zhao, He and He2020) with a structured grid of 2.73 million cells. The number of grids in the spanwise direction was
 $N_z=49$
and the spanwise width is
 $\pi D$
, where
 $D$
is the cylinder diameter. The Sigma model is adopted for subgrid-scale modelling, while the height of the first layer of grids was set to
 $10^{-3}$
. An implicit dual time-stepping scheme was used to integrate the equations in the time domain, and a lower--upper factorisation and a symmetric Gauss--Seidel relaxation scheme was applied in the pseudo time step.
Comparison of LES and experimental results for the flow past the circular cylinder: (a) section at
 $y=0$
, (b) sections at different
 $x$
positions.

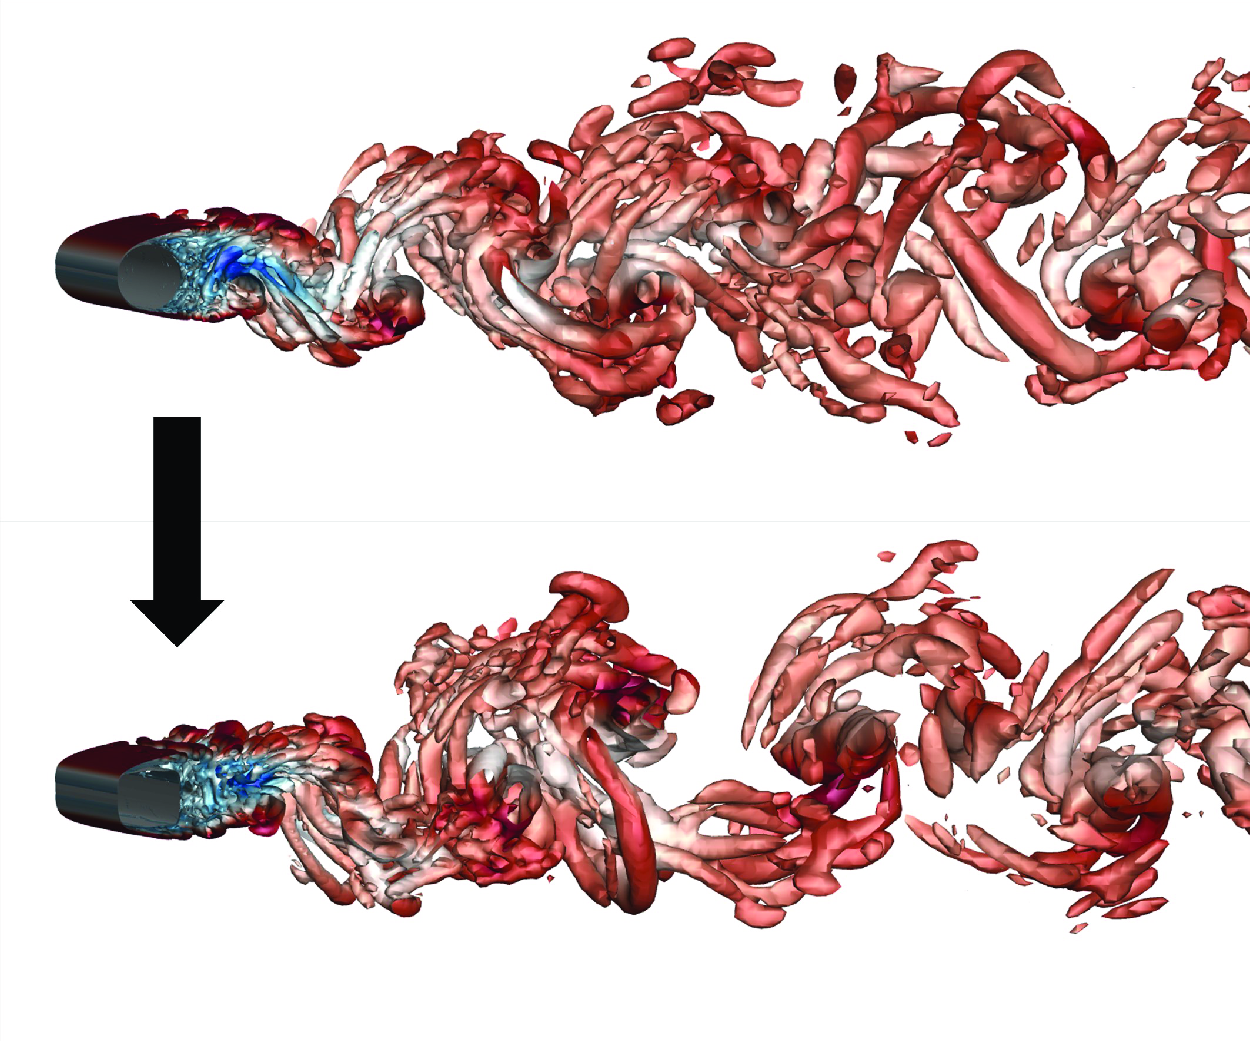
First, we compared the velocity profiles of the time-averaged flows obtained from the experiment (Parnaudeau et al. Reference Parnaudeau, Carlier, Heitz and Lamballais2008) and the simulation (figure 24). It can be seen that the two agree well for different sections, which verifies the reliability of the simulation results. Next, we present the transient flow fields of the flow past the circular cylinder and the optimised geometry (figure 25
a). The LES results successfully captured the evolution of the vortex structure, and the time history of the lift and drag coefficients obtained is shown in figures 25(b) and 25(c). It can be seen that there is no obvious difference in the lift amplitude, while the overall drag after optimisation is reduced compared with that of the circular cylinder. We calculated the dominant vortex shedding frequency and the time-averaged drag of different geometries. The LES results of the circular cylinder are in good agreement with the experimental results (Parnaudeau et al. Reference Parnaudeau, Carlier, Heitz and Lamballais2008). The drag of the optimised geometry is reduced by
 $8\, \%$
compared with the circular cylinder.
The comparison of LES and experimental results for different geometries at
 $Re=3900$
.

Comparison of (a) the transient flow field and the time history of the (b) lift and (c) drag before and after optimisation at
 $Re=3900$
.

Comparison of the pressure coefficient of the time-averaged flow field at
 $Re=3900$
.

To investigate the reasons behind the drag reduction achieved by the optimised geometry, we compared the pressure coefficient distribution of the time-averaged flow field (figure 26). As shown in the figure, the trailing edge of the optimised geometry pressure recovers faster, reducing the range of the low-pressure area in the wake region. This leads to a significant reduction in pressure drag, thereby reducing the total drag. Therefore, although the optimisation is performed at subcritical and laminar flows, the optimised geometry still achieves drag reduction in turbulent flows at a relatively high Reynolds number. The potential of the proposed resolvent-based optimisation approach at higher Reynolds numbers and in more complicated flows is worth exploring further in the future.
4. Conclusion
In this paper we propose a new shape optimisation strategy based on resolvent analysis to suppress the vortex shedding of the flow around the cylinder, thereby improving flow stability and reducing drag. We first show when the flow satisfies the rank-1 approximation, for example, the flow past a cylinder, the frequency corresponding to the maximum resolvent gain closely matches the least stable frequency in stability analysis. Therefore, as shown in (2.18), both the least stable growth rate and maximum resolvent gain can characterise the flow stability. Meanwhile, the calculation of the maximum gain does not require additional spectral transformations, which can be more accurate and effective compared with the stability-based shape optimisation. Therefore, we established the optimisation framework based on resolvent analysis. The efficacy of the proposed resolvent-based optimisation is validated through improving the stability of the one-dimensional GL equation.
Thereafter, the proposed resolvent-based optimisation is applied to suppress the vortex shedding of a circular cylinder. We parameterise the initial shape by the CST method, and use the penalty function to deal with the geometric constraints. To properly represent flow stability and maintain the computational efficiency, the subcritical state
 $Re=40$
is taken as the design state. The nonlinear conjugate gradient algorithm is used to solve the optimisation problem. The optimised shape with penalty parameter
 $\lambda =22\,000$
balances well the geometric constraint and the flow stability, serving as the reference for detailed analysis. The maximum resolvent gain of the optimised flow system is 2469.58, which is
 $68\, \%$
lower than that of the initial shape. i.e, the circular cylinder. It should be highlighted that although the resolvent-based optimisation is performed at subcritical Reynolds number, the flow stability is improved at supercritical Reynolds numbers. The critical Reynolds number of the optimised shape is extended from 47 to 60. The oscillation amplitude of the lift coefficient at a supercritical Reynolds number is also reduced by
 $67.6\, \%$
on average. The time-average drag is reduced by more than
 $18\, \%$
on average, even though both forces are not contained in the objective function.
Meanwhile, we perform DMD on the flow past the initial and optimised cylinders. The dominant DMD modes at different typical
 $Re$
are von Kármán flow modes that induce the periodic vortex shedding. The least stable growth rate of the optimised shape is always smaller than that of the initial shape at the same Reynolds number, which accounts for the extension of the critical Reynolds number. Furthermore, resolvent analysis at
 $Re = 40$
is performed. The most sensitive frequency and the least stable frequency are almost the same for the optimised shape. In addition, the response modes and dominant DMD modes corresponding to the least stable frequency all characterise the vortex shedding modes. This indicates that the flow past the optimised shape satisfies the rank-1 approximation according to § 2.2.
Finally, we explain the physical mechanism of stability enhancement and drag reduction of the flow past bluff bodies. Our findings confirm that the maximum resolvent gain, which is used as a surrogate metric for flow stability in optimisation frameworks, exhibits direct proportionality to total drag. The thickness distribution and wall curvature of the optimised shape allow the flow to remain attached until it bypasses the trailing edge for a certain distance due to the synergistic effect of the flattened surface and the Coanda effect. Therefore, the flow separation is delayed, resulting in stability enhancement and drag reduction. As the Reynolds number increases, for the optimised shape, the intensity of flow separation remains constant due to the nearly fixed separation point. Therefore, the viscous drag decreases while the pressure drag remains almost unchanged as the Reynolds number increases. In contrast, the separation point of the circular cylinder shifts toward the leading edge with the increase of
 $Re$
, resulting in a continuous intensification of vortex shedding and the increase of pressure drag. This makes flow encounters instability at earlier
 $Re$
compared with the optimised shape. The reduction of total drag becomes more apparent as the Reynolds number increases. Furthermore, in high-Reynolds-number turbulent flows the trailing edge pressure of the optimised shape recovers faster and is significantly larger than that of the cylinder. This results in substantial pressure drag reduction, thereby achieving overall drag attenuation.
This proposed resolvent-based optimisation is a general framework for different types of flow. From the current work, the proposed approach works well for the oscillator-type flow. However, we believe that the proposed approach can be more useful for noise-amplifier-type flows where multiple dominant eigenmodes exist as mentioned in § 2.2. Therefore, it is one of the focuses of future work to perform shape optimisation to enhance flow stability in noise amplifiers (Sipp et al. Reference Sipp, Marquet, Meliga and Barbagallo2010). Furthermore, as discussed in § 3.4, the proposed approach achieves drag reduction even at higher Reynolds numbers where the turbulent flows are present. Moreover, our recent work shows that resolvent analysis is also applicable to predict the flutter boundary of airfoils in transonic flows (Yuan et al. Reference Yuan, Kou, Gao and Zhang2024), where multiple dynamic modes exist and interact. We believe that the combination of these works will enable the proposed resolvent-based optimisation framework to handle more complicated geometries and flow.
Funding
This research is supported by the National Natural Science Foundation of China (Nos. 92152301 and 12072282), Young Talented Project of Shaanxi Province (No. 5113240037) and the Fundamental Research Funds for the Central Universities (G2024KY05101).
Declaration of interests
The authors report no conflict of interest.
Appendix A
The numerical simulation and Jacobian matrix used in this paper are based on the compressible NS equations and include the continuity equation, momentum equation and energy equation. The flow variables
 $q$
include fluid density, velocity and pressure. Therefore, there are differences compared with the results of the standard resolvent framework proposed by McKeon & Sharma (Reference McKeon and Sharma2010). To verify the correctness of the Jacobian matrix, we performed eigenvalue decomposition, i.e. stability analysis. The obtained maximum growth rate and corresponding frequency are shown in figure 27. The results are in good agreement with the results from incompressible flow solvers (Canuto & Taira Reference Canuto and Taira2015). Furthermore, if DMD is applied to the linear growth phase based on the unstable steady flow of the pressure snapshot, the extracted DMD modes also correspond to the global stability modes (Taira et al. Reference Taira, Brunton, Dawson, Rowley, Colonius, McKeon, Schmidt, Gordeyev, Theofilis and Ukeiley2017). Therefore, we collected our results against the growth rates and characteristic frequencies reported by Kou et al. (Reference Kou, Zhang, Liu and Li2017) (figure 27). The DMD-derived spectral characteristics demonstrate a strong correlation with the outcomes of stability analysis, even though there is a slight difference on the growth rate at
 $Re = 60$
. Therefore, we believe that the Jacobian matrix based on the compressible flow equations is correct.
Comparison of results. (a) The growth rate. (b) Frequency.

Appendix B
To rigorously assess the aerodynamic performance of the optimised geometry and validate its superiority over alternative configurations achievable within the same parametric framework, we conducted a comparative analysis with existing studies. Chen et al. (Reference Chen, Li and Zhang2019) obtained a similar geometry by minimizing the oscillation area of the lift in a cycle of the LCO state at
 $Re=100$
. The design variables were also CST parameters, and the unsteady discrete adjoint method was used to calculate the gradient of the objective function with respect to the design variables. The optimised shape achieved a significant stability improvement as well. The critical Reynolds number reached 59–60, similar to the optimisation results presented in this study.
Cmparison of (a) lift amplitude and (b) time-averaged drag of different optimised shapes at different
 $Re$
.

Figure 28 compares the lift oscillation amplitude and time-averaged drag between the optimised shape from this study and that optimised by Chen et al. (Reference Chen, Li and Zhang2019) across various Reynolds numbers. Our results demonstrate that the optimised design presented in this study exhibits reduced lift oscillation and lower time-averaged drag across all tested Reynolds numbers, suggesting superior flow stability and drag reduction performance compared with previous studies. Furthermore, the resolvent-based optimisation framework also improves computational efficiency as it requires only steady base flow calculations, rather than the LCO state needed in Chen et al. (Reference Chen, Li and Zhang2019).