Introduction
Crop productivity has increased over the past 50–60 years as a result of the green revolution (Pingali, Reference Pingali2012). With the development and use of high-yielding crop varieties, demand for fertilizers has also been increased (Ladha et al., Reference Ladha, Pathak, Krupnik, Six and van Kessel2005). Therefore, farmers apply high doses of both organic and inorganic sources of nutrients aiming to reach higher crop productivities (Weerakkody and Mawalagedera, Reference Weerakkody, Mawalagedera, Marambe, Weerahewa and Dandeniya2020). However, continuous overdosing of fertilizers without following the recommendations has led to problems such as soil degradation, soil nutrient imbalances, nutrient toxicities to plants and pollution of water bodies (Khai et al., Reference Khai, Ha and Öborn2007; Bandara et al., Reference Bandara, Wijewardena and Seneviratne2010; Weerakkody and Mawalagedera, Reference Weerakkody, Mawalagedera, Marambe, Weerahewa and Dandeniya2020). As a result, the sustainability of those agricultural systems has been threatened.
Intensive vegetable cultivation systems exhibit a significant contribution to the present vegetable production in Sri Lanka. Small-scale (i.e. less than 0.5 ha) farmer fields in Nuwara Eliya (6.9497°N, 80.7891°E) and Welimada (6.9019°N, 80.9079°E) regions provide classic examples of commercial and intensive vegetable cultivation under open field conditions. High-value crops are grown, in rotation, three to four times per year without fallowing the land aiming to reach high income per unit of land and time (Sirisena and Suriyagoda, Reference Sirisena and Suriyagoda2018; Weerakkody and Mawalagedera, Reference Weerakkody, Mawalagedera, Marambe, Weerahewa and Dandeniya2020). Therefore, farmers mobilize all available and affordable inputs, including agrochemicals and manures, without considering the environment sustainability or profit margins (Sirisena and Suriyagoda, Reference Sirisena and Suriyagoda2018). Major vegetable crops cultivated in these regions include carrot (Daucus carota L.), cabbage (Brassica oleracea L.), beetroot (Beta vulgaris L.), bean (Phaseolus vulgaris L.), leeks (Allium porrum L.) and potato (Solanum tuberosum L.) (AgStat, 2020).
Even though vegetables act as a key source of mineral elements its contribution to human nutrition is largely neglected in Asia (Ali and Tsou, Reference Ali and Tsou1997; Weerakkody and Mawalagedera, Reference Weerakkody, Mawalagedera, Marambe, Weerahewa and Dandeniya2020). The quality of vegetable crops produced is influenced by the amount and type of mineral elements available in the soil and the amount taken up by the crop. However, the nutritional quality of vegetables is not valued by these farmers. Therefore, they frequently apply inorganic sources of nitrogen (N), phosphorus (P) and potassium (K) to soil, and micro-nutrients such as zinc (Zn), sulphur (S), manganese (Mn), molybdenum (Mo) and copper (Cu) through fertilizer mixers either to soil in the solid form or foliage in the liquid form. They also apply organic manures such as compost, cattle manure and poultry manure. As a result of this continuous practice, plant available P and K concentrations have reached sufficiency even for the succeeding crops (Wijewardena and Amarasiri, Reference Wijewardena and Amarasiri1997; Sirisena and Suriyagoda, Reference Sirisena and Suriyagoda2018). Moreover, the main watersheds in the country are situated around these vegetable cultivating regions, risking the pollution of a wide range of water sources (Diyabalanage et al., Reference Diyabalanage, Samarakoon, Adikari and Hewawasam2017; Sirisena and Suriyagoda, Reference Sirisena and Suriyagoda2018).
Daily intake/uptake of micro-nutrients is essential for the basic functioning of plants or animals (Abeywickrama et al., Reference Abeywickrama, Koyama, Uchiyama, Shimizu, Iwasa, Yamada, Ohashi and Mitobe2018). Deficiencies in micro-nutrients are known as ‘hidden hunger’ as those deficiencies cannot be clinically identified until the last stages (Abeywickrama et al., Reference Abeywickrama, Koyama, Uchiyama, Shimizu, Iwasa, Yamada, Ohashi and Mitobe2018). Recent reviews suggested the prevalence of iron (Fe), Zn and calcium (Ca) deficiencies among Sri Lankans (Akhtar et al., Reference Akhtar, Ismail, Atukorala and Arlappa2013; Abeywickrama et al., Reference Abeywickrama, Koyama, Uchiyama, Shimizu, Iwasa, Yamada, Ohashi and Mitobe2018). Even though both macro- and micro-nutrients are frequently been applied to these intensive agricultural systems, the availability of those mineral elements in soils and accumulation in major vegetable crops grown are largely unknown (Ali and Tsou, Reference Ali and Tsou1997; Weerakkody and Mawalagedera, Reference Weerakkody, Mawalagedera, Marambe, Weerahewa and Dandeniya2020). Moreover, according to the WHO/FAO recommendation, the per capita vegetable and fruit intake should be a minimum of 400 g or five servings per day to prevent the occurrence of chronic diseases (Kanungsukkasem et al., Reference Kanungsukkasem, Ng, Van Minh, Razzaque, Ashraf, Juvekar, Masud Ahmed and Huu Bich2009). However, in 2015 the per capita fruit and vegetable consumption in Sri Lanka was 240 g or three servings per day by an adult (Jayawardena et al., Reference Jayawardena, Jeyakumar, Gamage, Sooriyaarachchi and Hills2020). Therefore, it is important to study the contribution of major vegetables when supplying essential mineral elements to local communities.
It has been reported that mineral fertilizers such as phosphates, and organic manures are sometimes contaminated with toxic trace elements such as arsenic (As), cadmium (Cd) and lead (Pb) (Dissanayake and Chandrajith, Reference Dissanayake and Chandrajith2009; Jayasumana et al., Reference Jayasumana, Fonseka, Fernando, Jayalath, Amarasinghe, Siribaddana, Gunatilake and Paranagama2015; Mapa, Reference Mapa2020). Continuous and excessive application of these mineral sources may result in increasing the bioavailability of those toxic trace elements in soil and accumulate in the food chain causing chronic health problems to humans (Premarathna et al., Reference Premarathna, Hettiarachchi and Indraratne2005; Dissanayake and Chandrajith, Reference Dissanayake and Chandrajith2009; Suriyagoda et al., Reference Suriyagoda, Dittert and Lambers2018). However, the accumulation of toxic trace elements in intensively cultivated vegetable crops in this region has not been tested while more attention has been paid to rice-based cropping systems (Kananke et al., Reference Kananke, Wansapala and Gunaratne2014, Reference Kananke, Wansapala and Gunaratne2016; Jayasumana et al., Reference Jayasumana, Fonseka, Fernando, Jayalath, Amarasinghe, Siribaddana, Gunatilake and Paranagama2015). Therefore, it is essential to study the concentrations of plant available forms of essential mineral elements and toxic trace elements in the soil, accumulation in edible plant parts and the amount removed by the crops with the harvest. Therefore, the objectives of this study were to evaluate (i) the concentrations of essential mineral and toxic trace elements in both the crop and the soil, and (ii) the amount removed with the harvest of widely cultivated vegetable crops from Nuwara Eliya and Welimada regions of Sri Lanka.
Materials and methods
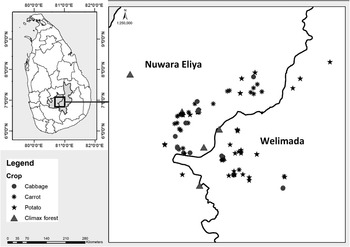
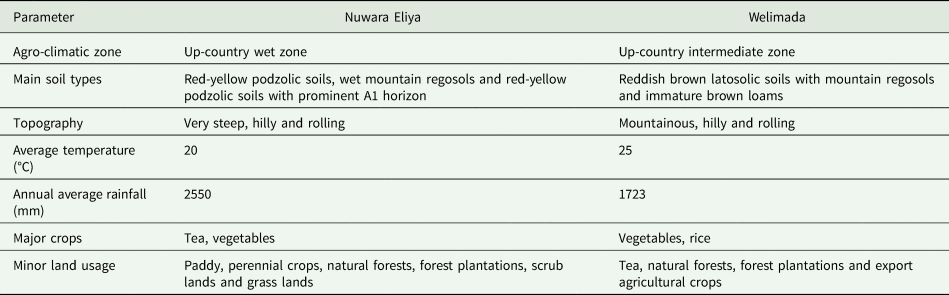
The vegetable crops and soil samples were collected from Nuwara Eliya and Welimada regions in Sri Lanka during the period from October to December 2019 (Fig. 1). Basic soil and climate characteristics of the two study regions are given in Table 1. Vegetable cultivation in these sloping lands has been a major land use for decades. Temperature is optimal for the cultivation for most of the vegetable crops and receives a year-round abundant rainfall. Farmers also practice supplementary irrigation as required from natural waterways.
Locations used for vegetable and soil sample collection from the two intensive vegetable cultivating regions of Sri Lanka. Note: Some sites or crops are overlapped (n = 112 for all three crops).

Soil and climate characteristics in the two vegetable cultivating regions

Sources: DOA (2003); Mapa (Reference Mapa2020).
Three widely grown vegetable crops in the region, i.e. cabbage, carrot and potato, were selected for the study (AgStat, 2020). Altogether 112 farmer fields were used for vegetable sample collection (Table 2 and Fig. 1). When collecting plant samples from each crop field four sampling points were selected considering the crop and topographical heterogeneities in the field. One square meter land area was selected for harvesting at each point. Harvested plants from those four points in a field were combined and mixed to make a composite sample. Both the above- and below-ground plant parts of carrot and potato were harvested while only the shoots of cabbage were harvested from the base. Harvesting was done by pulling both carrot and potato plants after the soil around the base of the plant was loosened using a fork without damaging the below-ground plant parts by a skilled labourer. Cabbage plants were cut from the base using a harvesting knife to obtain the shoot. Fresh weights of shoots and roots harvested from each sample were recorded. Samples were collected on the days when farmers harvested their crops to be sent to markets. Therefore, eight visits were made to Nuwara Eliya and Welimada regions to collect those samples.
Number of soil and plant (only from crop fields) samples collected during the study

Soil samples were collected at the time of plant sample collection, and also within the quadrat of plant samples collected. Therefore, four individual samples from the top 15 cm of each crop field were collected and combined to make a composite sample. Nine soil samples from nearby undisturbed forest patches, representing unfertilized native vegetation in the region, were also collected (Table 2).
Both soil and plant samples were transported to the Department of Crop Science, Faculty of Agriculture, University of Peradeniya for processing and laboratory analyses. Apart from the soil and vegetable samples, compost, cattle manure and poultry manure samples were also collected from farmer fields or retail traders in the region to measure nutrient concentration in those samples.
Soil samples were air-dried and sieved through 1 mm sieve before estimating mineral element and toxic trace element concentrations. Total N concentration was estimated using the Kjeldahl method (Anderson and Ingram, Reference Anderson and Ingram1993). Ammonium acetate-extractable K was extracted with a 1 m ammonium acetate (NH4OAc) solution buffered to pH 7 and tested in a flame atomic absorption spectrophotometer (GBC model 932AA, Hampshire, USA) (Van Ranst et al., Reference Van Ranst, Verloo, Demeyer and Pauwels1999). Available P concentration was measured using the Olsen method (Olsen et al., Reference Olsen, Cole, Watanabe and Dean1954). Soil solution concentrations of N, P and K were measured using the column displacement procedure (Adams et al., Reference Adams, Burmester, Hue and Long1980; Somaweera et al., Reference Somaweera, Suriyagoda, Sirisena and De Costa2017). Organic matter, pH (1 : 5 ratio of soil : water) and electrical conductivity (EC) of the soil samples were also measured (Anderson and Ingram, Reference Anderson and Ingram1993). Plant available concentrations of other mineral elements (i.e. Ca, Mg, Mo, Cu, Mn, Fe, Ni and Zn) and toxic trace elements (i.e. As, Pb and Cd) in soil samples were determined after extracting in 0.01 m CaCl2 solution. For this, approximately 4 g of air-dried, sieved and homogenized soil sample was weighed into a 60 ml centrifuge tube, filled with 40 ml of 0.01 m CaCl2, centrifuged at a 130 rpm in an end-to-end shaker for 2 h (Houba et al., Reference Houba, Temminghoff, Gaikhorst and van Vark2000). Thereafter, those tubes were centrifuged at 3600 rpm for 4 min and the supernatant was filtered through a cellulose acetate syringe filter with a pore size of 0.45 μm. The supernatant was diluted seven times using deionized water and element concentrations were determined using inductively coupled plasma mass spectrometry (ICP-MS) (Thermo iCapQ, Bremen, Germany). Regent blanks and in-house standard soil sample were used for analytical quality control.
To determine the dry weight (i.e. moisture content) and element concentrations (macro- and micro-nutrients and toxic trace elements) in plant samples, a representative subsample with a minimum of 500 g fresh weight from each sample was prepared. The fresh weight of the sample was obtained and oven-dried until a constant weight was attained (i.e. minimum of 4 days) at 70°C. For this root and shoot samples of carrot and potato, and shoot samples of cabbage were used. The difference between fresh and dry weight was considered as the moisture content and expressed as a percentage of fresh weight. Oven-dried samples were ground to make a powder using a steel ball mill and stored in the oven at 60°C. Care was taken to clean the equipment after processing of each sample. An approximately 100 mg subsample was taken and digested in nitric-perchloric mix acid and analysed using the vanado-molybdo-phosphate yellow colorimetric method for the determination of tissue P concentration. Tissue K concentration was determined as explained by Van Ranst et al. (Reference Van Ranst, Verloo, Demeyer and Pauwels1999) and N concentration using the Kjeldahl method (Anderson and Ingram, Reference Anderson and Ingram1993). For the determination of other elements in plant tissues (i.e. Cu, Zn, Mn, As, Cd and Pb), approximately 200 mg subsample was digested in 2 ml hydrogen peroxide/4 ml nitric acid (160°C for 40 min) using the Milestone microwave digestion system (EthosEASY, Sorisole (BG), Italy). All the chemicals used were of analytical grade. Plant tissue elemental concentrations were quantified using the ICP-MS method. Regent blanks, in-house standard sample (Bg450) and an international reference material, IRMM-804 (Institute for Reference Materials and Measurements (IRMM), Geel, Belgium) were used for analytical quality control. This allowed the comparison of data within and among digestion cycles. Concentrations of mineral and toxic trace elements, moisture content and fresh weights of cabbage shoots, potato tubers and carrot roots were used when estimating the removal of mineral and toxic trace elements with harvest. The amounts of toxic trace elements present in a daily ration of vegetables were compared with the maximum permissible levels identified for those elements (Table S1).
While collecting soil and plant samples, farmers were interviewed by filling a short-structured questionnaire to understand their current fertilizer application plan (e.g. types of crops grown in rotation and the sources of nutrients applied). A total of 94 farmers (i.e. 84% of total) responded to the questionnaire survey while the remaining farmers were not present during the time of sample collection.
Soil and plant nutrition data were analysed using SAS statistical software (SAS Institute, 1995) as a factorial analysis of variance to study the effects of regions (i.e. Nuwara Eliya and Welimada), crops (i.e. cabbage, carrot and potato) and their interactions. Strengths of the relationships between the soil and plant nutrient concentrations were determined using Pearson's correlation coefficient. All the interpretations were made at a significance level of α = 0.05.
Results
Types of fertilizers applied
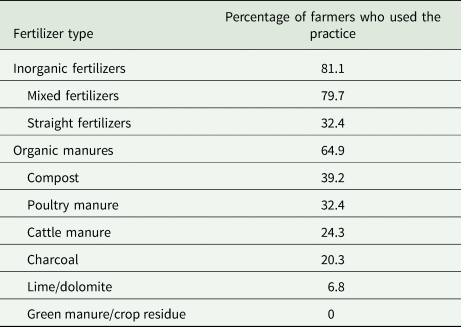
There was no significant association between the region (or the crop) and the types of fertilizers applied (P > 0.05). A majority of vegetable farmers used both inorganic and organic fertilizers (Table 3). Out of the farmers who used inorganic fertilizers, the majority preferred mixed fertilizers (i.e. multi-element mixtures of N, P, K, Mg and Zn in different ratios) than straight fertilizers (i.e. urea for N, triple super phosphate for P and muriate of potash for K) (Table S1). Farmers also used organic manures simultaneously with inorganic fertilizers. Application of compost and poultry manure was more common than applying either cattle manure or charcoal. The number of farmers who applied lime or dolomite was lower, and none of the farmers had applied green manure or crop residues.
Types of fertilizers applied by vegetable farmers in Nuwara Eliya and Welimada regions (n = 94)

Concentration of mineral elements in soil and manure
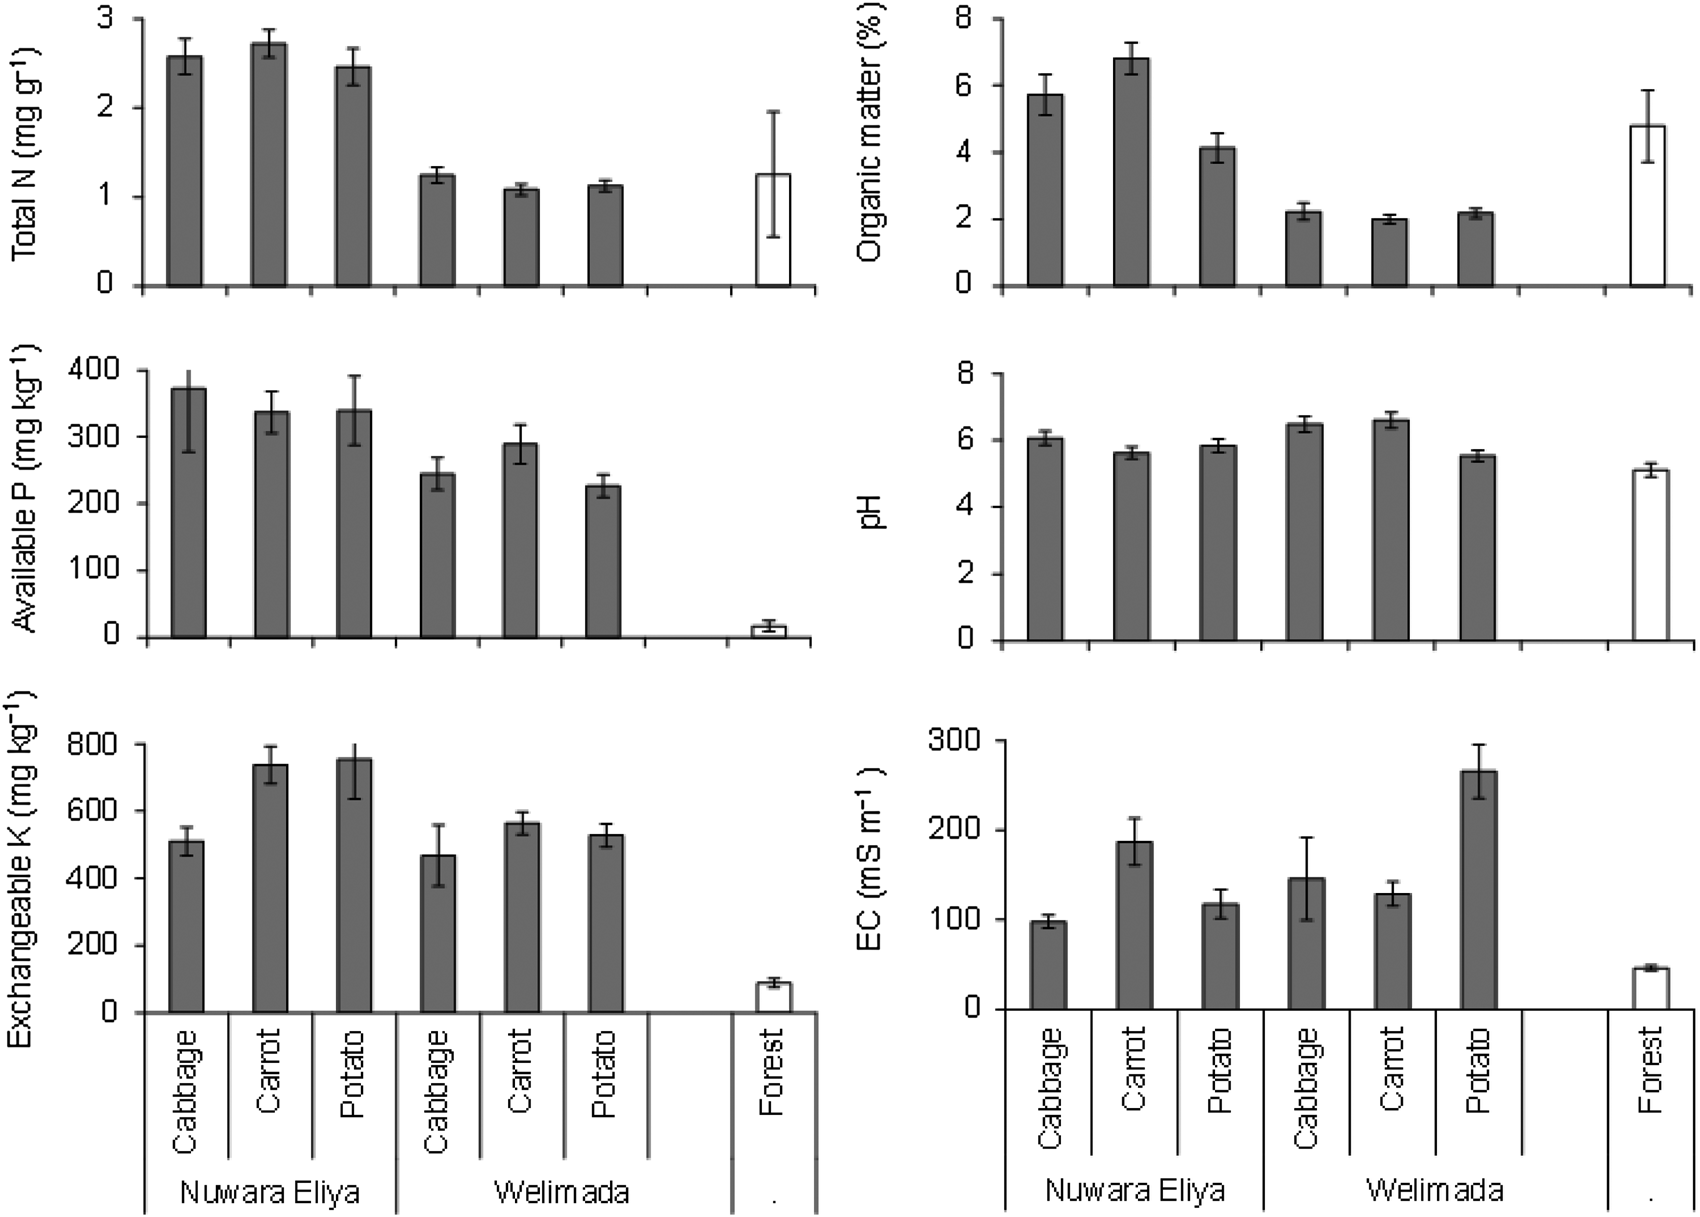
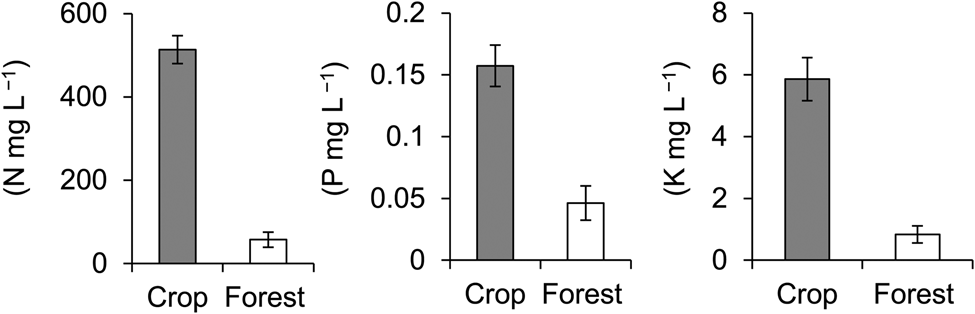
Irrespective of the crops grown, soils in Nuwara Eliya contained 2.2, 1.4 and 2.6 times higher concentrations of total N, available P and organic matter, respectively than that observed in the Welimada region (Fig. 2). Fields used to cultivate carrot and potato in Nuwara Eliya contained higher exchangeable K concentrations than those crop fields in Welimada. The highest EC value was observed in potato fields in Welimada. Concentrations of P and K reported in crop fields were higher than the levels required for optimal growth of crops. Plant available P, exchangeable K and EC values reported in crop fields were 18, 6.7 and 3.4 times higher, respectively while N, pH and organic matter levels were comparable to those observed in forest soils (Fig. 2). Soil solution concentrations of N, P and K were higher than those reported in forest soils (Fig. 3).
Concentrations of total nitrogen (N), available phosphorus (P), exchangeable potassium (K), organic matter, pH and electrical conductivity in the crop and forest fields in the two study regions (mean ± s.e., sample size is as stated in Table 2).

Concentrations of soil solution nitrogen (N), phosphorus (P) and potassium (K) in the crop and forest fields (mean ± s.e., sample size is as stated in Table 2).

The concentrations of CaCl2 extracted mineral elements in soil between the two cultivating regions and crop fields were similar except for the higher Mg and lower Mn concentrations in the Welimada region than those observed in Nuwara Eliya (Table 4). Moreover, a higher Cu concentration was reported in potato fields in Nuwara Eliya and carrot fields in Welimada than other crop fields in those regions.
Nutrient concentrations in the soils of two cultivating regions when extracted using 0.01 m CaCl2, mean ± s.e.

Sample size is as stated in Table 2.
Note: Different letters within a column indicate statistically significant differences at α = 0.05.
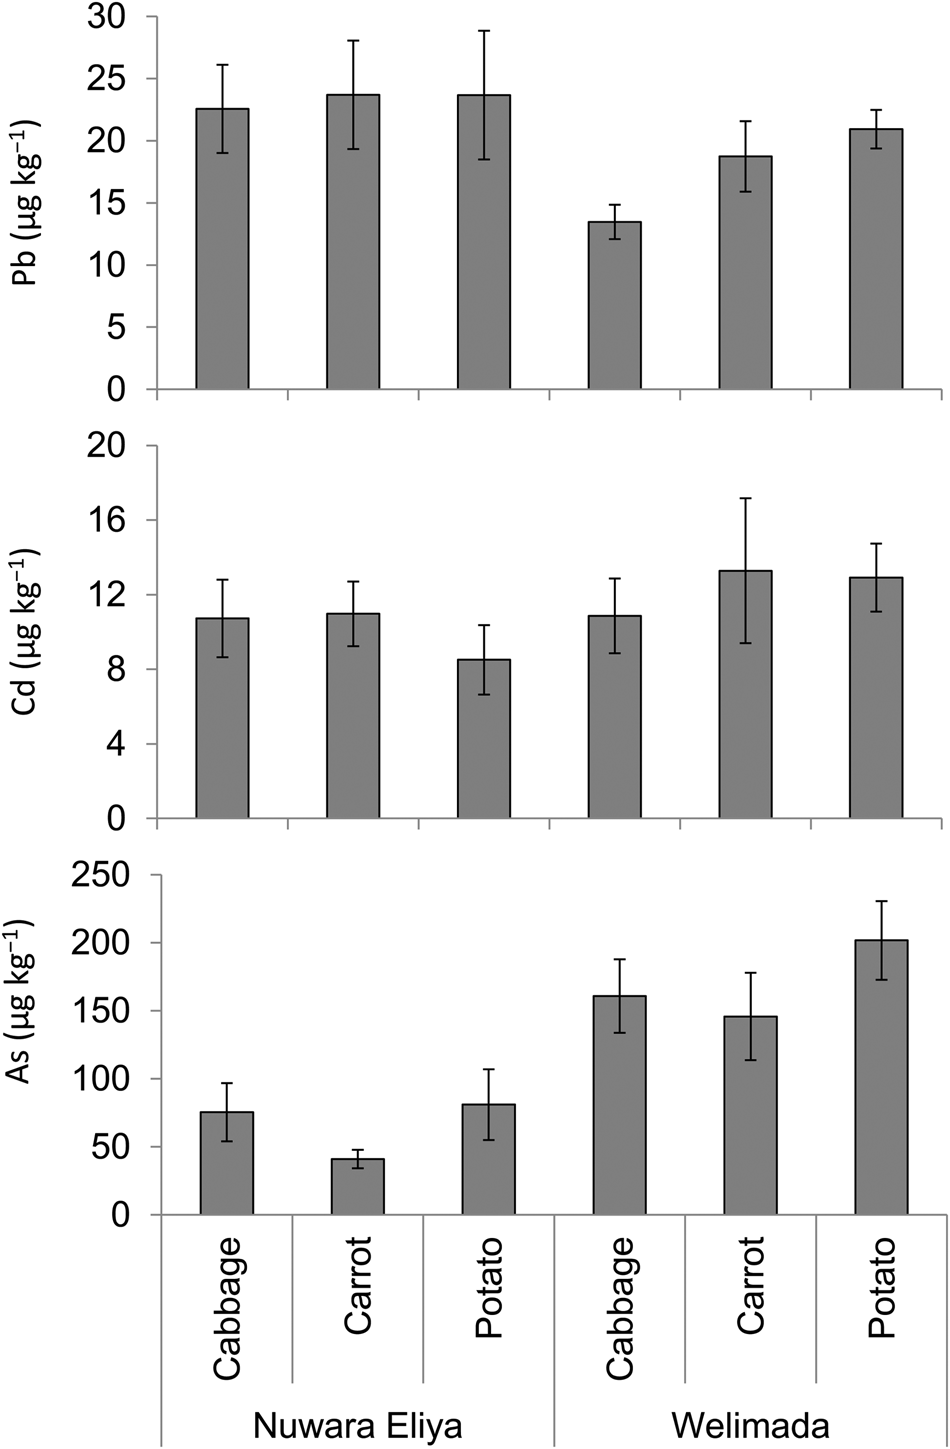
Soils in both regions and crop fields contained CaCl2 extracted As, Cd and Pb (Fig. 4). Concentrations of Pb and Cd between the two regions and crop fields were similar, except for the lower concentration of Pb reported in the cabbage fields in Welimada than other crop fields. Moreover, a relatively lower concentration of As was reported in Nuwara Eliya soils than that reported in Welimada.
Concentrations of lead (Pb), cadmium (Cd) and arsenic (As) in the crop fields from two cultivating regions (mean ± s.e., sample size is as stated in Table 2).

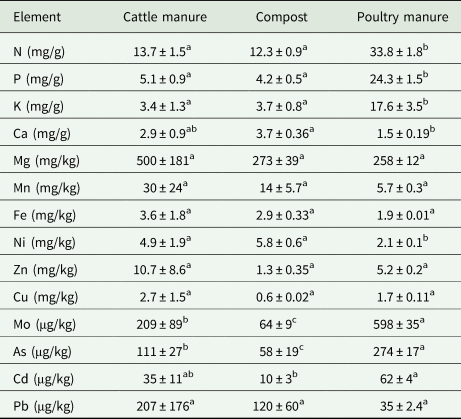
Cattle manure contained a higher concentration of Mg, Zn and Pb while poultry manure contained higher concentrations of Mo, As and Cd than other sources of organic manure (Table 5). The concentration of elements in cattle manure varied widely than that observed in poultry manure and compost. Compost contained the lowest concentrations of Zn, Cu, Mo, As and Cd than those in cattle manure and poultry manure.
Element concentration in the organic matter applied when extracted using 0.01 m CaCl2 (mean ± s.e., n = 6)

Note: Different letters within a row indicate statistically significant differences at α = 0.05.
Yield and dry matter content
The harvested fresh weights of cabbage, carrot roots and potato tubers were 2.6 ± 0.3, 2.2 ± 0.7 and 1.7 ± 0.5 kg/m2, respectively and were similar in the two regions. Dry matter content of the shoot samples of cabbage, carrot and potato were 7.5, 12 and 16.5%, respectively while that of carrot roots and potato tubers were 9 and 13.9%, respectively.
Concentration of mineral elements in shoots and roots
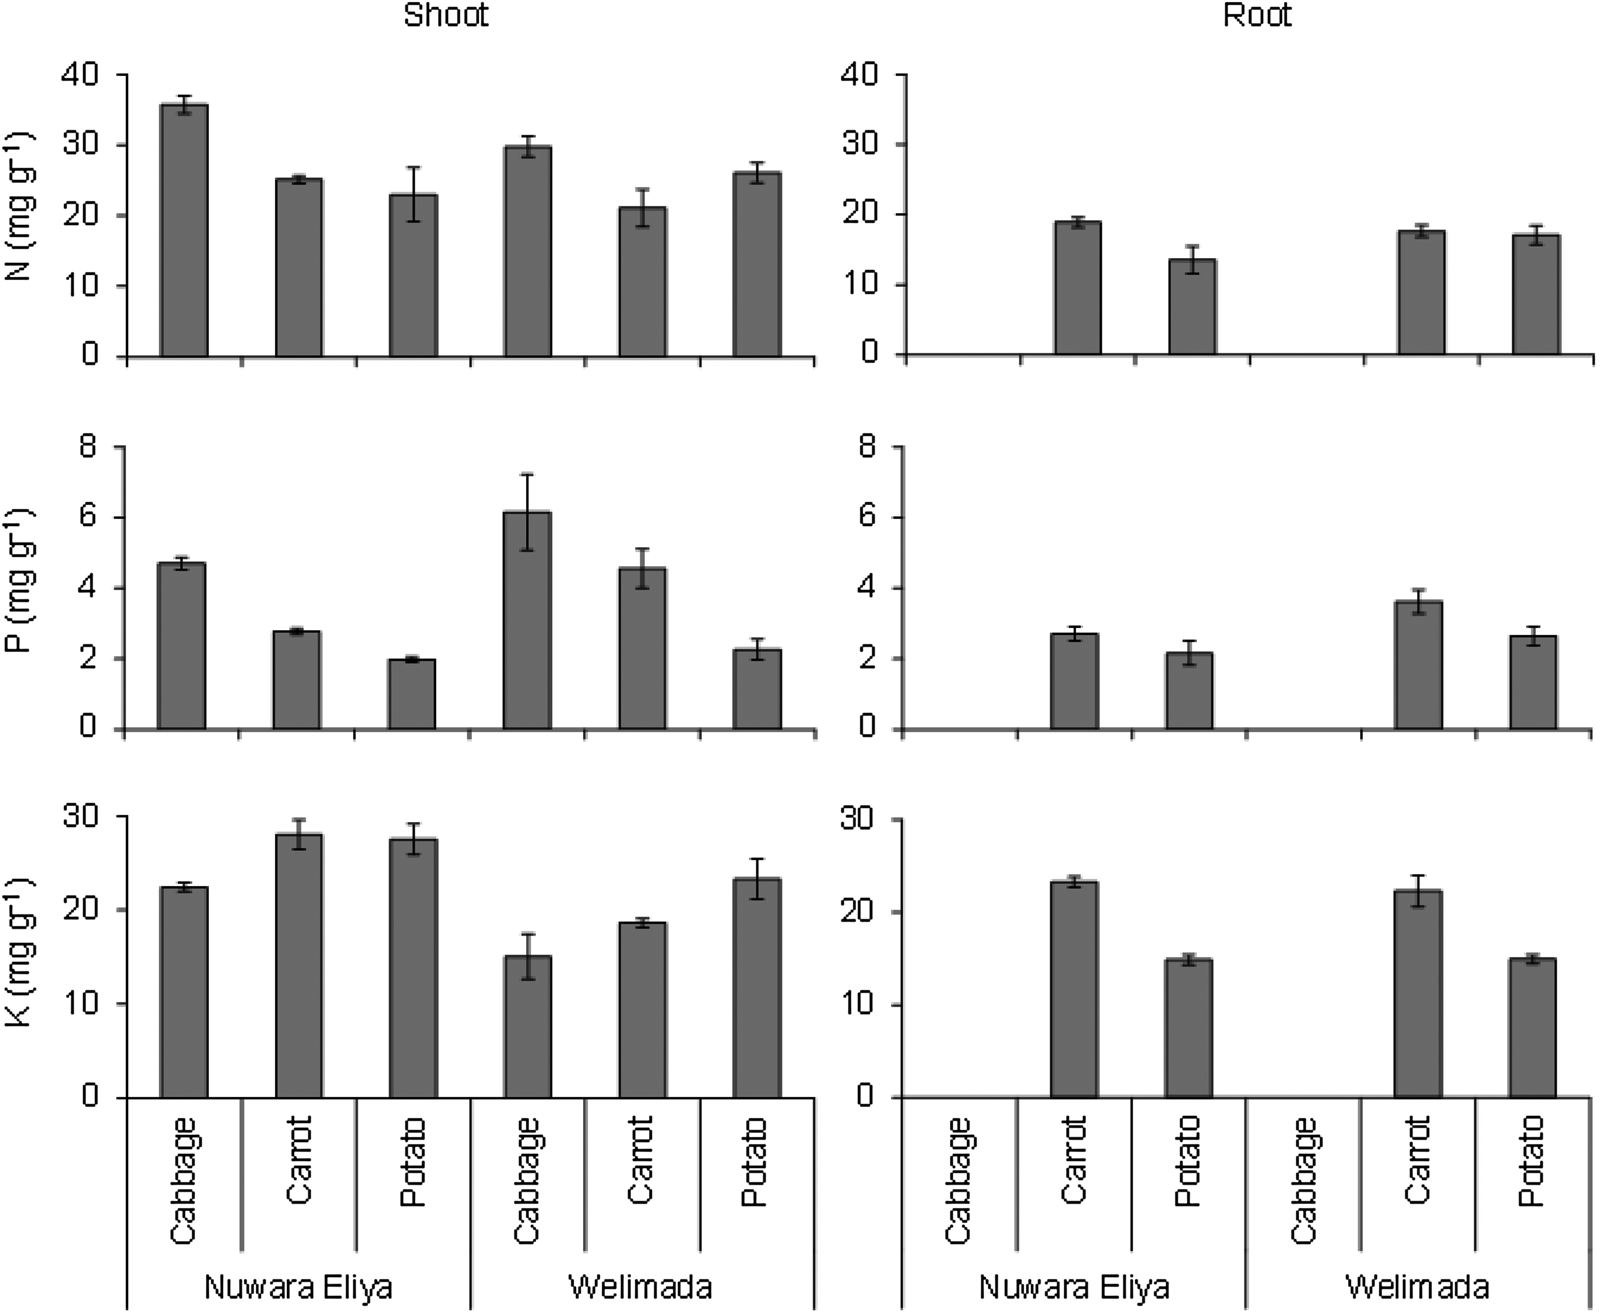
Nitrogen concentration in both roots and shoots of the three crops was similar between the two cultivating regions (Fig. 5). Carrot and potato shoots had higher N concentrations than that in their roots. When comparing crops, cabbage recorded the highest shoot N concentration in both regions. Nitrogen concentration in carrot roots was higher than that in potato tubers in Nuwara Eliya while it was similar between the two crops in Welimada. When comparing edible parts, cabbage shoots contained 1.8- and 2.1-times higher N concentrations than in carrot roots and potato tubers, respectively.
Tissue concentrations (on dry weight basis) of nitrogen (P), phosphorus (P) and potassium (K) grown in the two regions (mean ± s.e., sample size is as stated in Table 2).

Crops grown in Welimada had a higher shoot and root concentrations of P than that in Nuwara Eliya (Fig. 5). When comparing the three crops, the P concentration in the shoot was the highest in cabbage while that in potato shoots was the lowest in both the regions. Carrot roots contained more P than in potato tubers in both regions. When comparing edible parts, cabbage shoots contained 1.7- and 2.2-times higher concentrations of P than in carrot roots and potato tubers, respectively.
Shoot K concentration of the three crops was higher in Nuwara Eliya than that in Welimada while root K concentration between the two regions was similar (Fig. 5). Potato shoots had the highest K concentration while in cabbage shoots it was the lowest in both regions. Carrot roots contained more K than in potato tubers. When comparing edible parts, carrot roots contained 1.2- and 1.5-times higher concentration of K than in cabbage shoots and potato tubers, respectively.
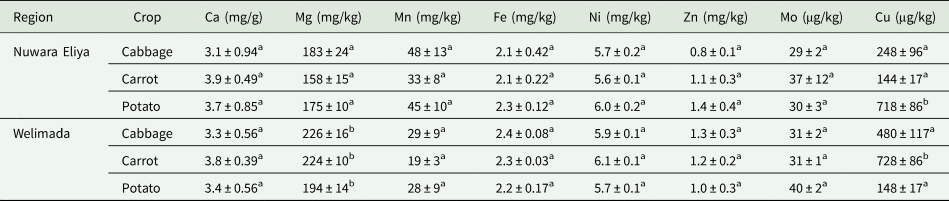
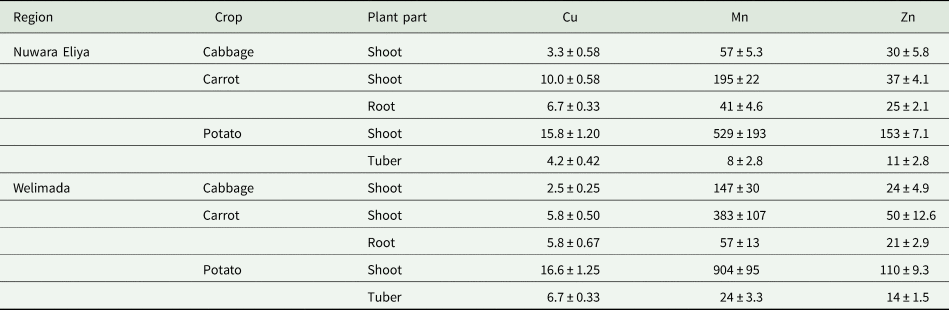
Apart from higher N, P and K, shoots of carrot and potato contained higher concentrations of Cu, Mn and Zn than that in their roots or tubers (Table 6). Among shoots, cabbage contained the lowest concentrations of Mn, Cu and Zn while potato contained the highest concentrations of those elements. When comparing edible parts, cabbage shoots contained higher concentrations of all the tested micro-nutrients than that in carrot roots and potato tubers (Table 6).
Micro-nutrient concentrations (mg/kg) in the shoots and roots of three crops from two cultivating regions, mean ± s.e.

Sample size is as stated in Table 2.
Concentration of toxic trace elements in shoots and roots
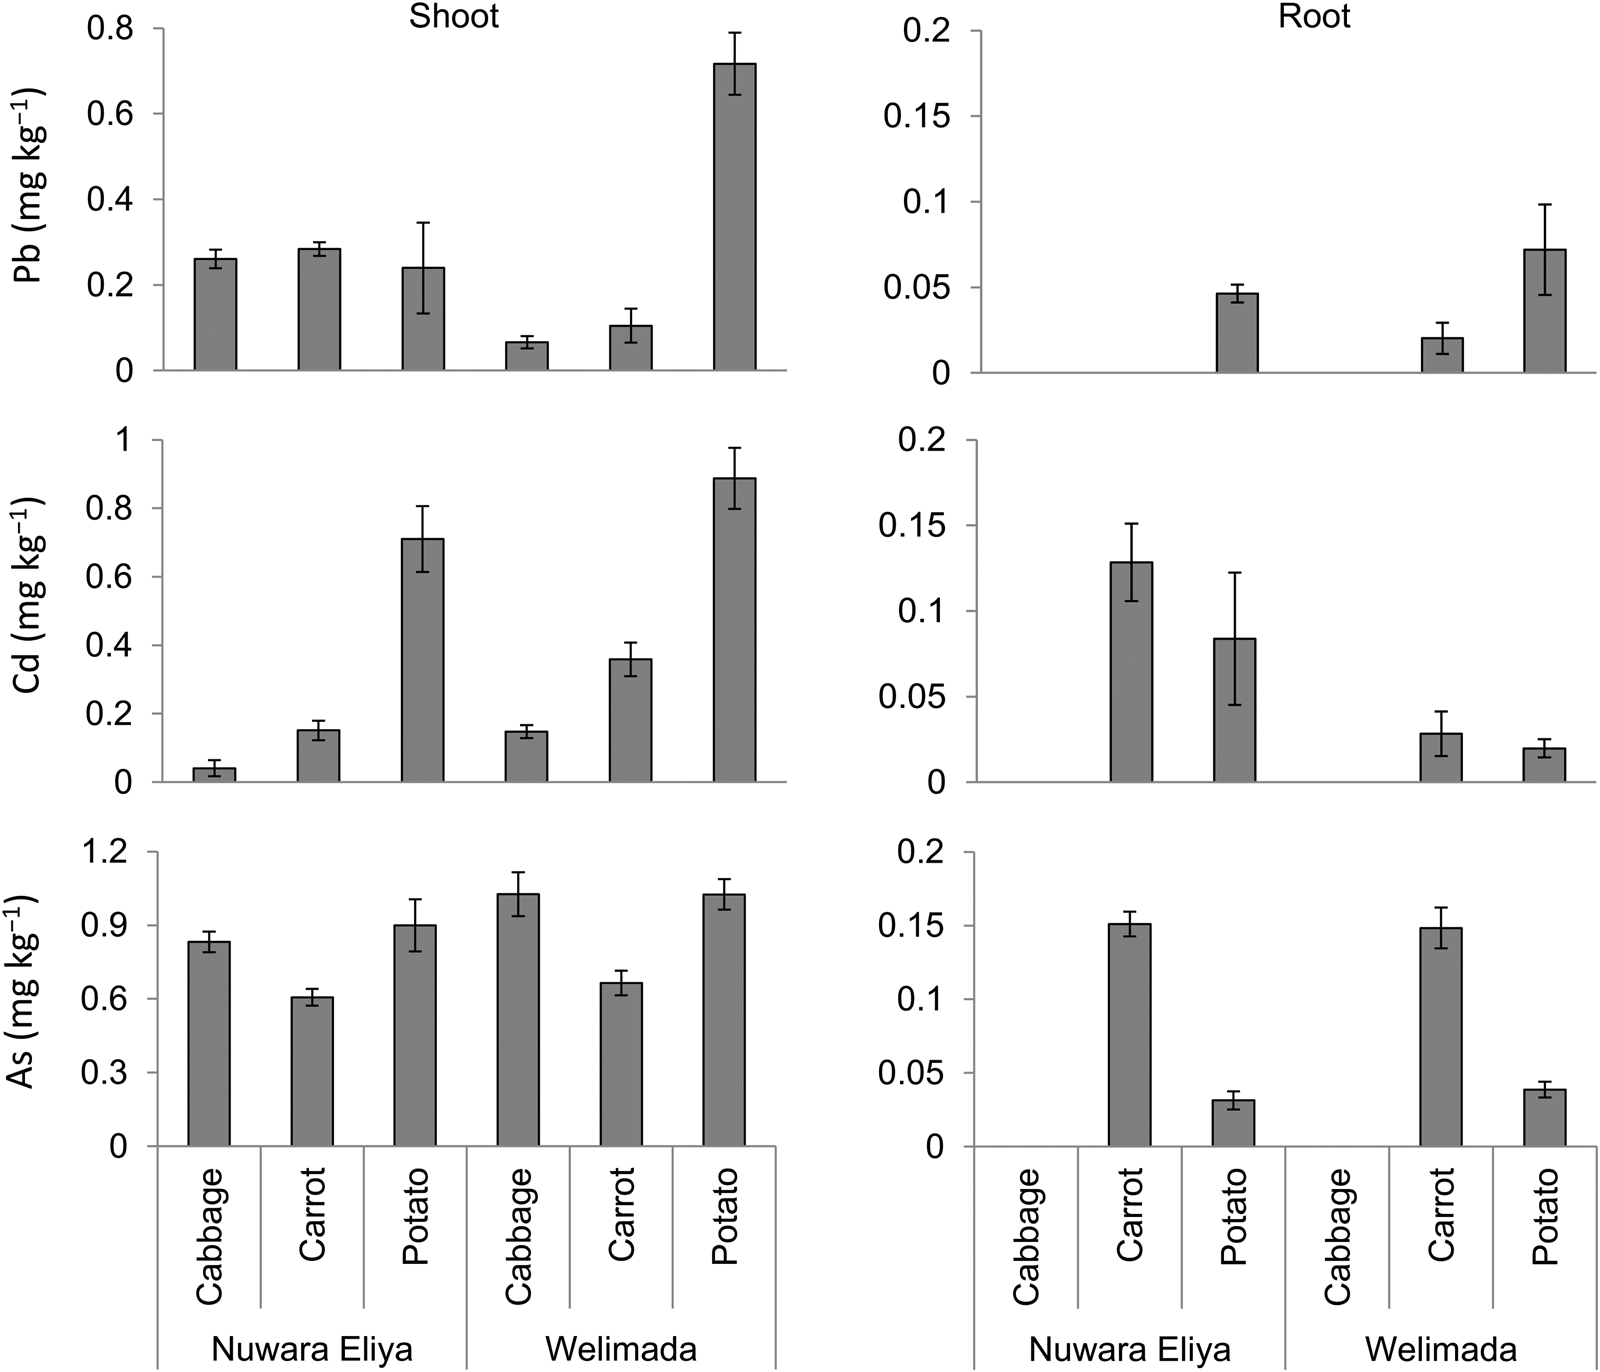
Irrespective of the region, carrot and potato shoots contained higher concentrations of As, Cd and Pb than those in their roots/tubers (Fig. 6). The concentration of Pb in potato shoots was higher than the other two crops in Welimada, while that in Nuwara Eliya was similar. The lowest and highest shoot Cd concentrations were recorded in cabbage and potato, respectively. The concentration of As in carrot shoots was lower than that in cabbage and potato shoots. When comparing edible parts, cabbage shoots contained the highest concentrations of As, Cd and Pb, i.e. 6- and 27-times higher concentration of As, 1.2- and 1.8-times higher concentration of Cd and 16- and 3-times higher concentration of Pb than that in carrot roots and potato tubers, respectively.
Tissue concentrations (on dry weight basis) of lead (Pb), cadmium (Cd) and arsenic (As) grown in two cultivating regions (mean ± s.e., sample size is as stated in Table 2). Note: The difference in Y-axis scale in the two panels.

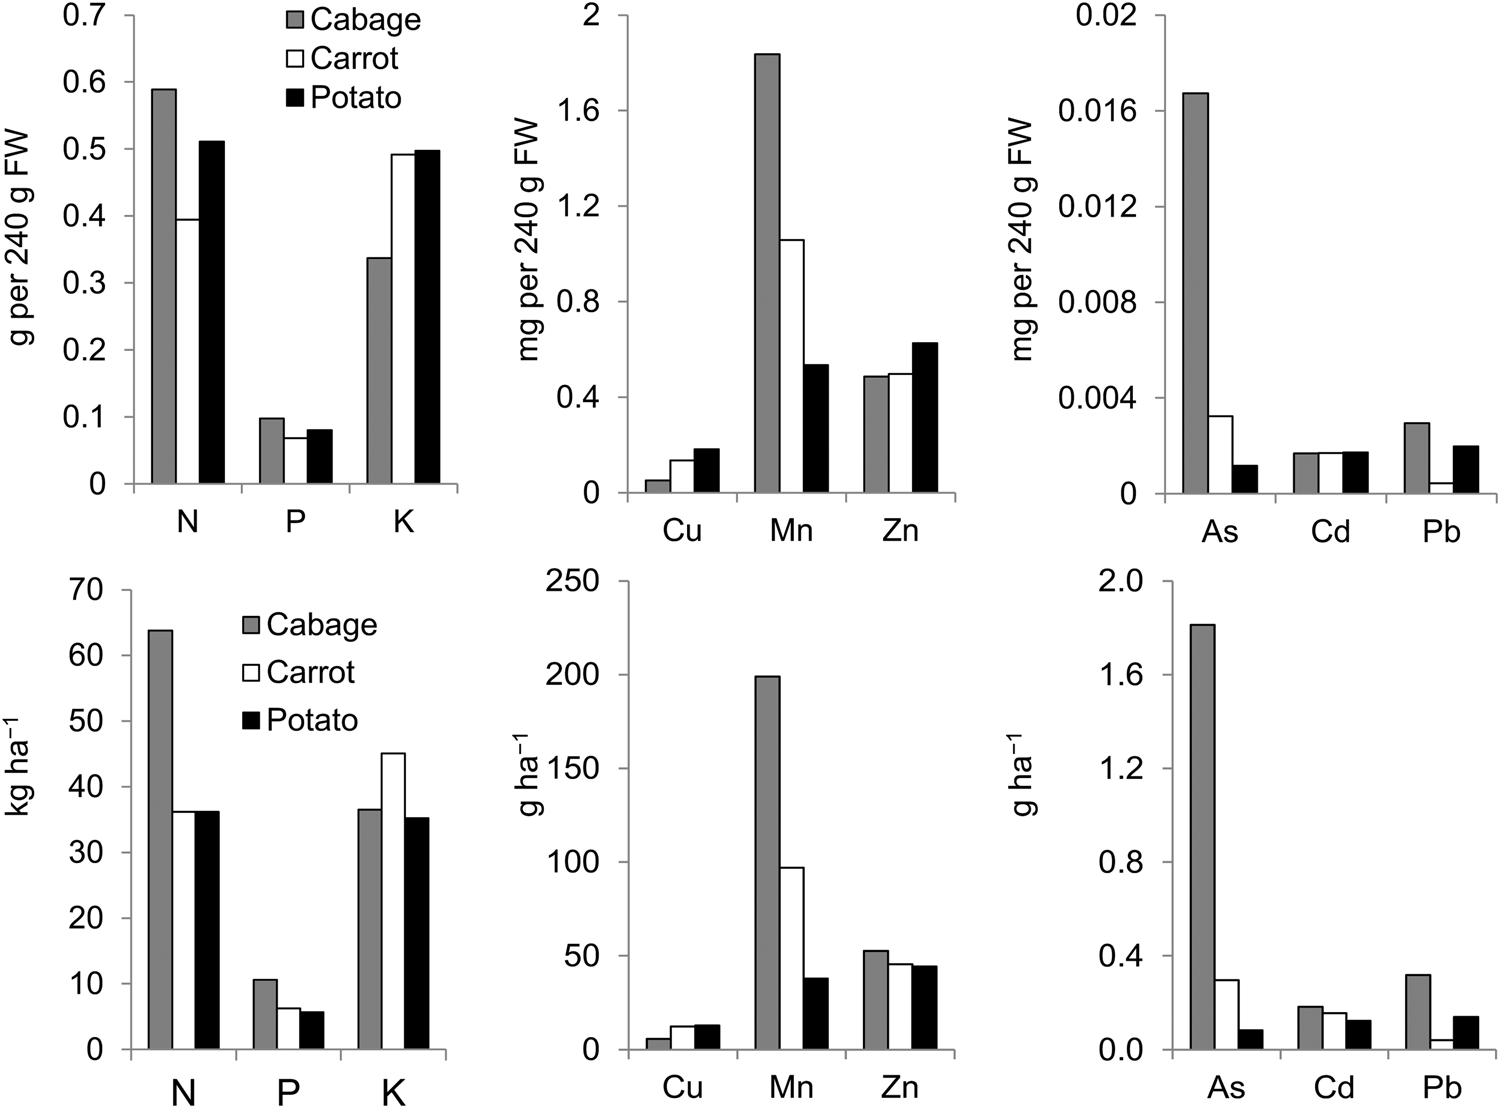
Irrespective of the crop, the mean quantity of mineral and toxic trace elements contained in 240 g of fresh edible parts of the three crops were 0.4–0.6 g N, 0.06–0.1 g P, 0.3–0.5 g K, 0.05–0.2 mg Cu, 0.5–2 mg Mn and 0.45–0.65 mg Zn (Fig. 7). Additionally, 0.001–0.02 mg As, 0.001–0.002 mg Cd, 0.0004–0.003 mg Pb were also contained in 240 g FW of those vegetables. The amount of mineral and toxic trace elements removed with the harvest from 1 ha land also had a similar pattern, i.e. 36–64 kg N, 6–11 kg P, 35–45 kg K, 6–13 g Cu, 37–199 g Mn, 44–53 g Zn, 0.1–1.9 g As, 0.12–0.18 g Cd and 0.04–0.32 g Pb per ha were removed (Fig. 7).
Mean amounts of essential mineral and toxic trace elements: present in 240 g (FW basis) of edible portion (top panel), and removed with the harvest from 1 ha land (bottom panel) of cabbage, carrot and potato.

Soil organic matter concentration had positive correlations with soil N, P and K concentrations, and soil EC had positive correlation with soil K concentration (P < 0.05). Soil organic matter concentration had positive correlations with shoot and root K concentrations, and soil pH had positive correlations with shoot and root P concentrations (P < 0.05).
Discussion
Concentrations of essential minerals and toxic trace elements in soils
Vegetable fields in both Nuwara Eliya and Welimada regions of Sri Lanka have been frequently and heavily fertilized using both inorganic and organic sources of nutrients for decades (Tables 3 and S1) (Dissanayake and Chandrajith, Reference Dissanayake and Chandrajith2009; Sirisena and Suriyagoda, Reference Sirisena and Suriyagoda2018; Dandeniya and Caucci, Reference Dandeniya, Caucci, Hettiarachchi, Caucci and Schwärzel2020). Therefore, organic matter, N, P and K concentrations and EC values of these soils have been built up to much higher levels than required for optimal plant growth. The building up of organic matter levels may have improved the ability of soil to retain N, P and K as observed in the correlation analysis. As far as the authors are aware this much higher available P and exchangeable K concentrations have not been previously reported from any agricultural fields. This situation has caused soil solution to retain very high concentrations of N, P and K as observed in the leaching column experiment.
Apart from the application of straight fertilizers such as urea (N), triple superphosphate (P) and muriate of potash (K), the use of organic matter and inorganic fertilizer mixtures available in the market has resulted in the development of micro-nutrient levels, and inevitably, the toxic trace element concentrations due to their poor quality (Tables 3 to 5) (Premarathna et al., Reference Premarathna, Hettiarachchi and Indraratne2005; Dissanayake and Chandrajith, Reference Dissanayake and Chandrajith2009; Bandara et al., Reference Bandara, Wijewardena and Seneviratne2010; Jayasumana et al., Reference Jayasumana, Fonseka, Fernando, Jayalath, Amarasinghe, Siribaddana, Gunatilake and Paranagama2015). The concentrations of micro-nutrients and toxic trace elements made available to crops through the application of organic matter varied depending on the type of organic matter applied and the region, e.g. organic matter added to soil in these regions contained a lower concentration of As than that reported in rice cultivating regions of Sri Lanka (Jayasumana et al., Reference Jayasumana, Fonseka, Fernando, Jayalath, Amarasinghe, Siribaddana, Gunatilake and Paranagama2015). Moreover, they also reported that the inorganic fertilizers contained a higher concentration of toxic trace elements than those observed in organic matter. On the contrary, addition of organic matter could reduce the bioavailability of As in soil (Suriyagoda et al., Reference Suriyagoda, Dittert and Lambers2018), and this may be the reason for observing lower concentration of As in Nuwara Eliya soils than that reported in Welimada. Despite these heterogeneities, due to the continuous application of fertilizers and manures the concentrations of micro-nutrients and toxic trace elements have been built up to very high levels. Similar to the findings of this experiment, the presence of high micro-nutrient and toxic trace element concentrations in the soils from the same regions and intensively cultivated cropping fields in North China have previously been reported (Premarathna et al., Reference Premarathna, Hettiarachchi and Indraratne2005; Ju et al., Reference Ju, Kou, Christie, Dou and Zhang2007).
Soils in these two regions were rich in organic matter, particularly at Nuwara Eliya. The application of poultry manure and cattle manure has become popular among vegetable farmers in these regions as it increases productivity than applying inorganic fertilizers alone (Table 2) (Wijewardena and Amarasiri, Reference Wijewardena and Amarasiri1997). However, the direct application of green manure/crop residue has not been practiced by the farmers as the on-site decomposition of those materials requires time, and the farmers were not prepared to keep the land crop-free until those materials get decomposed. Instead, these farmers used green manure/crop residues as inputs when preparing organic matter. Moreover, the direct application of green manure/crop residue was evidenced in cropping systems with lower intensity of rotation, e.g. perennial-based cropping systems, home gardens and rice-based cropping systems (Sirisena and Suriyagoda, Reference Sirisena and Suriyagoda2018). The greater accumulation of organic matter in Nuwara Eliya than in Welimada would be due to the cooler temperatures in Nuwara Eliya slowing down the rate of organic matter decomposition and mineralization (Table 1). Moreover, due to the practice of crop rotation significant differences in mineral element concentrations among fields within a region was not observed. As a result, irrespective of the crop grown, Nuwara Eliya soils retained more organic matter than that in Welimada.
Farmers in these vegetable cultivated fields have not adopted adequate soil conservation practices despite being located in mountainous areas exposed to heavy rainfall (Samarakoon and Abeygunawardena, Reference Samarakoon and Abeygunawardena1996; Diyabalanage et al., Reference Diyabalanage, Samarakoon, Adikari and Hewawasam2017; Weerakkody and Mawalagedera, Reference Weerakkody, Mawalagedera, Marambe, Weerahewa and Dandeniya2020). It has also been reported that the disturbed and damaged soil structures with high organic matter content can no longer be protected by microbial decomposition and aggregation (Kobierski et al., Reference Kobierski, Lemanowicz, Wojewódzki and Kondratowicz-Maciejewska2020). These conditions have aggravated the risk in erosion and leaching, polluting aquatic ecosystems downstream which are important tributaries and reservoirs in Sri Lanka (Samarakoon and Abeygunawardena, Reference Samarakoon and Abeygunawardena1996; Bandara et al., Reference Bandara, Wijewardena and Seneviratne2010; Diyabalanage et al., Reference Diyabalanage, Samarakoon, Adikari and Hewawasam2017; Sirisena and Suriyagoda, Reference Sirisena and Suriyagoda2018). This highlights the importance of revising (e.g. cutting down) fertilizer application plans and adopting soil conservation methods urgently in the two regions.
Vegetables as a source of essential mineral elements
Among the edible parts of the crops studied, element concentrations were the highest in cabbage and lowest in potato. A similar pattern was observed in the amounts of mineral and toxic trace elements removed with the harvest from 1 ha of land, except for K and Cu. However, the amounts of mineral element intake through these crops in a daily ration (i.e. 240 g FW) did not follow the same pattern due to the difference in their dry matter content (i.e. cabbage < carrot < potato) (Fig. 7).
Even though these soils have been heavily fertilized, only P and K showed high concentrations in plant tissues. Moreover, none of the crops displayed deficiency or toxicity symptoms of mineral elements. This may be due to the ability of these soils to retain mineral elements in exchangeable and/or fixed forms allowing the release of those to soil solution as the soil solution concentration declines due to plant uptake (Wijewardena and Amarasiri, Reference Wijewardena and Amarasiri1997). Therefore, vegetables produced in this region can be considered as a major source of mineral elements to the local community and used to minimize mineral malnutrition (i.e. hidden hunger). However, people suffering from chronic disorders such as kidney disease may reduce the consumption of vegetables such as cabbage and carrot produced in this region as those vegetables contain high concentrations of P and K (Parpia et al., Reference Parpia, L'Abbé, Goldstein, Arcand, Magnuson and Darling2018).
When comparing mineral accumulation, N concentration in green leaves of a range of vegetables from different parts of the country was lower than that reported in the present study (Liyanage et al., Reference Liyanage, Thabrew and Kuruppuarachchi2000). Similarly, potatoes produced in Canada and the Czech Republic, and cabbage produced in Turkey also contained lower concentrations of essential mineral elements in their edible parts and in the soil solution than reported in this experiment (Kiziloglu et al., Reference Kiziloglu, Turan, Sahin, Kuslu and Dursun2008; Bártová et al., Reference Bártová, Diviš, Bárta, Brabcová and Švajnerová2013; Liang et al., Reference Liang, Jiang, Nyiraneza, Fuller, Murnaghan and Meng2019). However, Takahashi et al. (Reference Takahashi, Yanai, Umeda and Sasaki2018) and Wen et al. (Reference Wen, Huang, Zhang and Hu2019) reported similar concentrations of N, P and K in cabbage and lettuce tissues when grown in soils well fertilized with N, P and K. Therefore, higher tissue N, P and K concentrations reported in the crops grown in the two regions would also be due to heavy N, P and K fertilization.
Vegetables act as a key source of micro-nutrients in the human diet. Mineral elements such as Zn, Mn and Cu are either components in the large number of enzymes or essential for enzymatic reactions in both plants and animals (Abeywickrama et al., Reference Abeywickrama, Koyama, Uchiyama, Shimizu, Iwasa, Yamada, Ohashi and Mitobe2018). According to the current rate of vegetable consumption by a Sri Lankan adult (i.e. 240 g per day), per capita consumption of 0.05–0.2 mg Cu, 0.45–0.65 mg Zn and 0.5–2 mg Mn per day through these vegetables was observed. These amounts represent only 5–23% Cu (i.e. out of 0.5–1 mg Cu per day), 7.5–11% Zn (i.e. out of 6–20 mg Zn per day) and 22–87% Mn (i.e. out of 1.6–2.3 mg Mn per day) of the recommended daily intake (IMNA, 2001), and thus, these vegetables contributed as a key source of mineral elements requirement to the local community. It has also been reported that the residents of almost all South Asian countries consume extremely low quantities of fruits and vegetables, lower than the World Health Organization recommendation (Dizon et al., Reference Dizon, Herforth and Wang2019; Jayawardena et al., Reference Jayawardena, Jeyakumar, Gamage, Sooriyaarachchi and Hills2020). Therefore, in terms of quantity, vegetable consumption must be increased, particularly for vegetable-based diets to increase the provision of mineral elements through vegetables. Moreover, the identification of vegetables rich in minerals and methods that can be used to enrich/fortify vegetables with minerals need to be investigated (Dobosy et al., Reference Dobosy, Endrédi, Sandil, Vetési, Rékási, Takács and Záray2020).
Carrot and potato shoots contained high concentrations of mineral elements and toxic trace elements than those present in their roots/tubers, and higher than those present in cabbage shoots. Despite nutritional excellence, carrot and potato shoots are not generally consumed as vegetables but used in making compost. Even though the chance of contaminating with toxic trace elements is lower in shoots than that in roots or tubers (Setiyo et al., Reference Setiyo, Harsojuwono and Gunam2020), an opposite response was observed in the present study. As samples were carefully washed under running water before oven drying for element analysis, the observed concentration of mineral elements would have not been due to surface accumulation, but represent the amount accumulated in leaf tissues. This can be due to the heavy use of foliar fertilizers and pesticides for these crops in this region (Shahid et al., Reference Shahid, Dumat, Khalid, Schreck, Xiong and Niazi2017). However, this needs further testing and confirmation.
Although mineral elements are essential, excessive and long-term intake, higher than the required amount may cause complications, e.g. long-term intake of Zn higher than the recommended level would cause problems in the metabolism of Cu (FAO/WHO, 2001).
However, according to the findings of this study the available concentrations of essential mineral elements cannot cause a serious threat to its consumers as the tissue concentrations have not been built up to toxic levels, but, would cause negative impacts to the environment. Therefore, it is important to reduce the rates of inorganic fertilizer and/or organic matter applications, implement soil conservation methods, educate farmers on good agricultural practices (GAP), avoid the flow of agricultural residues and wastewater directly to natural waterways to minimize environmental pollution and increase the health, safety and wellbeing of these vegetable growers and consumers (Weerakkody and Mawalagedera, Reference Weerakkody, Mawalagedera, Marambe, Weerahewa and Dandeniya2020). In this process, evaluation and monitoring of nutrient levels in soils and vegetables and implementation of policy and regular measures by the responsible organizations is required.
Accumulation of toxic trace elements in vegetables
According to the FAO/WHO (2019) guidelines established for human consumption, the maximum permissible limit of Pb in Brassica vegetables and root and tuber crops is 0.1 mg/kg (Table S1). Similarly, the maximum permissible limit of Cd in Brassica vegetables is 0.05 mg/kg, and in root and tuber crops is 0.1 mg/kg. European Commission (EU, 2006) has set the permissible levels of Cd and Pb in potato tubers as 0.05 and 0.1 mg/kg, respectively. Moreover, the maximum permissible levels of Cd, Pb and As set for leafy vegetables and root crops in China are 0.05, 0.1 and 0.5 mg/kg, respectively (GAIN, 2014). All the above limits have been given on a fresh weight basis. When comparing those limits with the values observed in the present experiment (i.e. concentration of toxic trace elements in dry weight basis × dry matter content/100), the concentrations of As, Cd and Pb observed in edible parts of these crops on fresh weight basis did not exceed the maximum permissible limits established. However, Premarathna et al. (Reference Premarathna, Hettiarachchi and Indraratne2005) reported the presence of high Cd in cabbage shoots from the same region exceeding maximum permissible limits. Similarly, the leafy vegetable Mukunuwenna (Alternanthera sessilis L.) samples collected from different urban regions in Sri Lanka also contained similar or higher concentrations of Cd and Pb than observed in the present study (Kananke et al., Reference Kananke, Wansapala and Gunaratne2014, Reference Kananke, Wansapala and Gunaratne2016). It has also been reported that irrigation of agricultural lands with wastewater leads to the accumulation of toxic trace elements in soils and crops grown (Kiziloglu et al., Reference Kiziloglu, Turan, Sahin, Kuslu and Dursun2008; Sharma et al., Reference Sharma, Katnoria and Nagpal2016). Therefore, the concentration of toxic trace elements in vegetable crops depends on the variation in soil characteristics such as soil pH, clay and organic matter contents, crop management practices such as quality of irrigation water and fertilizer applied, and crop adaptations (Tack, Reference Tack2014; Khan et al., Reference Khan, Khan, Khan, Qamar and Waqas2015; Setiyo et al., Reference Setiyo, Harsojuwono and Gunam2020). It was also suggested that P fertilizers induced immobilization of heavy metals such as Pb, Cd, and Zn in soil (Wang et al., Reference Wang, Xie, Chen, Jiang and Su2008; Yang et al., Reference Yang, Chen, Fan, Li, Gao, Wang, Wang, Zhou and Zeng2019) and decreased translocation from roots to shoots in cabbage (Qiu et al., Reference Qiu, Wang, Yang and Yuan2011). However, this response depends on the concentration of P and other competing elements in soil (Suriyagoda et al., Reference Suriyagoda, Dittert and Lambers2018). As there is a risk of accumulating high concentrations of toxic trace elements in vegetables grown in the regions, agronomic mitigation strategies need to be implemented in order to ensure the sustainability of these cropping systems and the health of consumers.
Concluding remarks
Intensive vegetable cultivating lands in the Nuwara Eliya and Welimada regions of Sri Lanka have received heavy doses of agrochemicals to maximize crop productivity. As a result soil organic matter, essential mineral element (N, P and K) and toxic trace element (As, Cd and Pb) concentrations have been built up to high levels, risking the contamination of natural water sources. Three major vegetable crops grown in the region, cabbage, carrot and potato also contained high concentrations of essential mineral elements (N, P and K). Moreover, those vegetables contributed to 5–23% of Cu, 7.5–11% of Zn and 22–87% of Mn per capita of recommended daily intakes. The concentrations of As, Cd and Pb did not exceed the maximum permissible limits. Overall, improving the awareness of farmers on agronomic malpractices, and the introduction of GAP are urgently needed to conserve soil and ensure the sustainability of these cropping systems.
Supplementary material
The supplementary material for this article can be found at https://doi.org/10.1017/S0021859622000156.
Acknowledgements
The authors acknowledge the technical assistance given by the officers in the Department of Crop Science, Faculty of Agriculture, Mr Anurashantha and Agriculture Instructors (AIs) in the two regions for field assistance.
Author contributions
L. D. B. S., O. D. and R. C. conceived and designed the study. L. D. B. S., O. D., V. K., I. M. and N. D. conducted data gathering. L. D. B. S. performed statistical analyses. L. D. B. S., O. D., V. K., I. M., N. D. and R. C. wrote the article.
Financial support
Financial support was provided by the University of Peradeniya.
Conflict of interest
The authors declare that the research was conducted in the absence of any commercial or financial benefits that could be construed as a potential conflict of interest.