Introduction
What processes generate and distribute soil moisture and shallow groundwater in the cold polar desert of the McMurdo Dry Valleys (MDV), Antarctica? Although shallow groundwater was initially considered to be an insignificant portion of the MDV hydrological system (Cartwright & Harris Reference Cartwright and Harris1981), interest has been growing in the origin, distribution and biological impact of near-surface groundwater in the Dry Valleys (Lyons et al. Reference Lyons, Welch, Carey, Doran, Wall, Virginia, Fountain, Csatho and Tremper2005, Harris et al. Reference Harris, Carey, Lyons, Welch and Fountain2007, Levy et al. Reference Levy, Fountain, Gooseff, Welch and Lyons2011, Reference Levy, Fountain, Gooseff, Barrett, Vantreese, Welch, Lyons, Nielsen and Wall2013, Ball & Virginia Reference Ball and Virginia2012, Nielsen et al. Reference Nielsen, Wall, Adams, Virginia, Ball, Gooseff and McKnight2012, Gooseff et al. Reference Gooseff, Barrett and Levy2013, Toner & Sletten Reference Toner and Sletten2013). Shallow groundwater is defined as water, brine or other saline solution found in the active layer (the seasonally thawed portion of the permafrost, typically 20–60 cm deep). This contrasts with deep groundwater that may flow within or beneath the ice table in the MDV (McGinnis & Jensen Reference McGinnis and Jensen1971, Cartwright & Harris Reference Cartwright and Harris1981).
An intriguing feature of shallow groundwater and the soils through which it flows in the MDV is that they are commonly saline to hypersaline, with total dissolved solids (TDS) ranging from 1–2 g l-1 in dilute water tracks to >600 g l-1 in concentrated wet patches (Levy et al. Reference Levy, Fountain, Gooseff, Welch and Lyons2011, Reference Levy, Fountain, Welch and Lyons2012, Gooseff et al. Reference Gooseff, Barrett and Levy2013). Solutes enter the shallow groundwater system through several processes inferred to be operating in the MDV, including dissolution of snow condensation nuclei during snow/glacier melt and evaporation (Lyons et al. Reference Lyons, Fountain, Doran, Priscu, Neumann and Welch2000, Dickinson & Rosen Reference Dickinson and Rosen2003, Hagedorn et al. Reference Hagedorn, Sletten, Hallet, McTigue and Steig2010, Toner & Sletten Reference Toner and Sletten2013), dissolution of soil salts during groundwater flow (Toner et al. Reference Toner, Sletten and Prentice2013), rock weathering and/or cation exchange during groundwater flow (Levy et al. Reference Levy, Fountain, Gooseff, Barrett, Vantreese, Welch, Lyons, Nielsen and Wall2011, Toner & Sletten Reference Toner and Sletten2013), rock weathering and direct marine emplacement (Claridge & Campbell Reference Claridge and Campbell1977, Campbell & Claridge Reference Campbell and Claridge1987), and potentially even salt deliquescence during periods of high humidity (Wilson Reference Wilson1979, Levy et al. Reference Levy, Fountain, Gooseff, Barrett, Vantreese, Welch, Lyons, Nielsen and Wall2011). These salts move through the soils and shallow groundwater in the MDV, where they precipitate as saline horizons or weathering rinds and encrustations or discharge into saline lakes and ponds (Claridge & Campbell Reference Claridge and Campbell1977, Levy et al. Reference Levy, Fountain, Gooseff, Barrett, Vantreese, Welch, Lyons, Nielsen and Wall2011).
The most solute-rich shallow groundwater in the MDV is found in ‘wet patches’; spatially isolated spots of soil that are dark-toned, damp and hypersaline (Levy et al. Reference Levy, Fountain, Welch and Lyons2012). Wet patches have an average of c. 3% soil moisture (moisture by mass, or gravimetric water content, GWC, will be used here, rather than volumetric water content) and wet patch pore fluids have a mean TDS of c. 580 g l-1 (Levy et al. Reference Levy, Fountain, Welch and Lyons2012). Wet patches are common in Taylor Valley, and have been reported in Wright and Pearse valleys as well (Levy et al. Reference Levy, Fountain, Welch and Lyons2012), but have not been widely reported above c. 1000 m elevation. These wet patches appear static; trenching shows that bulk soil liquids are not flowing into or out of them (as is the case with water tracks). Wet patches re-appear inter-annually in the same locations, manifesting as wet, dark surface soil areas that persist even when ground surface temperatures are below 0°C (perhaps as low as -6 to -17°C) (Levy et al. Reference Levy, Fountain, Welch and Lyons2012).
Wet patches are believed to form by absorption of water vapour by hygroscopic brines and/or soil salts. Salts, and salt mixtures, spontaneously deliquesce when relative humidity (RH) exceeds a critical value, which is composition (and occasionally temperature) dependent (Edgar & Swan Reference Edgar and Swan1922, Tang & Munkelwitz Reference Tang and Munkelwitz1993, Yang et al. Reference Yang, Pabalan and Juckett2006, Gough et al. Reference Gough, Chevrier, Baustian, Wise and Tolbert2011). Levy et al. (Reference Levy, Fountain, Welch and Lyons2012) demonstrated that the water activity of wet patch pore fluids is sufficiently low, owing to high salinity, that hydration occurs by absorbing atmospheric water vapour. Water activity (aw) is defined as the equilibrium RH over a solution divided by 100 (aw=RH/100). If RH rises, then the solution will adsorb water vapour until equilibrium is reached again. This process dilutes the solution, raising its aw, until aw=RH, resulting in equilibrium conditions. Wet patches in the MDV gain water vapour when RH>aw and dehydrate when RH<aw. Each salt has a characteristic equilibrium aw limit when in a saturated solution, which results in the efflorescence of the salt if the solution dehydrates further.
The hydration of saline brines in the MDV can be rapid and dramatic. When high RH air masses encounter existing soil pore solutions, hydration of these solutions by atmospheric water vapour can produce an increase in soil moisture of several weight percent, detectable as visible darkening of the soil surface over a matter of hours (Dickson et al. Reference Dickson, Head, Levy and Marchant2013).
Several abundant soil salts deliquesce under RH conditions that occur commonly in the MDV, including halite, carnallite, magnesium chloride and calcium chloride (Keys Reference Keys1979, Levy et al. Reference Levy, Fountain, Welch and Lyons2012), suggesting that salt deliquescence and hydration could be the source of pore waters in wet patches, much as it is for intergranular fluids that support life in hyper-arid warm deserts, such as the Atacama (e.g. Davila et al. Reference Davila, Gómez-Silva, de los Rios, Ascaso, Olivares, McKay and Wierzchos2008). Accordingly, the aim of this experiment was to determine whether soil salts distributed in natural MDV soils will deliquesce under laboratory conditions, and whether the resulting brines can hydrate to form macroscopic, pore-filling, saline waters. In particular, the goal of this experiment was not to study the detailed kinetics of salt deliquescence and brine hydration at the individual grain level (e.g. Davila et al. Reference Davila, Duport, Melchiorri, Jänchen, Valea, de los Rios, Fairén, Möhlmann, McKay, Ascaso and Wierzchos2010, Gough et al. Reference Gough, Chevrier, Baustian, Wise and Tolbert2011), but rather to determine at the landscape-observable scale whether bulk pore waters can form in Antarctic wet patch soils as a consequence of salt deliquescence and subsequent brine hydration, and at what rate this formation of bulk pore waters occurs under two different RH regimes.
Sample collection
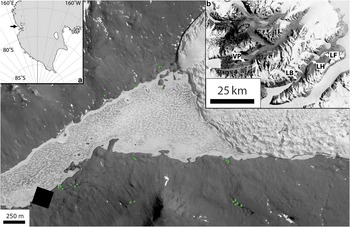
Sediment samples used in this study were collected from Taylor Valley, one of the coastal MDV, during the 2010–11 summer (Fig. 1). Taylor Valley is centred on -78°S, 162°E, has a mean annual air temperature of -18°C (Doran et al. Reference Doran, McKay, Clow, Dana, Fountain, Nylen and Lyons2002), and experiences 3–50 mm water equivalent of snowfall per year, most of which sublimates (Fountain et al. Reference Fountain, Nylen, Monaghan, Basagic and Bromwich2009). Sediment samples from 122 individual sites were analysed in this study. Most of these were collected in the Lake Hoare basin and the remainder were from the Lake Bonney, Lake Fryxell and VXE6 pond basins. Details of the chemistry and experimental hydration history of these soils are reported in the supplementary data table and supplementary figures (found at http://dx.doi.org/10.1017/S0954102014000479). Samples were collected from the upper 10 cm of the soil surface using DI-rinsed polyethylene scoops, and were stored in double-bagged, sealed Whirl-Pak bags. Samples were collected from wet patches, water tracks, and dry (not visibly dark and damp) control soils within 5–10 m of wet soils that were selected to minimize apparent water track influence. Other sediments were also collected from strandline salt efflorescences around the Lake Hoare margin, or from ice cemented soils underlying dry or wet active layer soils. Water track soils were collected in organized sampling grids with c. 50 m between each sampling line and c. 5–10 m between sampling points on each transect (Levy et al. Reference Levy, Fountain, Gooseff, Barrett, Vantreese, Welch, Lyons, Nielsen and Wall2013). Samples were frozen in the field and transported to McMurdo Station for analysis.
Context map showing the location of sampling sites in the Lake Hoare basin, McMurdo Dry Valleys (MDV). Green dots indicate sampling locations. Note, multiple samples may be drawn from beneath a single dot, sampling points were thinned to minimize overlap and enhance clarity. Base map is a portion of QuickBird image 09FEB01213752. Inset a. shows location of the MDV and inset b. shows locations of lakes Hoare (LH), Bonney (LB), Fryxell (LF) and VXE6 Pond (VP).

Methods
Major ion analysis
The major ion content of sediment samples was determined by ion chromatography (IC), using the methods described in Welch et al. Reference Welch, Lyons, Whisner, Gardner, Gooseff, McKnight and Priscu2010. Sediment samples were thawed in the Crary Laboratory at McMurdo Station and dried for 24 hours at 105°C. Dried sediments were homogenized in the bag via thorough massaging, and a 100 g split was collected from the sample with a clean, polyethylene scoop. Sediment samples were then mixed into a 3:1 water to rock solution by mass and agitated for one minute to extract the soluble phases. Soluble phase extracts were then filtered through 0.45 µm HT Tuffryn membrane filters, and were kept cold (+4°C) until analysis by IC (within 1–2 weeks). Major ion compositions (mg l-1) were determined for Ca2+, Mg2+, K+, Na+, Cl-, SO4 2-, NO3 - and F- (alkalinity, as HCO3 -, was determined via charge balance) producing a measure of TDS in mg l-1. Complete geochemical results are reported in the supplementary materials (found at http://dx.doi.org/10.1017/S0954102014000479). Salt content in dry soil (wt.% salt) was determined by multiplying the TDS by the mass of water used in the dilution and dividing by the density of water and the mass of sediment from which the salts were dissolved.
Grain size analysis
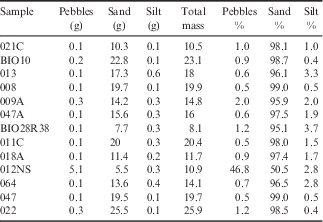
Sample splits were sieved in order to determine the grain size distribution in thirteen representative samples. Splits were oven dried at 105°C for 24 hours, and were dry sieved in order to separate pebbles (coarser than 2 mm), sand (2 mm to 63 µm), and silt/clay (finer than 63 µm) fractions. Sieved fractions were weighed to determine the mass percent of pebbles, sand and silt/clay. Grain size data are reported in Table I.
Grain size data for representative samples.
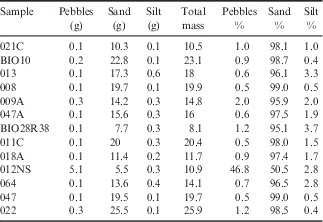
Pebbles:>2 mm, Sand: 0.063–2 mm, Silt:<0.063 mm
Deliquescence and hydration experiment
The deliquescence and hydration experiment consisted of measurement of mass change with time for sediment samples placed in RH-controlled chambers. Samples were all initially oven dried at 105°C for 24 hours to remove any moisture present from the field. Sample splits c. 3 g were then placed in previously weighed plastic petri dishes. Sediment splits were weighed using a 0.1 mg precision balance to determine their initial dry weight. Two splits were prepared for each sample; one for hydration in each hydration chamber.
Sample hydration chambers consisted of a rectangular plastic container with a removable lid. Lids were secured to the container with clamping brackets, and the chamber was sealed with a plastic O-ring that sandwiched between the lid and the container. Sample chamber RH was chemically controlled by placing a 500 m l-1 beaker containing a humidifying solution in each chamber. One chamber was humidified by a beaker containing pure, 18 MΩ deionized water, which produces an RH of 100%. The second was humidified with a beaker containing deionized water mixed with NaCl to produce a saturated solution. This humidistat produces an RH of 75%. Chambers were sealed and allowed to humidify for 24 hours during initial sample drying. Chamber RH was monitored using VWR RH-on-a-Card traceability cards; the 100% RH chamber showed 100% RH conditions and the 75% RH chamber showed 75±5% RH conditions throughout the course of the experiment.
Weighed sediment samples were subsequently loaded into each chamber, with petri dish lids in an open configuration. A control petri dish containing no sediment was placed in each chamber in order to assess the magnitude of water adsorption onto plastic petri dishes. External control petri dishes were stored outside of the chambers in order to quantify the measurement uncertainty of the balance. Chambers were then sealed, and left undisturbed in a windowless, basement laboratory that experiences minimal temperature fluctuations at c. 20°C.
Sample mass was weighed at three intervals, after 1, 7 and 20 days. Cumulative GWC was calculated by differencing the mass of the hydrated sample from the mass of the original dry sample (both less the mass of the petri dish), and dividing the result by the mass of the dry sample. If the change in soil mass was below the uncertainty of the measurement (± 0.014 g, or c. 0.1% for samples of average mass), then the change in GWC was set to zero. Sediment petri dishes were closed during weighing periods in order to minimize any exchange with the laboratory atmosphere, but were re-opened upon return to the hydration chamber.
Results
The soil samples experienced different degrees of hydration over the experimental study period. Most sediments experienced little or no measurable hydration: 74 of 122 samples experienced no detectable mass change, and an additional 29 absorbed<1 wt.% water. The formation of pore fluids in the remaining 19 samples was observed as visible changes to sediment colour from light to dark, increases in sediment clumpiness, and even the presence of standing water in the petri dish in late observations (see supplementary video for an example of the visible changes to a sediment sample during hydration, found at http://dx.doi.org/10.1017/S0954102014000479).
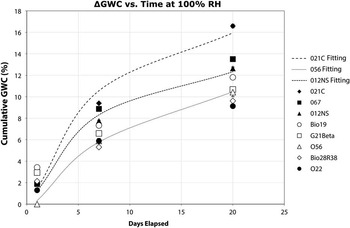
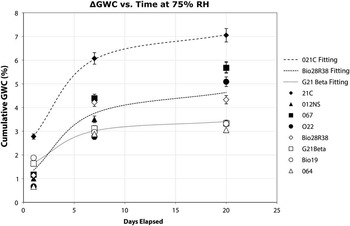
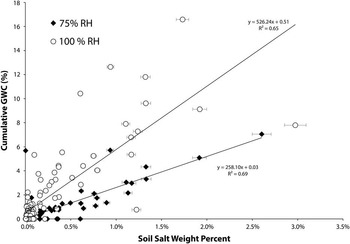
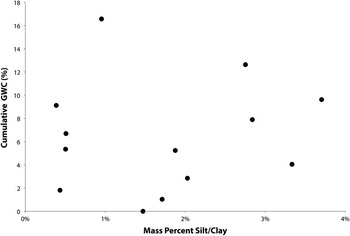
Sediment mass gain over time was rapid for some samples (Figs 2 & 3) and slow/negligible for the remainder. All mass changes are reported in the supplementary data table. Cumulative GWC gains over 20 days ranged from 0–16.6% for samples in the 100% RH chamber and 0–7.1% for samples in the 75% RH chamber. For comparison, saturation GWC for a typical Taylor Valley soil with a bulk density of 1.8 g cm-3 and a porosity of 30% is 16.7%. Cumulative GWC change correlated with sample soil salt content (R 2 ≈ 0.7) (Fig. 4) and increases with increasing salt content. Cumulative GWC change did not correlate with the clay/silt content of the sediments studied, which ranged from 0–4% (Fig. 5). For samples in both the 100% and the 75% RH chambers, the rate of mass change was fastest during the initial 24-hour hydration period, and slowed during each of the subsequent hydration periods.
Plot of cumulative gravimetric water content (GWC) increase in the 100% relative humidity (RH) chamber versus time. Exponentially-decaying best-fit lines are used as eye-guides and were computed by fitting the data points for each sample to an elementary exponential equation: GWC (%)=exp(-1/Ct), where C is a sample-specific fitting constant and t is time in days.

Plot of total cumulative gravimetric water content (GWC) increase in the 75% relative humidity (RH) chamber versus time. Exponentially-decaying best-fit lines are used as eye-guides and were computed by fitting the data points for each sample to an elementary exponential equation: GWC (%)=exp(-1/Ct), where C is a sample-specific fitting constant and t is time in days.

Plot of total cumulative gravimetric water content (GWC) increase versus soil salt weight percent for all samples. Cumulative GWC increases with increasing soil salt content. RH=relative humidity.

Plot of total cumulative gravimetric water content (GWC) increase versus mass percent silt/clay (fine sediments) for thirteen random samples. Water absorption is not strongly correlated with the amount of fine sediment in the sample.

Discussion
Role of salt solubility and extraction efficiency in geochemical results
At the low water/rock ratio used in this study (3:1), several ions (most notably Ca2+ and Mg2+) may be under-extracted (Toner et al. Reference Toner, Sletten and Prentice2013), which reduces the total ion concentration measured, suggesting that the soil salt concentrations reported here should be interpreted as minimum values. However, since all samples received the same pre-treatment, the trends observed in salt content remain robust. Likewise, the cation exchange capacity is typically c. 40 meq kg-1 for sandy Antarctic soils (Cameron & Conrow Reference Cameron and Conrow1969, Toner et al. Reference Toner, Sletten and Prentice2013). For wet patch soils, total equivalent cation concentration (TECC) averages c. 300 meq kg-1, indicating that the extractions are dominated by soluble salts (Toner et al. Reference Toner, Sletten and Prentice2013). Interestingly, water track sample TECC averages c. 66 meq kg-1, suggesting a smaller concentration of soluble salts, consistent with total salt weight percent. Off-track soils typically have low TECC, suggesting that exchange chemistry may dominate these soils with low soluble salt content.
Interpretations drawn from the dataset
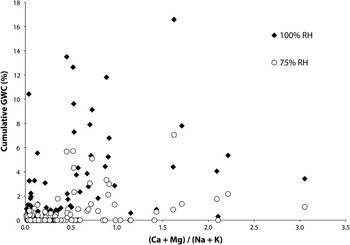
First, the observations that changes to soil GWC are i) correlated with soil salt content and ii) most rapid during the first observation period suggests that deliquescence of initially present soil salts is the primary source of the initial brines that subsequently hydrate and grow in volume to produce the observed sediment pore solutions. Deliquescence of soil salts, rather than adsorption of water onto fine silicate grains as the primary driver of initial brine formation is further indicated by the lack of correlation between sediment silt/clay fraction and increases in GWC in this sample set. Grain size may play a more significant role in water absorption onto fine-grained (not sand-dominated) soils in the MDV. Brine composition (Ca-Mg-Cl versus Na-K-Cl, Toner & Sletten Reference Toner and Sletten2013) appears to strongly control cumulative GWC gain (Fig. 6), consistent with low aw in Ca-Mg-Cl brines. Interestingly, brine composition correlates well with total salt content (Fig. 6), suggesting that concentrated brines in the study area may be composed of mobile, Ca-Mg-Cl brines that have been concentrated in the landscape (e.g. Toner & Sletten Reference Toner and Sletten2013, Toner et al. Reference Toner, Sletten and Prentice2013). These concentrated Ca- and Mg-dominated salts readily deliquesce and are concentrated, leading to formation of large volumes of bulk pore water. Formation of this bulk pore water is consistent with soil-moisture-induced colour changes observed by Levy et al. (Reference Levy, Nolin, Fountain and Head2014).
Cumulative water absorption and total soil salt content versus brine type. Ca-Mg-Cl dominated brines plot towards the right using this scheme. Ca-Mg-Cl brines experience higher cumulative gravimetric water content (GWC) gains and constitute the most concentrated solutions. RH=relative humidity.

The relatively modest correlation between salt content and cumulative GWC (R 2 ≈ 0.7) shown in Fig. 4 may be a consequence of incomplete homogenization of the samples. If salt distribution is patchy and results in sediment cementation, then incomplete homogenization may have resulted in reduced amounts of salts actually present in the experimental splits compared to the amount of salt known to be in the bulk sample. This would account for samples with relatively high (expected) salt concentrations that experienced little to no cumulative hydration.
Role of temperature
These experiments were conducted at room temperature therefore it is important to assess the impact of lower temperatures that characterize the natural MDV soil salt environment (-30° to +10°C). Davila et al. (Reference Davila, Duport, Melchiorri, Jänchen, Valea, de los Rios, Fairén, Möhlmann, McKay, Ascaso and Wierzchos2010) found that natural chloride salts can lose half or more of their ability to absorb atmospheric water vapour as salt temperature decreases from 20°C to 0°C. In these experiments salt samples were allowed to equilibrate over several hours or up to 1 day. In our water absorption experiments, natural sediment/salt mixtures were still gaining mass through water vapour absorption after 20 days, which suggests that temperature-dependent water absorption effects may not be as great as previously thought. However, some reduction in the cumulative GWC gain for soil pore waters at lower temperatures is to be expected, which may partially explain why large cumulative water absorptions seen in the laboratory are c. 50% greater than those observed in the field (Levy et al. Reference Levy, Fountain, Welch and Lyons2012).
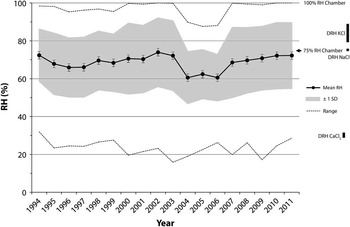
To relate laboratory measurements to field conditions, it is important to recognize that deliquescence relative humidity (DRH) for some salts is temperature dependent, owing largely to changes in the solubility of the solute with temperature (Robinson & Stokes Reference Robinson and Stokes1965). Critically, at low temperatures, it is the change in solubility that drives changes in equilibrium solution aw and salt DRH (Lewis et al. Reference Lewis, Randall, Pitzer and Brewer1961). For example, the DRH for KCl rises from c. 79% to c. 88% as temperature drops from 60˚C to 0˚C (Tang & Munkelwitz Reference Tang and Munkelwitz1993). Other salts are less affected by temperature: the DRH for NaCl only rises from c. 75% to c. 76% over the same temperature range (Tang & Munkelwitz Reference Tang and Munkelwitz1993). The DRH of CaCl2 is nearly temperature independent (Davila et al. Reference Davila, Duport, Melchiorri, Jänchen, Valea, de los Rios, Fairén, Möhlmann, McKay, Ascaso and Wierzchos2010). Importantly, for soil salts in the MDV, these DRH values are always below peak RH values in the valleys (Fig. 7), and in particular, are always below the RH supported by snowbanks or ground ice (which act as 100% RH sources) which may be present near wet patches.
Annual relative humidity (RH) conditions at the Lake Hoare MCM-LTER weather station based on daily average, minimum and maximum values. Grey area shows mean conditions±1 standard deviation (SD). Dashed lines show minimum and maximum daily range by year. The 75% RH chamber is within typical RH conditions experienced by Lake Hoare basin soils, while the 100% RH chamber represents high humidity conditions. Bars showing the temperature-dependent range of deliquescence relative humidity (DRH) for common soil salts are shown.

Ultimately, the mean annual RH values for Taylor Valley (Fig. 6) are comparable with the RH in the 75% RH chamber, and the cumulative hydration of the most saline soils in that chamber, c. 7%, is comparable to the maximum GWC of wet patch soils in Taylor Valley, c. 5% (Levy et al. Reference Levy, Fountain, Welch and Lyons2012). Interestingly, for valleys in which wet patches are not observed, mean annual RH values are significantly below 75% (e.g. c. 50% in Beacon Valley, www.mcmlter.org). Coupled with colder temperatures at elevation, there may be geographical constraints on wet patch activity in the MDV. However, accounting for the reduction in cumulative water absorption in cold, saline soils, the wetted soils observed in the field appear to be consistent with the mechanisms explored in the laboratory; namely, deliquescence of soil salts and subsequent hydration of the intergranular brines.
One interesting question raised by these results concerns the mobility of salts in the MDV. While water tracks show evidence of downslope flow of saline groundwater through channels that persist over decadal (or even century) timescales (Levy et al. Reference Levy, Fountain, Gooseff, Barrett, Vantreese, Welch, Lyons, Nielsen and Wall2011, Reference Levy, Fountain, Gooseff, Barrett, Vantreese, Welch, Lyons, Nielsen and Wall2013), wet patches appear to be immobile landforms. Given the presence of water vapour sources, such as surface snow banks and/or ice-rich permafrost, it may be possible that even ‘static’ features, such as wet patches, are slowly migrating brines or saline pore fluids downslope even at low elevations (the process has been inferred to operate at high elevations in the MDV, e.g. Wilson Reference Wilson1979). Likewise, it is possible that beneath thin, seasonal snowbanks, warm temperatures and long-duration water vapour fluxes may result in the formation and hydration of pore fluids comparable to those observed in the 100% RH chamber, resulting in the formation of sufficient fluid volume to saturate pores and/or flow out from beneath the snowbanks, even at temperatures below 0°C.
Conclusions
The data presented show that deliquescence and brine hydration can occur under laboratory conditions in natural MDV soils. For salty wet patch and water track soils, water vapour absorption can generate bulk pore fluids equal to GWC values of several percent up to saturation. Under the same atmospheric conditions, adjacent, low-salinity soils do not experience significant bulk hydration. This work does not address the mechanisms by which salts were initially emplaced in MDV soils, particularly in high concentrations, such as in wet patches. However, it does provide a demonstration of the formation of shallow groundwater brines similar to those observed in the MDV and of their subsequent hydration into bulk pore water.
Acknowledgements
Many thanks to the McMurdo Dry Valleys Long Term Ecological Research program for access to meteorological station data (via www.mcmlter.org). This work was supported in part by National Science Foundation award PLR-1343649 to JSL, AGF and WBL. Special thanks to Warren Dickinson and Jonathan Toner for their thoughtful and constructive reviews and to Andy Levy for additional discussion.
Supplemental material
Supplemental figures, table and video will be found at http://dx.doi.org/10.1017/S0954102014000479.