I
Between the 1950s and the 1980s, central banks in advanced economies relied to a significant extent on quantitative credit controls in their pursuit of macroeconomic stability (see e.g. Bezemer et al. Reference BEZEMER, RYAN-COLLINS, VAN LERVEN and ZHANG2018). As argued by Monnet (Reference MONNET2018a, Reference MONNET2018b), monetary authorities used these tools to fight inflation without raising the policy rate, thereby allowing domestic interest rates to remain in line with international rates. The parallel use of capital controls was instrumental in preventing financial institutions and households from circumventing domestic credit controls.
Examples of these instruments include selective credit controls introduced in the United States in the 1950s with the aim of influencing the housing cycle, or direct credit ceilings (Grebler Reference GREBLER and Grebler1960; Schreft Reference SCHREFT1990; Elliott et al. Reference ELLIOTT, FELDBERG and LEHNERT2013), and the special deposit scheme known as ‘the corset’ introduced in the United Kingdom in the 1970s (Aikman et al. Reference AIKMAN, BUSH and TAYLOR2016). In Sweden, Sveriges Riksbank introduced domestic credit controls in the 1950s, which were supported by exchange controls (Jonung Reference JONUNG, Bordo and Capie1993). The Banque de France used credit controls from 1948 to 1973 (Monnet Reference MONNET2014).
The experiences with these credit controls have received renewed attention in recent years, as they have been compared to macroprudential tools used in recent times to dampen the housing cycle or to constrain leverage (see e.g. Kelber and Monnet Reference KELBER and MONNET2014; Aikman et al. Reference AIKMAN, BUSH and TAYLOR2016; Bezemer et al. Reference BEZEMER, RYAN-COLLINS, VAN LERVEN and ZHANG2018; Galati and Moessner Reference GALATI and MOESSNER2018). One main difference between the credit controls and modern macroprudential tools is that in an environment characterised by a highly regulated, bank-dominated financial sector, central banks used the former to tame inflation, while the latter are being geared to supporting financial stability.
In the Netherlands, after a period in which qualitative credit controls were adopted occasionally (1945–60), quantitative credit restrictions were used from the 1960s to the early 1990s. These credit restrictions were introduced with the monetary policy objective of pursuing price stability via their impact on the intermediate target of the money supply. Since they were geared to money growth rather than credit growth, these policy tools focused on net rather than gross credit creation by the financial system. In parallel, De Nederlandsche Bank (DNB, the Dutch central bank) also controlled the exchange rate of the domestic currency, the Dutch guilder, through the policy interest rate, at times in conjunction with capital controls, to support price stability.
In this article we document the evolution of credit restrictions as a tool to contain money growth, against the background of a changing financial landscape. We then study the effects of credit restrictions on the balance sheet structure of banks and non-bank financial institutions. Our focus is on the impact of these restrictions on credit creation. We also analyse these effects separately for different types of banks – commercial banks, cooperatives, savings banks and mortgage banks – and institutional investors, since credit restrictions were not applied uniformly across types of financial institutions. This allows us to compare ‘treated’ and ‘untreated’ institutions, and to investigate the extent to which credit controls led to ‘leakages’ through a shift in credit supply across types of financial institutions. We then investigate whether credit restrictions had a systematic impact on inflation, their ultimate goal. Interestingly, while the literature on credit restrictions in the Netherlands has analysed their effects on the financial sector, this is the first study of their effects on inflation.
Three main results emerge from our empirical analysis. First, we find that when credit restrictions are active, the proportion of long-term funding increases for banks and other financial institutions affected by the restrictions but not for those that are not affected. Second, we find no negative effect of credit restrictions being active on overall credit growth. Lending by those sectors of the financial system that do show a negative response is more than compensated for by lending by other sectors that show no significant or even a positive impact. Third, we find that credit restrictions have a significant impact on inflation (in the desired direction) only temporarily, following the activation of a restriction. Taken together, these results suggest that banks and other financial institutions respond by switching to long-term funding to facilitate credit supply and still meet the restriction. Hence, credit restrictions were effective as an instrument to contain money growth through their impact on the composition of bank liabilities, rather than by reducing credit supply.
One interpretation of these results is that it is hard for central banks to contain credit growth in an evolving financial system, since there can be substitution from banks to ‘non-treated’ financial institutions, as suggested by the rise in institutional investors’ lending following credit controls. Nevertheless, the restrictions may have contributed to financial stability by making Dutch financial institutions more reliant on stable sources of funding, particularly in periods of rapid credit expansion.
The remainder of the article is organised as follows. Section II provides an overview of credit restrictions in the Netherlands. Section III introduces the data and empirical methodology. Section IV presents the results. Section V discusses the results and, finally, Section VI concludes.
II
Between 1960 and 1991, DNB used two main monetary policy instruments: restrictions on net money creation by financial institutions and changes in short-term policy interest rates (see e.g. Schotsman Reference SCHOTSMAN1987; Van Straaten Reference VAN STRAATEN1989; De Greef et al. Reference DE GREEF, HILBERS and HOOGDUIN1998; Van Ees et al. Reference VAN EES, STERKEN and GARRETSEN1999; Vanthoor Reference VANTHOOR2005). The credit restrictions were introduced with the monetary policy objective of influencing price stability (the ‘internal’ value of the Dutch guilder) via their impact on the intermediate target of the money supply. In particular, credit restrictions had the aim of containing the increase of money aggregates as a proportion of national income. This so-called liquidity ratio was considered an intermediate target of monetary policy; it had the goal of reducing inflationary pressures and, hence, stabilisation of the guilder. In parallel, DNB controlled the exchange rate (the ‘external’ value) of the guilder through the policy rate, at times in conjunction with capital controls. The legal arrangements underlying the monetary policy framework of DNB can be found in The Netherlands Bank Act (1948) and Article 10 of the Act on the Supervision of the Credit System (adopted in 1952 and revised in 1956, 1978 and 1992). Notably, while the goal of credit restrictions was included in the Bank Act, the actual instruments were included in the Supervision Act and implemented by supervisors. Every year since 1953, DNB included a section in its Annual Report to discuss and explain its credit restriction policy as defined in Article 10 of the Act on Supervision.
The credit restrictions had several important characteristics. First, the term ‘credit restriction’ does not fully acknowledge the fact that controls focused on net credit creation. Financial institutions did not necessarily have to cut lending to meet the restriction but could also switch to more long-term funding – and our results show that they generally preferred to do so. The conceptual framework underlying credit restriction policy was first presented by DNB in its Annual Report of 1953 (De Nederlandsche Bank 1954).
Second, quantitative credit restrictions were not applied uniformly to all types of financial intermediaries, and were for the most part applied to bank credit, irrespective of its sectoral allocation. These controls defined a maximum growth rate for an individual bank's outstanding credit, and were enforced if total bank credit growth exceeded a predetermined rate. By contrast, even though institutional investors and mortgage banks provided a significant proportion of lending, they were never subject to the restrictions. The reason is that these financial institutions relied only on long-term funding, and hence were not involved in money creation.
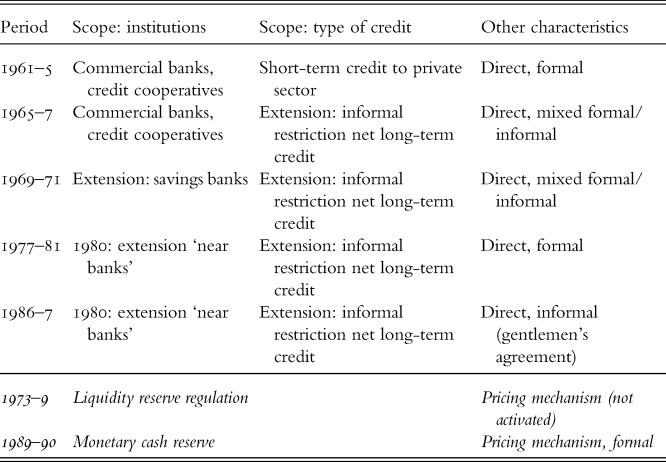
Third, the scope of credit restrictions was adjusted over time, reflecting the evolution of the banking sector that led to a blurring of distinctions between different types of banks (Table 1). Between 1960 and 1980, the types of banks that were subject to the restrictions was extended, from comprising only ‘general banks’ (i.e. commercial banks and credit cooperatives) to also including savings banks (1969), and the government's Postal Cheque and Giro Services (1970). In 1980, restrictions were extended also to so-called ‘near banks’, i.e. non-bank financial institutions which operated by attracting short-term funds. These ‘near banks’ included several industrial companies and public utilities. In the 1980s, the official distinction between these types of banks was discontinued and all banks were merged into one single category.
Overview of credit restrictions

Sources: DNB Annual Reports 1960–91; Schotsman Reference SCHOTSMAN1987; Holtrop Reference HOLTROP1972; Hilbers Reference HILBERS1989; De Greef et al. Reference DE GREEF, HILBERS and HOOGDUIN1998; van Ees et al. Reference VAN EES, STERKEN and GARRETSEN1999.
Fourth, the type of credit that was targeted by credit controls also changed over time. Initially only short-term credit to the private sector was affected, under the assumption that long-term credit was fully financed with long-term funding (which was not included in the definition of money supply) and therefore less relevant for money creation. Over time, as this assumption appeared not to hold, credit controls took the form of limits on ‘net long-term financial activity’ by banks, defined as the difference between long-term lending and long-term funding. In 1965, net long-term credit (the difference between long-term credit and long-term funding) was subject to an informal restriction, while from 1977 onwards, total money creation (the difference between total credit and long-term funding) was used as the basis for the restrictions.Footnote 1
Fifth, some modalities of restrictions could be fine-tuned. Controls were not just switched on and off, but could be eased or further tightened. Moreover, the penalty for banks that did not meet the restrictions – i.e. the requirement to hold non-bearing deposits – could be adjusted.
Sixth, whereas most restrictions were imposed as direct, quantitative limitations on (net) credit supply, in two cases they were implemented through a pricing mechanism. The latter were more market-oriented by allowing individual banks – if they were prepared to pay the price – to grow faster than others. In the 1970s, a complementary measure was introduced to stop encouraging borrowing through media advertising. We did not explore the differential impact of these modalities, as they were typically in place for short periods and often hard to quantify.
Finally, and in contrast to macroprudential measures that have been implemented in recent times, the credit restrictions relied on a presumption of coordination and cooperation between policymakers and financial institutions. Any restriction was implemented on the basis of consultation between the central bank and the financial sector, and some of the restrictions were informal and voluntary (Vanthoor Reference VANTHOOR2005). The formal cooperation was enshrined in the 1952 Act on the Supervision of the Credit System, which stated that a decision by the central bank to restrain bank lending required consultation with representatives from the banking sector. A disagreement by the latter could be overruled only upon consultation of DNB with the minister of finance (De Greef et al. Reference DE GREEF, HILBERS and HOOGDUIN1998).
A noteworthy example of a less formal cooperation between the central bank and the banking sector, which arguably allowed a more agile implementation, is the ‘Gentlemen's Agreement’ of 1986, a voluntary restriction on growth of net lending by Dutch banks (Sluijter and van der Werff Reference SLUIJTER and VAN DER WERFF1989).
Similarly to the recent experience with macroprudential tools, credit restrictions in the Netherlands were adopted in an environment of financial globalisation and innovation. In the 1970s and 1980s, the Dutch financial sector experienced increasing competition, innovation and integration in global financial markets. These changes were supported by a gradual deregulation of domestic financial markets and a liberalisation of international capital flows (Hilbers Reference HILBERS1998). As a consequence, Dutch monetary authorities faced increasing challenges in targeting the money supply. As in current circumstances, policymakers were confronted with two types of leakages – cross-country policy arbitrage, since restrictions in domestic credit expansion could be counteracted by foreign capital inflows, and arbitrage across parts of the domestic financial sector, since liberalisation contributed to blurring the distinction between the traditional and shadow banking sectors.
The changing environment in the 1980s and 1990s prompted major changes in the policy regime in the Netherlands. In its 1991 Annual Report, DNB discussed several trends that had made credit restrictions less effective over time. The long-term relationship between money supply and national income had become increasingly unstable; domestic money creation had become less relevant given the importance of foreign capital flows; and the exchange rate had become a dominant policy target. DNB concluded that the monetary cash reserve – then the instrument to implement credit controls – would be deployed with great caution and only in very special circumstances. With hindsight, this marked the end of monetary policy through credit restrictions in the Netherlands, with credit restrictions as a policy tool being suspended in the early 1990s.
In 1992, monetary authorities changed both their strategy – into a pure exchange rate targeting regime – and their instruments, with the policy rate as the only instrument. This regime remained in place until the start of Economic and Monetary Union in 1999. In parallel, regulation and supervision by DNB was modified and the Act on Supervision of the Credit System was revised substantially in 1992, in two main ways. First, the perimeter of regulation and supervision by DNB was extended from general banks to the entire banking system (i.e. including also savings banks and mortgage banks), as well as ‘near banks’ and mutual funds. This change can be compared to current efforts to increasingly extend the perimeter of macroprudential instruments from the banking sector to non-bank financial institutions. Second, the requirement for the central bank to try to reach an agreement with the banking sector about monetary measures was eliminated.
III
We use quarterly balance sheet data of Dutch financial institutions to investigate the response to credit restrictions during the period 1960–94. Most data are taken from publications by DNB and Statistics Netherlands. The timing of credit restrictions is based on DNB's Annual Reports and studies by Van Straaten (Reference VAN STRAATEN1989) and Van Ees et al. (Reference VAN EES, STERKEN and GARRETSEN1999). More detailed information on our data and definitions, and the restriction periods, is provided in Appendix A.Footnote 2
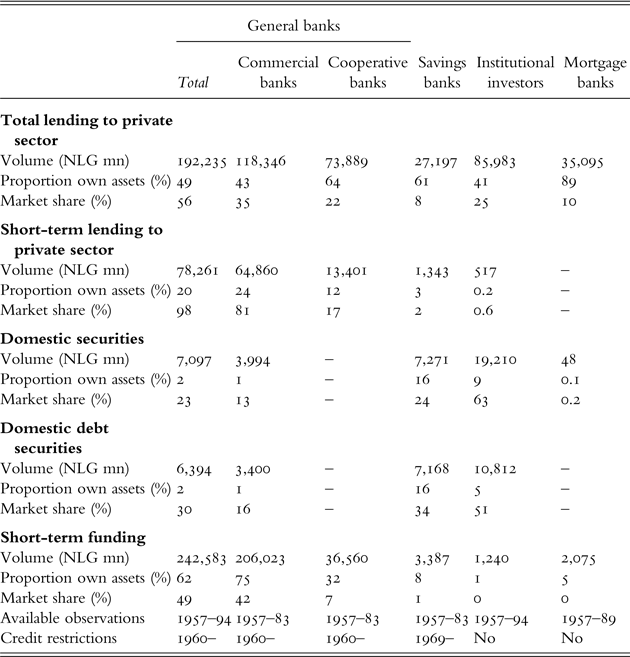
Financial institutions are grouped into general banks (comprising commercial banks and cooperative banks), savings banks, institutional investors and mortgage banks.Footnote 3 We use aggregate time series for each of these subsectors. Table 2 presents key balance sheet items in 1980, and highlights several cross-sectoral differences over the entire sample period. More than half of commercial banks’ private sector lending consists of short-term loans. For cooperative banks, short-term loans are about one fifth of total lending while the other categories almost exclusively focus on long-term lending (including mortgages). The importance of short-term funding shows a similar pattern: it is very high for commercial banks, much lower but still substantial for cooperative banks, and very limited or virtually non-existent for the other categories. Domestic securities holdings, however, are highest for savings banks and institutional investors, and very low for the other groups.
Balance sheet variables: stylised facts (1980)

Sources: DNB (1985, 2000, 2003); DNB Annual Reports; de Greef et al. Reference DE GREEF, HILBERS and HOOGDUIN1998; van Ees et al. Reference VAN EES, STERKEN and GARRETSEN1999.
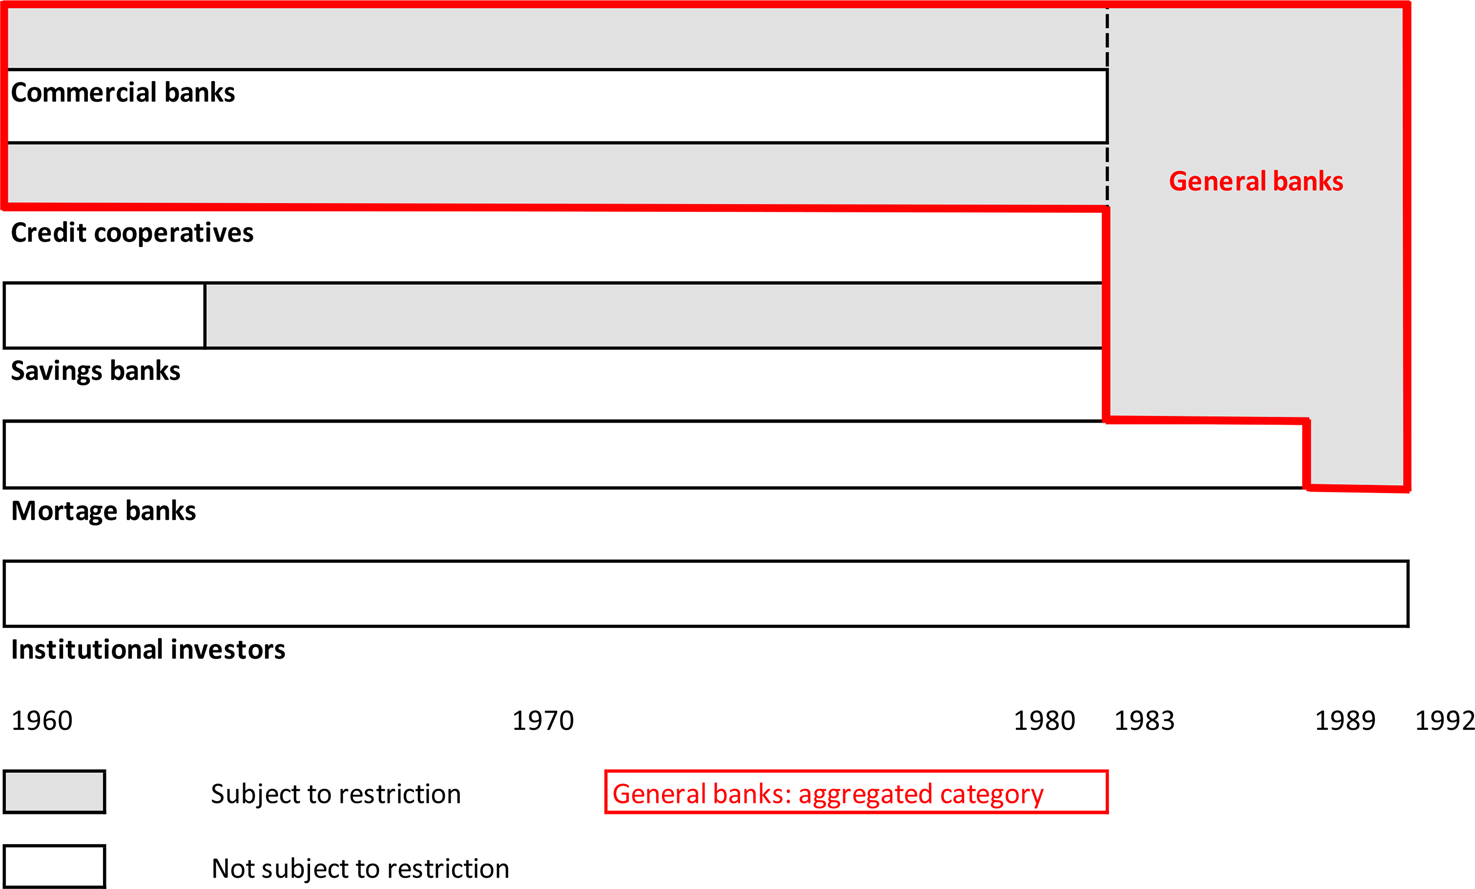
This classification into subgroups was abandoned as the distinctions were blurred over the years, and regulation and supervision were harmonised. Some of the groups presented in Table 2 ceased to exist as separate categories during our sample period (Figure 1). In the early 1980s, commercial banks, cooperative banks and savings banks were all merged into the single category of general banks. At the end of the 1980s, mortgage banks were also no longer considered a separate class. As a consequence, time series over the full sample period are only available for general banks and institutional investors.
Timeline of the implementation of credit restrictions by sector

On the basis of Table 2, one would expect that general banks, particularly commercial banks, were most affected by credit controls, as they were subject to the restrictions over the entire period and largely funded themselves short-term. Savings banks were only subject to the restrictions after 1969 and were mostly financed long-term, implying that the impact of restrictions on this type of banks is expected to be relatively modest. Institutional investors and mortgage banks were never subject to the restrictions but may still have responded to them, for instance by providing more credit to compensate for lower credit supply by general banks.
To formally analyse the response of the Dutch financial sector to the credit restrictions, we estimate two baseline regressions for each subsector:
 $$y_t = A_1( L ) X_t + B_1( L ) cr_t{}^{active} + \varepsilon _t$$
 $$y_t = A_2( L ) X_t + B_2( L ) cr_t{}^{tighten} + C( L ) cr_t{}^{ease} + \varepsilon _t$$
where yt is the real growth rate of a balance sheet variable (lending, long-term funding, securities holdings); Xt is a vector of macroeconomic control variables (industrial production growth; short-term interest rates, largely reflecting DNB's policy rates);Footnote 4 crtactive is a credit restriction dummy, which equals one during periods when restrictions were in place and zero otherwise; crttighten and crtease are dummies capturing the activation or de-activation of credit restrictions, which are equal to one in the quarters when restrictions were activated and de-activated, respectively, and zero otherwise. We consider different cases, where these dummies refer to all banks together, and where they refer separately to different types of banks. The credit restrictions never applied to some types of lenders – particularly institutional investors and mortgage banks – since they were by definition not involved with money creation, i.e. only attracted long-term funding. Equation (1) analyses the impact of credit restrictions being active on the real growth rate of bank balance sheet variables. Equation (2) tests the impact of the adoption versus the withdrawal of the restrictions, which may reveal asymmetric effects. All balance sheet and macroeconomic variables are included in real terms as annual growth rates.
In addition to balance sheet items, we examine other variables that were likely to have played a role in financial institutions’ response to credit restrictions. Net bond issues are a direct way to increase long-term funding, while changes in deposit rates are a way to influence clients’ preferences to hold longer maturities. In addition, the response of money aggregates – net money creation by banks, M2 and the M2/GDP ratio – is important to assess the effectiveness of credit restriction policies. These variables are only available at the aggregate banking sector level and therefore do not allow us to investigate differences between subsectors.
This is the first study that focuses not only on the impact of credit restrictions in the Netherlands on financial institutions’ balance sheets, but also on whether and how they achieved their intended goal of containing inflation.Footnote 5 One example of such an exercise for a different country can be found in Monnet (Reference MONNET2014), who estimated the impact of monetary policy – including credit restrictions – on inflation and output during the Bretton Woods period in France.
IV
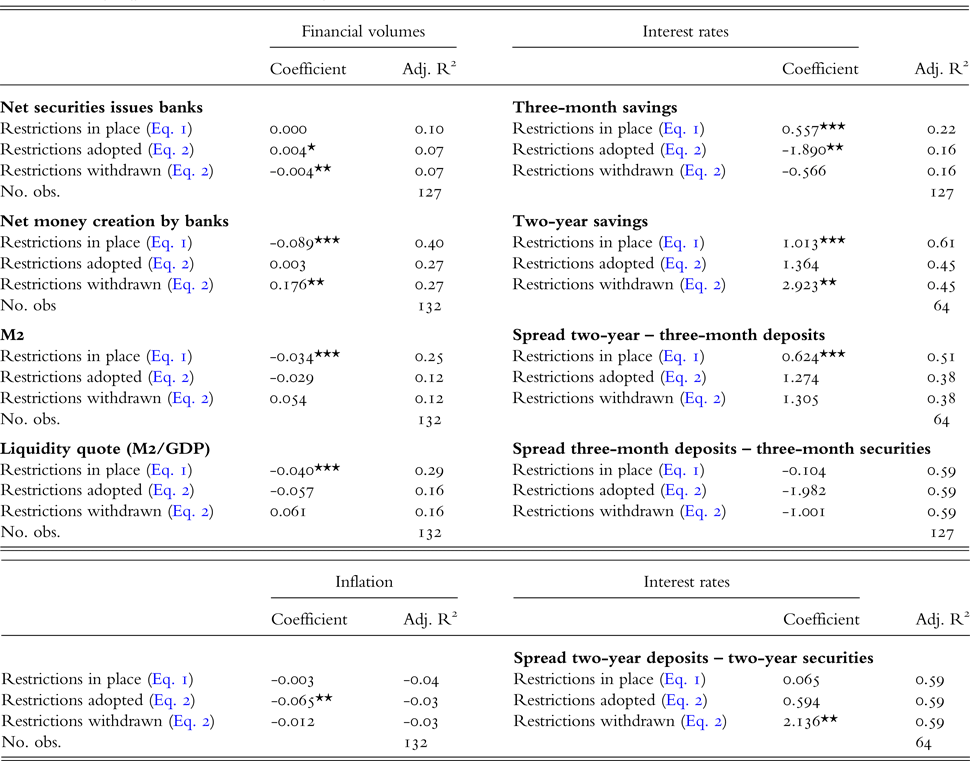
Table 3 presents the results for the impact of credit restrictions on net securities issuance, deposit rates, money growth and inflation, based on Equations (1) and (2).
Sum of coefficients on credit restrictions: inflation and other variables

Note: The table reports results for the sum of coefficients on credit restrictions from estimating Equations 1 and 2 with instrumental variables over the sample period indicated in Table 2. *, ** and *** indicate statistical significance at the 10, 5 and 1% level, respectively (Wald tests). No. obs.: Number of observations; Adj. R2: Adjusted R2; Eq.: Equation.
Net securities issues by banks – mainly bonds – increase following the activation of restrictions and decline after de-activation (Equation 2). This is in line with our finding below that banks respond to credit restrictions by switching to more long-term finance. Apparently, banks actively issued securities to adjust their funding structure in order to meet credit restrictions.
Next, we investigate the response of banks’ deposit interest rates, which are another potential instrument for banks to change their funding structure. One conjecture is that faced with credit restrictions, banks increase long-term deposit rates compared with short-term rates. Swank (Reference SWANK1994) presents evidence that deposit markets over the 1957–94 period were oligopolistic, which implies that banks had some pricing power. He also finds that banks raised interest rates on savings deposits when restrictions are in place, which may reflect that they indeed used this as a tool to increase long-term funding. Table 3 compares the responses of two-year and three-month savings rates. Both increase significantly when credit restrictions are in place – in line with Swank (Reference SWANK1994) – and the spread between both rates widens. However, the spread of both rates vis-à-vis government securities with corresponding maturities does not show any significant response for the three-month rate and a positive response for two-year rates after de-activation. This suggests that deposit rates largely moved in line with corresponding market rates and were not actively used by banks to change their funding structure. Overall, the evidence on whether banks used deposit rates to encourage their clients to switch to longer-term deposit is mixed.
Monetary aggregates show a negative response to restrictions in place (Equation 1). The response is most pronounced for net money creation by banks, which is most directly affected by the credit restrictions. But the broader aggregate M2 and the liquidity ratio also respond negatively, implying that monetary expansion was contained when credit restrictions were in place. This finding suggests that credit restrictions were an effective instrument of monetary policy over the period considered. This finding is in line with previous studies by Kuipers and Sterken (Reference KUIPERS and STERKEN1995) and Van Ees et al. (Reference VAN EES, STERKEN and GARRETSEN1999), which found a negative impact of credit restrictions on M2 and net money creation by banks, respectively.
We also consider the response of inflation to the credit restrictions. During credit restriction periods, inflation was not significantly different from periods when restrictions were not in place (Equation 1). This result differs from the finding of Holtrop (Reference HOLTROP1972), who studies the first experiences with credit restriction policies up to 1969 and finds that inflation gradually decreased during the restriction periods. However, we do find evidence that the activation of restrictions is followed by a decline in inflation, while de-activation has no significant impact (Equation 2). This suggests that the restrictions had a temporary impact in the intended direction.
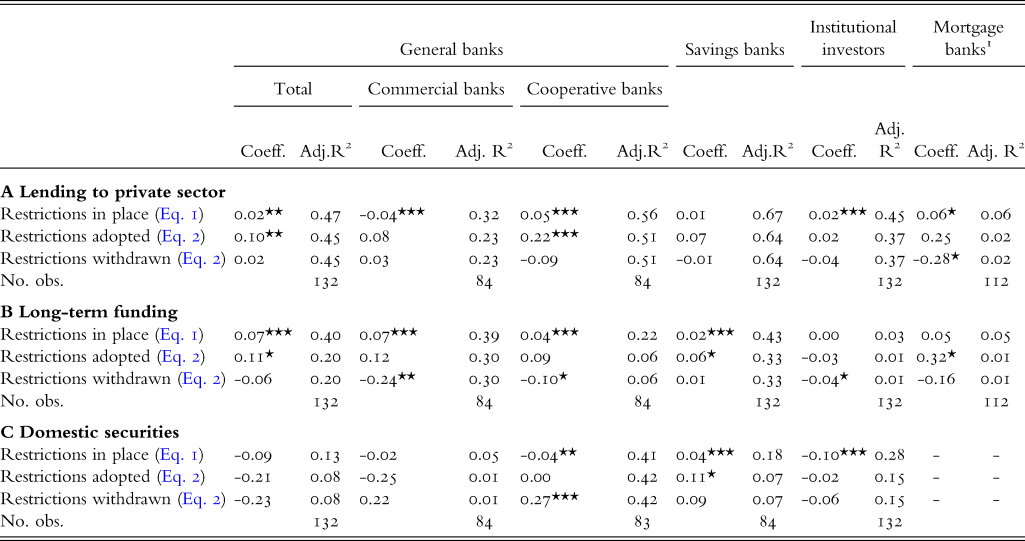
Table 4 presents further empirical results for Equations (1) and (2). Panel A reports the results for lending to the private sector. Interestingly, credit restrictions in place (Equation 1) have a significantly negative impact only on lending by commercial banks. For cooperative banks and institutional investors and mortgage banks, credit restrictions can even be associated with an increase in lending. By contrast, the impact of credit restrictions is insignificant for savings banks. Asymmetric responses to credit restrictions (Equation 2) can be observed for general banks and cooperative banks (only a significant increase in lending following an activation of credit restrictions) and mortgage banks (only a significant decrease in lending after a withdrawal of restrictions).
Sum of coefficients on credit restrictions: balance sheet variables

Notes: The table reports results for the sum of coefficients on credit restrictions from estimating Equations 1 and 2 with instrumental variables over the sample periods indicated in Table 2. For institutional investors and mortgage banks, credit restrictions refer to those on general and savings banks. *, ** and *** indicate statistical significance at the 10, 5 and 1% level, respectively (Wald tests). Coeff: Coefficient; No. obs.: Number of observations; Adj. R2: Adjusted R2; Eq.: Equation. 1 For mortgage banks, domestic securities holdings are negligible.
Panel B presents the results for long-term funding. It shows that when credit restrictions are in place, all types of banks subject to them – commercial banks, cooperative banks and savings banks – increase their long-term funding (Equation 1). Moreover, these responses are asymmetric (Equation 2), either because of a significant increase after activation of restrictions and no response after de-activation (general banks, savings banks), or because of a significant decrease after de-activation and no response after activation (commercial banks, cooperative banks). Institutional investors and mortgage banks do not significantly adjust long-term funding as a response to restrictions in place (Equation 1), although there is evidence of asymmetric responses (Equation 2).
Panel C presents the outcomes for securities holdings. We find evidence that securities holdings may have been adjusted in response to credit controls only for cooperative banks, as these significantly decline when restrictions are in place (Equation 1) and increase when restrictions are eased (Equation 2). Savings banks even increased their securities holdings when restrictions were in place. For the other types of banks, securities holdings do not show any significant response to credit restrictions. Institutional investors’ securities decline, which may have helped to facilitate their increase in lending supply.
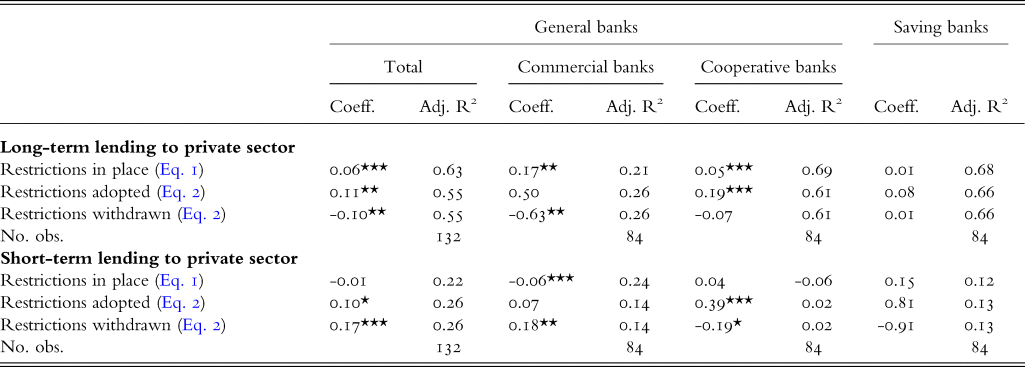
Table 5 presents a breakdown of lending into short-term and long-term loans. Results are only presented for general banks and savings banks, due to limited data availability of this breakdown for the other groups. Commercial banks’ reduction in lending in response to credit restrictions can be fully attributed to a decline in short-term loans, which account for more than half of their loans portfolio and can easily be scaled back due to their short maturities. Similarly, the positive response of cooperative banks’ lending is fully due to long-term loans.
Sum of coefficients on credit restrictions: further breakdowns lending and securities

Note: The table reports results for the sum of coefficients on credit restrictions from estimating Equations 1 and 2 with instrumental variables over the sample periods indicated in Table 2. *, ** and *** indicate statistical significance at the 10, 5 and 1% level, respectively (Wald tests). Coeff: Coefficient; No. obs.: Number of observations; Adj. R2: Adjusted R2; Eq.: Equation.
The above empirical results are robust to using a different set of macroeconomic control variables and other deposit interest rates.
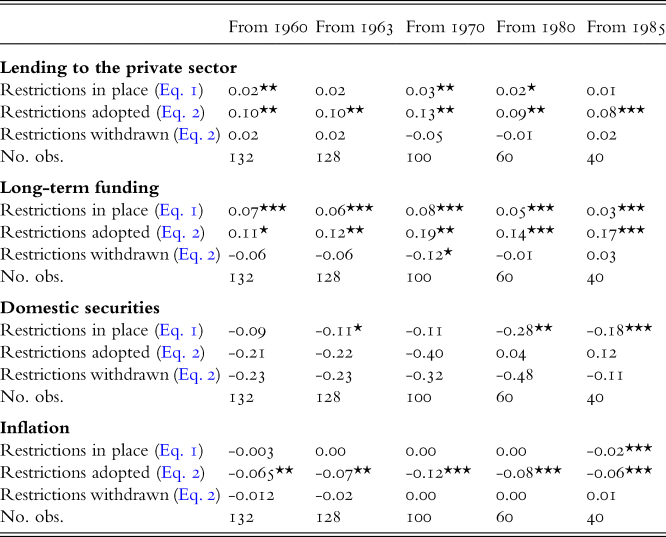
In addition, we repeated our analysis for different subperiods in order to investigate whether the results are stable over time. More specifically, we considered a sample starting in 1963 (skipping the initial years which may have been affected by the appreciation of the guilder in 1961), and samples starting in, respectively, 1970, 1980 and 1985. In general, the results are stable over time, also for the most recent period (see Appendix Table A4). This is remarkable given that credit restrictions were abandoned as a policy tool in the 1990s since they were no longer deemed effective. Indeed, as mentioned in Section II, DNB motivated the suspension of credit restrictions by referring to the fact that it was increasingly unlikely that the conditions for these policies would be met, rather than by the impact of the restrictions on inflation in the preceding years. The main focus had shifted to a policy of fixed exchange rates vis-à-vis the Deutsche Mark, which would bring inflation in line with the low German inflation rate (Berk and Winder Reference BERK and WINDER1994).
V
Several important findings stand out from our empirical exercise. One key finding is that most institutions subject to credit restrictions respond by adjusting the liability side of their balance sheet, rather than changing their assets. More specifically, commercial banks, cooperative banks and savings banks all shifted towards more long-term funding following the activation of a restriction. Banks increased net issues of securities, and there is some (albeit not fully conclusive) evidence that they changed deposit rates to encourage their clients to shift towards longer-term deposits.
Another key finding is that most categories of institutions did not respond to the restrictions by cutting back lending, the only exception being short-term lending by commercial banks. Lending by other banks and institutional investors even increased when restrictions were activated. Previous studies (Van Ees et al. Reference VAN EES, STERKEN and GARRETSEN1999; Swank Reference SWANK1994) also found that credit growth in the Netherlands did not respond significantly to a tightening of monetary conditions. Our analysis suggests that this aggregate non-response is the net result of heterogeneous reactions of lending by different financial groups.
Furthermore, we find limited evidence that financial institutions actively reduced their securities holdings to offset credit restrictions. There are indications for such behaviour only for cooperative banks. Van Ees et al. (Reference VAN EES, STERKEN and GARRETSEN1999) also conclude that banks do not use securities to deal with restrictions. Our finding is, however, in contrast with other studies which conclude that banks did use their securities holdings to absorb monetary policy shocks. In a qualitative survey by Swank (Reference SWANK1994), banks indicate that they are inclined to draw down their securities following the activation of restrictions. Garretsen and Swank (Reference GARRETSEN and SWANK1998) and Kakes (Reference KAKES2000) find evidence that banks use their securities to deal with monetary tightening. One way to reconcile these different findings is that banks may have used their securities as a liquidity buffer primarily in the more recent part of our sample (which is the focus of Swank Reference SWANK1994) or as a response to interest-based monetary policy (which is the focus of Garretsen and Swank Reference GARRETSEN and SWANK1998 and Kakes Reference KAKES2000).
Our findings differ from studies on credit controls in other countries, which conclude that restrictions reduce bank lending in the United States (Elliott et al. Reference ELLIOTT, FELDBERG and LEHNERT2013) and the United Kingdom (Aikman et al. Reference AIKMAN, BUSH and TAYLOR2016). One explanation may be that in these countries, particularly in the United States, credit controls were linked to gross rather than net lending, i.e. without taking into account long-term funding. While the UK ‘corset’ was linked to bank deposits and is therefore more comparable to Dutch credit controls, the Bank of England also imposed credit ceilings based on gross lending. In addition, Aikman et al. (Reference AIKMAN, BUSH and TAYLOR2016) note that the scope for leakage was small because nearly all credit was intermediated by institutions covered by the controls.
Overall, the results show a plausible pattern across groups. Commercial banks were likely to be most affected by the restrictions and also show the most pronounced response on both sides of their balance sheets. Cooperative banks and savings banks were, in principle, less sensitive to the credit controls and could more easily deal with them without significant balance sheet adjustments. In general, banks have been able to shield most of their loans portfolios, which supports the notion observed by previous studies that the Dutch credit market can be considered a customer market (Swank Reference SWANK1994; Van Ees et al. Reference VAN EES, STERKEN and GARRETSEN1999; Kakes Reference KAKES2000). Moreover, excess demand for loans was accommodated by non-bank lenders – particularly institutional investors – that were not subject to credit restrictions and increased their lending when restrictions were in place.
VI
Credit restrictions were used in the Netherlands from the 1960s to the early 1990s. We study the effects of credit restrictions on the behaviour of banks and other financial institutions. Our results suggest that banks responded by switching to long-term funding to facilitate credit supply and still meet the restrictions. Most categories of lending were not affected by credit controls, or even increased following the implementation of restrictions. Arguably, the restrictions were effective in reaching their main goal, i.e. containing money growth.
Our analysis points to interesting parallels with the recent experience with macroprudential instruments that work through bank balance sheets. As in the case of credit controls, banks may prefer to respond to such instruments by adjusting their funding structure (e.g. building a capital buffer) rather than cutting back lending, which could improve the stability of banks. Moreover, there can be substitution from banks to ‘non-treated’ financial institutions, as in the case of rising lending by institutional investors following credit controls. This further strengthens our finding that it is hard to slow down overall credit growth: to the extent that banks are not able to shield their lending business, non-banks are likely to step in. Note that such leakages may also thwart monetary authorities’ intended goal of dampening inflation through the use of credit restrictions.
Appendix A. Data sources and definitions
Financial firms’ balance sheet data (Table A1)
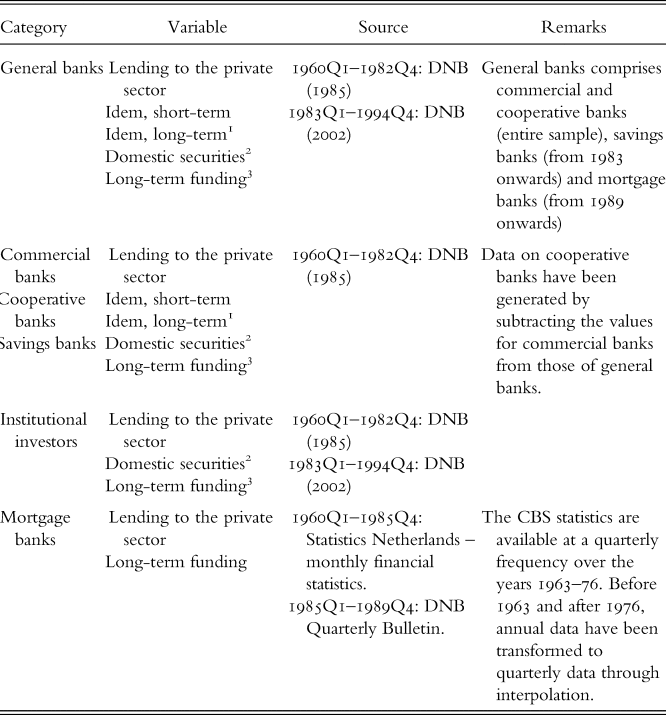
We use quarterly balance sheet data, aggregated by subsector. Data for general banks, commercial banks, cooperative banks, savings banks and institutional investors were taken from two ad hoc statistical publications by De Nederlandsche Bank (1985, 2003). Data for cooperative banks – also denoted as agricultural banks – were generated indirectly by taking the difference between general banks and commercial banks (commercial and cooperative banks together comprise general banks) for each variable. Statistical breaks due to changes in definitions have been removed by multiplicative corrections (in most cases, this is facilitated by the fact that the DNB publications documented the impact of a change in definitions by presenting one observation under both the old and the new definition).
Balance sheet variables

Balance sheet data for mortgage banks have been taken from several sources. For most of the period we consider, quarterly observations on mortgage and other lending were taken from a monthly publication by Statistics Netherlands, called Maandstatistiek van het Financiewezen. Other balance sheet variables are only available at an annual frequency and taken from Statistics Netherlands (various issues), as well as an ad hoc publication by DNB (2000); these annual data were translated into quarterly frequency using cubic spline interpolation. For observations since the early 1980s, we complemented the data with quarterly publications on mortgage banks by DNB that started in the 1980s.
Other time series (Table A2)
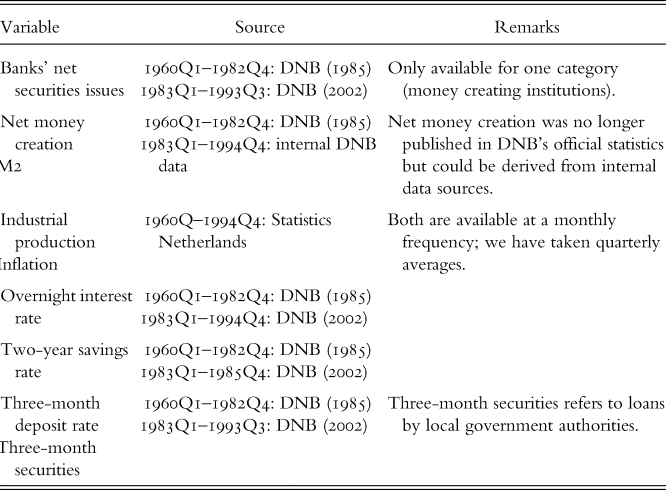
Data on financial firms other than balance sheet variables (debt securities issues, deposit interest rates) were taken from DNB (1985 and 2003). Macroeconomic data (industrial production, gross domestic product, consumer price index, market interest rates, liquidity ratio and money growth) were taken from DNB and Statistics Netherlands (various issues).
Other variables

Credit restriction data (Table A3)
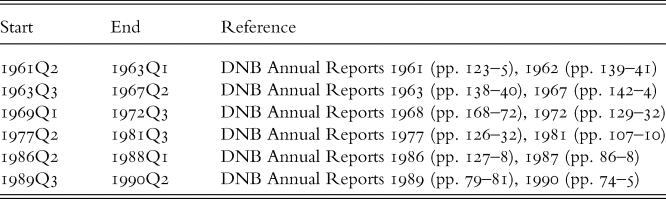
The credit restriction dummies are based on statements by DNB in its Annual Reports as well as on previous studies (De Greef et al. Reference DE GREEF, HILBERS and HOOGDUIN1998; Van Ees et al. Reference VAN EES, STERKEN and GARRETSEN1999). We do not make a distinction between types of credit restrictions or the institutions covered in specific years. As indicated in Section II, the modalities of the restrictions were changed frequently (quantitative versus price-based, formal versus informal), and the coverage was extended over time. Taking into account how the restrictions evolved may provide additional insights, but also makes the analysis more complex.
Restriction periods

The restriction dates are reported in Table A3. Note that we assume that the 1973–9 liquidity reserve regulation was never activated. This instrument actually implied liquidity requirements, but these were formulated at a ‘mild phase’ level, meaning that they were not binding for the banking system as a whole. The idea was that in times of excessive credit growth a ‘severe phase’ regime would be activated with stricter requirements. However, this regime was never implemented because of concerns that this would exert too much upward pressure on interest rates and the exchange rate.
Sum of coefficients on several variables: subsamples