I
Economic historians have generally taken a cautious view about the role of commercial banks and stock markets in the UK's economic growth during the period 1850–1913. A vast amount of capital was raised through the London Stock Exchange for domestic and foreign railways, as well as foreign firms and governments, but the same cannot be said about the exchange's contribution to domestic industry (Pollard Reference Pollard1985). Commercial banks were preoccupied with short-term lending for working capital expenditures, and their lending practices became increasingly conservative over time (Baker and Collins Reference Baker and Collins1999b). Nevertheless, historians have also argued that firms faced relatively few constraints on bank loans and long-term financing.Footnote 1
Our understanding of the UK's finance–growth nexus during 1850–1913 remains mired in ambiguity partially owing to the lack of econometric studies on the topic. This is surprising given that the relationship between the nation's financial sector and its economy has been a heavily debated issue among historians.Footnote 2 Econometric methods have helped researchers provide clearer insights into the role of financial intermediaries in other historical cases. For example, studies on nineteenth-century Germany, Sweden and Belgium have found a link between the growth of the financial sector and that of the economy.Footnote 3
Previous quantitative studies on the UK have focused solely on the role of banks in economic growth after 1870, completely excluding the stock markets from their models (Rousseau and Wachtel Reference Rousseau and Wachtel1998; D'Onofrio and Rousseau Reference D'onofrio and Rousseau2016).Footnote 4 This article is the first to study the role of the stock markets in UK economic growth during the period 1850–1913, while also exploring the banking sector's role during an earlier period than those focused on in previous econometric studies.
A significant limitation of many studies on finance and growth is that their empirical models assume a linear and continuous relationship between the financial sector and the economy, which can lead to inaccurate econometric results. British financial history for the period 1850–1913 suggests that this relationship is likely to have changed considerably as stock markets started listing more domestic industrial undertakings and as the banking sector expanded in size but became more risk-averse. Indeed, since the 1960s, the link between financial-sector development and economic growth has not been stable in developed countries (Rousseau and Wachtel Reference Rousseau and Wachtel2011). Recent evidence suggests that as a financial system becomes sufficiently large, its growth may become inconsequential for economic development (Law and Singh Reference Law and Singh2014). These findings are consistent with Gerschenkron's (Reference Gerschenkron1962) hypothesis regarding historical links between finance and growth, according to which richer countries (such as Britain from 1850 to 1913) would typically stand to gain less from financial development than less developed countries (such as imperial Germany).
This article uses recent developments in time series econometrics to test if stock markets or commercial banks contributed to UK economic growth from 1850 to 1913. Time-varying parameter vector autoregressive (TVP-VAR) models are able to account for potential changes in the relationship between finance and growth, and to factor in the ongoing structural change in the economy and the financial system. To obtain a suitable indicator for stock market development, a new dataset on the paid-in capital of securities listed on UK stock exchanges is used. Results from time-varying tests for parameter restrictions, as well as impulse response analysis, suggest that UK economic growth was not driven by financial development.
II
Economic theory points to several channels through which financial intermediaries contribute to economic growth. Levine (Reference Levine, Aghion and Durlauf2005) classifies these channels as follows: (1) mobilising and pooling of savings for productive projects; (2) providing information about potential investments, which leads to better capital allocation; (3) facilitating the management and diversification of risk, which encourages investment; (4) monitoring and improving corporate governance, which leads to more productive use of resources; and (5) reducing transaction costs by improving the payments system. These channels will be discussed below in conjunction with both the stock markets and the banking system.
The London Stock Exchange was the world's leading securities market throughout the period 1850–1913 (Michie Reference Michie1999, pp. 70–4, 88; Cassis Reference Cassis2006, pp. 83, 98). For most of these years, however, it was primarily a market for public debt and railway securities. In the mid 1880s, these two classes of securities accounted for over 90 per cent of the exchange's total paid-in capital – capital that firms and other entities had raised from investors (Michie Reference Michie1999, p. 88, table 3.2). Foreign entities constituted a growing share of new listings, driven in part by British investors’ demand for diversified portfolios (Chabot and Kurz Reference Chabot and Kurz2010; Chambers et al. Reference Chambers, Sarkissian and Schill2018). It was not until the 1890s that a significant number of domestic industrial companies started to be quoted on the exchange. The amount of capital that companies in this category had raised from investors rose from £173 m (or 12 per cent of UK GDP) in 1893 to £918 m in 1913 (43 per cent of GDP) (Michie Reference Michie1987, table 2.3).Footnote 5
In its capacity as a primary market, the London Stock Exchange thus played a limited role in mobilising capital for domestic investment for most of the period under consideration, although it may still have contributed to the economy in this fashion during 1890–1913. One reason for the comparatively low number of listings by domestic companies was that before World War I, smaller British commercial enterprises primarily raised capital through informal channels, such as the owners’ personal contacts (Michie Reference Michie1987, pp. 107–11). Companies that needed external capital from the stock markets – especially as they grew larger – generally found it forthcoming (Michie Reference Michie1985; Watson Reference Watson, Cassis, Feldman and Olsson1995). It is thus possible that a lack of demand was the primary culprit behind the small amount of industrial capital raised through the stock markets before the 1890s (Cottrell Reference Cottrell, Floud and Johnson2004).
Despite the limited reliance of domestic industrial firms on the stock market for much of the period, there are several other channels through which the British stock exchanges may have contributed to economic growth. The core function of a stock exchange is to provide a secondary market for securities, not to raise new capital (Rousseau and Wachtel Reference Rousseau and Wachtel2000).Footnote 6 Secondary markets can play an important role in encouraging entrepreneurship, because they make it easier for successful entrepreneurs to sell parts of their companies onwards (Rousseau and Sylla Reference Rousseau and Sylla2005). For the larger firms listed on the British stock exchanges, these institutions could have reduced the cost of capital by increasing the liquidity of their shares. This is because securities markets facilitate trading claims on projects which require a long-term commitment of capital, while at the same time making it easier for investors to construct diversified portfolios, thereby encouraging savers to allocate more of their funds to riskier projects.Footnote 7 Moreover, theoretical literature on finance and growth suggests that securities markets can make it easier for groups of investors to monitor and instil discipline in company directors, thus improving corporate governance and, ultimately, the efficiency at which capital is deployed in an economy.Footnote 8
It is in performing functions other than raising capital and increasing the liquidity of shares that the markets did suffer from some institutional weaknesses. The UK had little legislation for the purposes of protecting investors before World War I. Minority shareholders could not sue a company's management for the misappropriation of resources, and financial disclosure requirements of publicly traded companies were largely voluntary before 1900 and were very limited throughout the rest of the pre-World War I period (Franks et al. Reference Franks, Mayer and Rossi2009). These factors made it difficult for investors to evaluate potential investments and to monitor a company's performance, thus diminishing the capital markets’ contribution to better corporate governance (Hannah Reference Hannah2007).
As largely self-regulating organisations, the London Stock Exchange and other UK exchanges could themselves impose rules to make up for the limitations of existing legislation (Neal and Davis Reference Neal and Davis2006). Listing on the London Stock Exchange could be done through a special settlement – an unregulated form – or through an official quotation, in which case the exchange outlined various requirements for an initial public offering (IPO). These requirements were intended to ensure a less concentrated ownership structure and better financial disclosure practices, both of which might have improved corporate governance. Indeed, the overall failure rate of London IPOs during 1900–13 was similar to that found on modern stock markets, but the failures of unregulated IPOs – the majority of new issues – was high, and their share price performance was typically poor (Burhop et al. Reference Burhop, Chambers and Cheffins2014). In this sense, a lack of shareholder protection did indeed have negative consequences for capital allocation, although stock exchange regulations were able to mitigate the issue. The public may have become reluctant to finance mainly smaller firms due to the difficulty of evaluating their prospects, because such firms were especially reliant on unregulated IPOs. Public mistrust of domestic industrial issues was further increased by fraudulent practices in company promotion that was made possible by the prevailing legislation (Armstrong Reference Armstrong, Van Helten and Cassis1990).
Despite weak legal protection of shareholders, widespread share ownership in Victorian Britain suggests that there were factors which made investors sufficiently confident to invest in shares (Acheson et al. Reference Acheson, Campbell, Turner and Vanteeva2015). One of these factors was the practice of companies paying most profits as dividends, which provided investors with an easily observable measure of a firm's performance that could not be manipulated over prolonged periods of time, and which left managers with fewer resources to misappropriate (Campbell and Turner Reference Campbell and Turner2011). Additionally, in their articles of association, firms often granted shareholders rights that went beyond what was required by law. These regulated the extent to which shareholders were provided with financial reports, and which matters they could vote on, as well as setting limitations on insider dealing (Acheson et al. Reference Acheson, Campbell and Turner2016). Such measures may thus have allowed the stock markets to improve corporate governance despite weak shareholder protection afforded by the legislation. Whether these factors were sufficient to enhance economic growth more broadly has remained unclear.
The UK commercial banking system expanded rapidly in the late nineteenth century, as several legal obstacles to its growth had been removed by the 1860s. Yet the influence of an earlier legislative and institutional framework lingered well into the 1880s. Restrictions on the formation of joint-stock banks before 1826, along with relatively high barriers for doing so during 1844–58, meant that the English and Welsh banking sector continued to be composed of many small banks with relatively few offices into the 1870s (Collins Reference Collins1983, pp. 9–10). It was not until the 1880s, after several mergers and acquisitions, that banks with national branch networks started forming. The Scottish and Irish banking systems, operating under more permissive legislation, had become consolidated considerably earlier (Munn Reference Munn1988).
UK commercial banks focused on short-term lending and facilitating payments between parties. Therefore, they did not contribute directly to capital investment in the economy. Instead, one of their important economic functions was to improve the efficiency at which working capital was allocated, as highlighted by Baker and Collins in a series of contributions. Banks would typically roll over their loans, which rendered it easy to gather new information about customers at frequent intervals. This also reduced agency problems, as customers had to repeatedly prove that loans were used for productive purposes (Collins and Baker Reference Collins and Baker2003, pp. 251–2). By lessening risks arising from agency problems, rolling over short-term loans also made it possible to lend to a wide range of customers – even riskier ones – while offering flexible loan terms if problems arose (Baker and Collins Reference Baker and Collins1999a). By financing working capital, banks also functioned as the main liquidity providers to a wide range of clients. By reducing the need for firms to maintain unproductive cash buffers through making short-term credit easily available, banks could contribute to the productive allocation of resources in the economy.Footnote 9
The growth of branch networks in the late nineteenth century reduced the average distance between borrowers and lenders, which may have further reduced agency problems arising from information frictions. Today, closer proximity of banks to their customers translates into more efficient allocation of capital in an economy, and lower costs of credit to borrowers, as banks incur lower costs in evaluating and monitoring nearby borrowers (Degryse and Ongena Reference Degryse and Ongena2005; Hollander and Verriest Reference Hollander and Verriest2016). In a similar vein, banks may have improved the allocation of short-term funds by being able to substitute collateral requirements for improved information gathering, which today is an important mechanism through which financial intermediaries contribute to the productive use of resources (Holmström and Tirole Reference HolmstrÖm and Tirole1997).
The historical literature points to several shortcomings of the British banking sector, besides its lack of long-term lending, which may have lessened its contribution to economic growth. Commercial banks during the period 1850–1913 were conservative: as banks became larger, they progressively reduced the share of their assets used for non-bank private-sector lending, and their lending practices became more rigid (Collins and Baker Reference Collins and Baker2001; Newton Reference Newton1996). Moreover, a high degree of concentration and low competitive pressures in the banking industry may have led to inefficiencies in bank operations, particularly in the allocation of credit (Grossman Reference Grossman1999). Recent evidence suggests that banks in English and Welsh counties with less banking-sector competition constrained their lending (Braggion et al. Reference Braggion, Dwarkasing and Moore2017).
Despite these shortcomings, there is little evidence of significant constraints on commercial bank credit for firms on a more general level, as loans were generally easy to obtain (Capie and Collins Reference Capie and Collins1999). Notwithstanding the evidence that banking-sector concentration led to some instances of local credit constraints, banks rejected a rather small percentage of loan applications (Capie and Collins Reference Capie and Collins1996).Footnote 10 At the same time, banks were able to lend to a wide range of clients primarily because they took a transactional approach to customer relationships, coupled with increasingly liquid loan portfolios (Baker and Collins Reference Baker and Collins2002). The commercial banks’ contribution to macroeconomic growth thus remains ambiguous.
III
A large number of empirical studies based on post-World War II data have found evidence of a relationship between financial development and economic growth. The effect appears to be causal: financial intermediaries tend to contribute to economic growth, not vice versa.Footnote 11 In this modern context, financial intermediaries tend to boost growth primarily through improving resource productivity, while the evidence for intermediaries contributing to capital accumulation is weaker. This is particularly the case in more developed countries, where financial intermediaries play an important role in allocating funds to the most productive firms, and by improving corporate governance (Rioja and Valev Reference Rioja and Valev2014).
Econometric studies on historical links between banking and growth have concentrated largely on Germany, Sweden, Japan and the US. They tend to suggest that the financial sector influenced economic growth.Footnote 12 In Germany, banks played a significant role in economic growth in the late nineteenth century, although the impact of joint-stock banks – often credited with helping Germany modernise – appears more muted (Burhop Reference Burhop2006; Diekmann and Westermann Reference Diekmann and Westermann2012). In fact, Diekmann and Westermann argue that banks primarily influenced the growth of the service and agricultural sectors, whereas equity finance was central to the growth of the industrial sector. The underlying reasoning behind this argument is that large firms became increasingly reliant on capital markets for their financing needs, while smaller firms relied on banks. These findings support this article's empirical approach, whereby both banks and stock markets are included in an econometric model, because these institutions may have contributed to economic growth in different ways.
Rousseau and Wachtel (Reference Rousseau and Wachtel1998) use time series methods to study the economic impact of the banking system's growth in the UK.Footnote 13 The authors find evidence of finance-led growth from 1880 to 1929, but their econometric approach is problematic. Their Granger causality test may not be robust when applied to non-stationary series, and they do not adequately control for the stock markets or the distortion caused by World War I. Thus, the UK finance–growth nexus certainly needs further econometric research. Moreover, the analysis should be extended to the pre-1870 period.Footnote 14
The econometric literature on how stock markets influenced historical economic growth is still in its infancy. Time series evidence suggests that stock markets have contributed to historical economic growth in Belgium and the US.Footnote 15 Similarly, the Berlin Stock Exchange played a significant role in the financing of innovative firms before World War I, indicating that it had a positive role in the modernisation of the German economy (Lehmann-Hasemeyer and Streb Reference Lehmann-Hasemeyer and Streb2016). Stock markets may also have indirectly contributed to economic growth through supporting the growth of the banking sector. For example, Rousseau (Reference Rousseau2011) argues that expansion of the banking system in New York during 1866–97 can be partially attributed to share prices revealing information about the soundness of individual banks. Banks were a significant component of British stock exchange listings, which further demonstrates the need to examine the economic impact of stock markets and banks jointly.
Economists have recently taken a more nuanced view of the link between finance and growth. An important advancement in several recent studies is to examine non-linearities in this relationship, which few historical studies have factored in. The strength of the finance–growth nexus tends to depend on a country's degree of economic development: between 1960 and 1995, financial development has had a larger impact on the economic growth of poorer countries (Aghion et al. Reference Aghion, Howitt and Mayer-Foulkes2005). This is because more financial development (measured by private credit to GDP) helps countries to catch up more rapidly with the income levels of rich countries. The positive contribution of finance weakens as convergence occurs. Moreover, poorer countries tend to catch up with richer countries in their level of financial development, and this tends to occur jointly with catch-up economic growth (Fung Reference Fung2009). Such findings have a degree of consistency with Gerschenkron's (Reference Gerschenkron1962) hypothesis, which posits that finance can be particularly helpful in catch-up growth, whereas the most developed countries benefit less from a large financial sector. In the case of the UK from 1850 to 1913, these findings imply that, as the leading economy, the country may have stood to gain less from financial development than less developed countries.
Following the Great Recession, the view that financial development is important for growth has come under even more scrutiny. New evidence suggests that after a certain point, the financial sector's expansion becomes inconsequential, or even a drag, on economic performance (Law and Singh Reference Law and Singh2014; Arcand et al. Reference Arcand, Berkes and Panizza2015). This occurs partially because the impact of financial instability tends to be more severe when the financial system itself is large. Additionally, economies where credit grows too rapidly can be more prone to financial crises (Schularick and Taylor Reference Schularick and Taylor2012). The link between finance and growth has also weakened since the 1990s, partially because the most restrictive regulations governing the availability of finance had been abolished by then in many developed countries (Rousseau and Wachtel Reference Rousseau and Wachtel2011). Empirically, less severe constraints on finance should show up as a more tenuous relationship between financial and economic development.
In light of this evidence, allowing for the possibility of a changing relationship between the financial sector and the economy is important when it comes to statistical inference. Indeed, recent studies on the economic impact of financial shocks have demonstrated that the link between financial and economic conditions varies substantially over time (Bijsterbosch and Falagiarda Reference Bijsterbosch and Falagiarda2015; Gambetti and Musso Reference Gambetti and Musso2017). Simpler econometric models may thus lead to misleading inferences about the link between finance and growth.
IV
The empirical literature on finance and growth has not reached a consensus on which indicator for financial development should be used. Traditionally, proxies for the size of the banking sector (for example, broad money, deposits, private-sector lending) or the stock market (market capitalisation, transaction volumes) have been used. These indicators say little about how efficient the financial sector was in allocating resources and mitigating information asymmetries (Ang Reference Ang2008). Nevertheless, in post-World War II data, proxies of the financial sector's size tend to correlate with other measures of financial development, such as access to finance, or the financial sector's cost-efficiency in providing its services (Čihák et al. Reference ČihÁk, DemirgÜČ-Kunt, Feyen and Levine2013). The availability of data for the pre-World War I years, moreover, limits the set of indicators that can be used. This study therefore follows much of the existing literature in terms of the proxies used for financial development. These are outlined below.
The GDP data in this article are from Solomou and Weale (Reference Solomou and Weale1991) for the years 1870–1913. This series has been linked to estimates by Feinstein (Reference Feinstein1972) covering the years before 1870, and converted into real terms (in market prices) by Thomas and Dimsdale (Reference Thomas and Dimsdale2017).Footnote 16 To convert the financial data into real terms, I use the price index compiled by O'Donoghue et al. (Reference O'donoghue, Goulding and Allen2004). Before 1850, the available GDP data are highly conjectural, which, together with the limitations of early nineteenth-century financial-sector data, contributes to determining the start year of the empirical study.
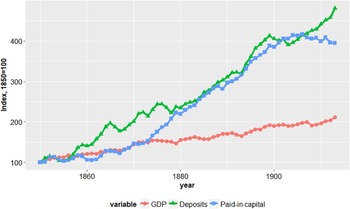
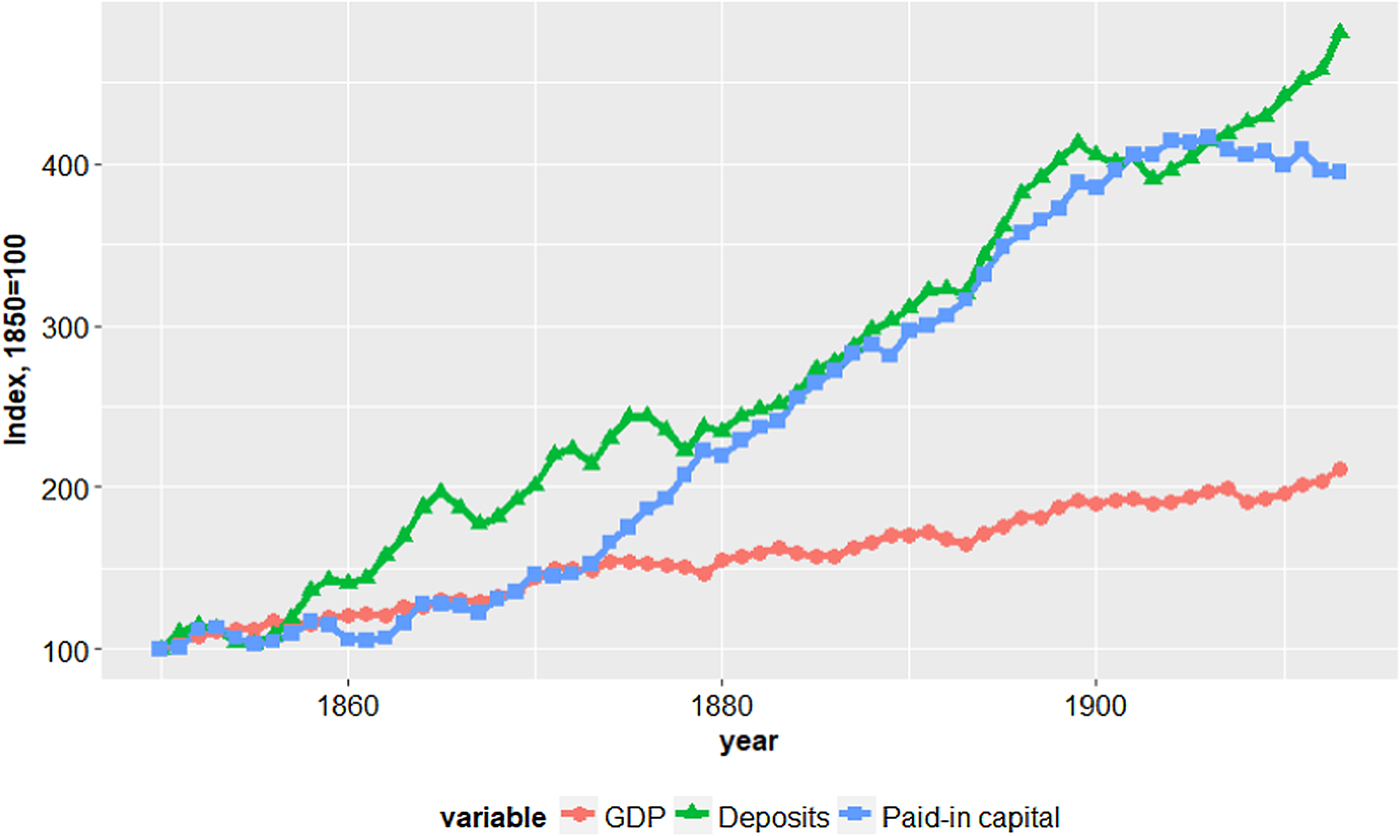
Figure 1 shows the yearly stock market and deposit data used in this study, which are discussed below. As the historical literature suggests, the paid-in capital of domestic firms expanded significantly throughout the period 1850–1913, with especially strong growth from the 1880s onwards. The composition of this expansion changed over time, however, with companies in sectors other than railways, infrastructure and finance starting to account for an increasing portion of the growth in the last 30 years of the sample (Michie Reference Michie1999, p. 88). The stock of deposits grew at a significant rate already significant in the 1860s and 1870s, although noticeable fluctuations can be observed during the Overend and Gurney crisis of 1866 and the failure of the City of Glasgow Bank in 1878.
GDP, deposits and paid-in capital
I use deposits as the primary indicator for the development of the banking system. Comprehensive figures on UK bank deposits from 1870 to 1913 are available in statistics compiled by Capie and Webber (Reference Capie and Webber1985). This series has been combined with earlier, slightly less comprehensive data running from 1850 to 1870 (discussed below), so as to obtain a continuous series from 1850 to 1913. This is done through backwards extrapolation of the later series by applying the growth rate of the earlier series. Note that the series is examined using econometric models that yield unbiased estimates for the years for which the data are the most accurate (1870–1913), even though the pre-1870 part of the sample might contain inaccuracies. Note also that the data in the econometric examination are in differences, whereby splicing series together does not significantly influence the results.
Estimates of English and Welsh banks’ net public liabilities for the years 1844–80 have been constructed by Collins (Reference Collins1983), who extrapolated the average amount of net liabilities per bank office from a sample that covers 40–60 per cent of English and Welsh bank offices. He assumed that banks outside his sample had the same amount of liabilities per office as the banks in his sample. While this series includes notes issued by commercial banks, deposits are by far the largest component of net liabilities. During 1866–70, for example, the ratio of commercial bank notes to deposits was 2 per cent. A downside of the figures compiled by Collins is that they are smoothed, presumably to reduce a high degree of variability that the series would display otherwise.
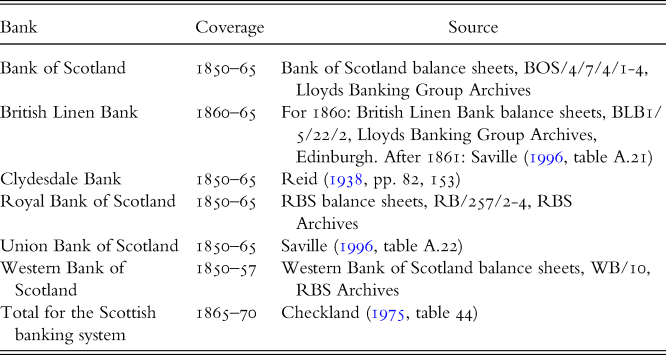
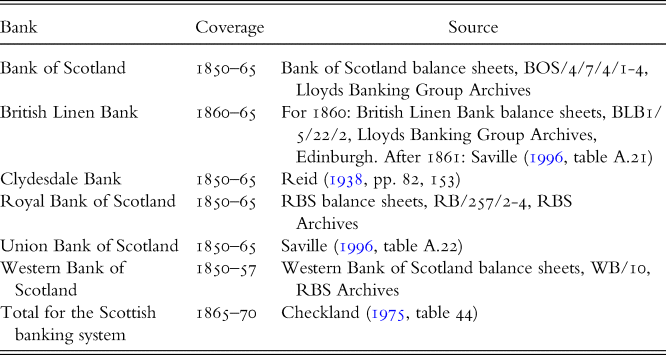
To make the pre-1870 series cover the UK as a whole, and thus to make it consistent with the GDP data, Scottish and Irish data on bank public liabilities are included in the sample.Footnote 17 Checkland (Reference Checkland1975) provides comprehensive data on Scottish bank public liabilities from 1865 to 1870. From 1850 to 1865, corresponding figures are constructed from the balance sheets of individual banks, with data collected from both published sources and archival records. The included banks are listed in the Appendix, Table A1. These earlier figures on Scottish banks are spliced with data provided by Checkland. Data on Irish bank deposits are available from O'Rourke (Reference O'rourke1998).
Bank deposits are an indicator of the amount of resources that banks had available, but they say little about the way in which these funds were allocated. Hence, the implicit assumption in this article is that banks’ ability to provide credit to the economy, along with their efficiency in allocating credit, was proportional to deposits. There is not much choice of alternative proxies for the banking system, given the scarcity of data for the UK pre-World War I. Data on pre-World War I UK bank credit, which would be a useful indicator, are available for only a short period, covering the years 1880–1913 (Sheppard Reference Sheppard1971).Footnote 18 The short credit series is unsuitable for this article's econometric approach, as results based on it would be highly inaccurate. Broad money aggregates, meanwhile, have fallen out of favour as indicators of banking-sector development, as they needlessly confound measures of monetisation with measures of financial development (Levine Reference Levine, Aghion and Durlauf2005).
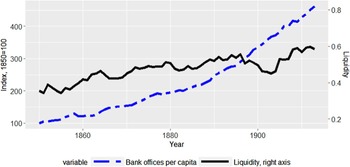
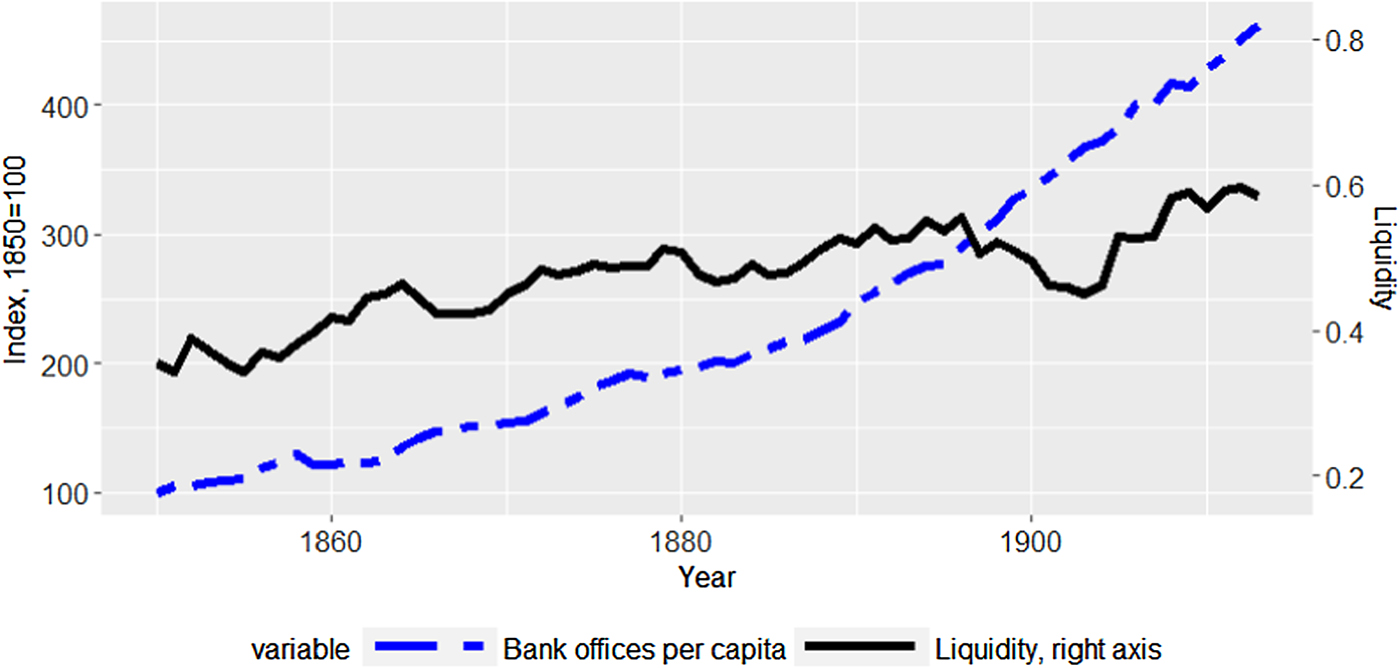
The best available alternative indicator used for robustness testing is the number of bank offices per capita. As discussed above, the proximity of bank offices can play a significant role in the cost and availability of loans, because lenders located near their customers find it easier to evaluate their creditworthiness. The indicator can thus be thought of as a proxy for the degree to which banks are able to overcome information asymmetries inherent in lending. These data have been collected from the Banking Almanac for the years 1850–69, and from Capie and Webber (Reference Capie and Webber1985, Appendix, table Aiv) for the years 1870–1913. The data are plotted, together with an indicator of liquidity (described below) in Figure 2.
Data for robustness tests: liquidity and branches per capita
A key contribution of this article stems from the use of new data on the development of the UK's capital markets. There are no satisfactory pre-existing proxies for this. Intuitively, one might expect that the market capitalisation of stock exchanges in the UK gives an indication of how the financial markets developed, but this is not a suitable indicator to use in a time series econometric context. Stock market valuations are forward-looking: they partially reflect investor expectations of future economic conditions. Even in a historical context, market valuations have tended to carry predictive power regarding subsequent economic growth (Sarferaz and Uebele Reference Sarferaz and Uebele2009). Using such data in an econometric model would thus unduly bias the results in favour of the finance-led growth hypothesis (Ang Reference Ang2008). Furthermore, yearly fluctuations in market valuations are unlikely to provide an accurate proxy for how well capital markets function.
I use a new series on the growth of paid-in capital as an indicator of the development of capital markets. This measure has previously been used in the historical finance–growth literature (Diekmann and Westermann Reference Diekmann and Westermann2012). Paid-in capital tells us how much capital has been raised or converted into public securities through stock markets. The econometric examination relies on paid-in capital in differences, which measures the net amount of new capital raised each year. This differenced series is thus a proxy for the functioning of the primary markets. As a measure for the growth of capital markets, paid-in capital has the advantage of being less sensitive to changes in investor expectations than market capitalisation.Footnote 19
Grossman (Reference Grossman2015) provides a yearly series of paid-in capital of British equities before World War I but his data leave out preferred shares and debentures (fixed-income securities). This article's dataset improves upon his work by including these two classes of securities, so that the amount of capital raised by the market is not understated.Footnote 20 This is important, because a significant amount of capital, even for industrial companies, was raised in the form of fixed-income securities (Rutterford Reference Rutterford2006). The series used here consists of yearly averages of monthly figures, which makes it a more accurate proxy of year-on-year capital market development. Moreover, the dataset for the years 1870–1913 includes securities listed on provincial stock exchanges (exchanges outside London).
The underlying data on paid-in capital come from the Investor's Monthly Manual (IMM), which is hosted at the Yale International Center for Finance (YICF).Footnote 21 The dataset based on the IMM covers the years 1870–1913 and includes information on most securities listed on stock exchanges in the UK.Footnote 22 It consists of over 1.3 million rows of data – one row for each security per month that it was listed, giving information on several features related to that security. Paid-in capital is calculated by multiplying the number of outstanding shares with paid-in capital per share. The raw data from YICF are not fit for use, because they contain several inaccuracies due to the optical-character-recognition software used to digitise the tables from the IMM, as well as errors in the IMM itself. How the data were made usable is explained below.
The data were cleaned up in two stages. First, the errors occurring through the digitisation of the IMM were detected and corrected. There were thousands of entries marked as ‘unreadable’ or where the numbers were mixed up. The fact that a number was wrong could be detected as a temporary discontinuity in a security's paid-in capital. The true value of paid-in capital could then be manually checked from a copy of the IMM. There were also hundreds of missing entries for certain years.Footnote 23 These cases would also show up as discontinuities in the series, which could be detected and then corrected. When months of data were missing, figures from copies of the IMM were used.
The second step was to correct for inaccuracies in the IMM itself, which was more problematic.Footnote 24 There are hundreds of cases where the paid-in capital per share or the number of shares of a given security are left blank for an extended period. There are also several cases where a security is only included in the IMM data well after its IPO, or when a security is removed without explanation. Although there is no guarantee that all of these types of errors were found, a significant number were cross-checked with the Economist, as well as the Stock Exchange Yearbook. Furthermore, the IMM itself lists details of new issues in a separate section of the publication, which could be compared to the figures in the database.
For years prior to 1870, there are no accurate data on the listings on all stock exchanges in the UK. The best available series on paid-in capital for these years is provided by Acheson et al. (Reference Acheson, Hickson, Turner and Ye2009). While providing a comprehensive set of data for the London Stock Exchange, a downside of this series is that it excludes provincial exchanges. This exclusion might introduce a degree of measurement error in the underlying data before 1870, which is difficult to adjust for given the limited amount of surviving information from provincial exchanges. However, it should be noted that several provincial stock markets saw subdued activity for at least two decades following the end of the Second Railway Mania in 1846, so the measurement error induced by their exclusion is unlikely to be large (Killick and Thomas Reference Killick and Thomas1970). As will be explained below, the methodology employed in this study also mitigates issues with bias that may exist in the earlier part of the sample.
Certain exclusions from the stock exchange data are warranted when the objective is to examine the impact of capital markets on growth. It is difficult to justify, in theory, why portfolio investment in foreign stocks should have a significant impact on the domestic economy through increasing investment and productivity or improving corporate governance. Hence, foreign companies, or those which conducted most of their activities abroad, are excluded. In doing this, I follow the approach of Nieuwerburgh et al. (Reference Nieuwerburgh, Buelens and Cuyvers2006), who identified and removed foreign firms, or firms operating abroad, when testing the Belgian stock market's impact on the economy. I also follow the literature by excluding public-sector debt securities, which might needlessly distort the underlying series by rendering it less informative about the extent to which the private sector was served by the capital markets (Ang Reference Ang2008).
The first step in the process of removing foreign securities followed the approach of Grossman (Reference Grossman2002), which entailed removing all securities denominated in foreign currencies, and identifying foreign companies by name. More accuracy was then gained by cross-referencing the names of suspected foreign companies with issues of the Economist and the IMM, both of which often provided information about a new issue when it was listed.
To test the robustness of my results, I use a measure of liquidity, plotted in Figure 2. Liquidity proxies have been used in previous studies as indicators of the ease of trading on stock markets, and can thus more accurately measure the functioning of secondary rather than primary markets (Beck and Levine Reference Beck and Levine2004). Direct measures of turnover are not available for the period 1850–1913. Therefore, I follow the zero-return-based approach of Lesmond et al. (Reference Lesmond, Ogden and Trzcinka1999). This indicator is based on the number of months in a year when a security's returns were zero (which often means that it was not traded), which is then averaged across all securities for a given year. This measure has been shown to be a useful and informative indicator of liquidity in modern stock markets (Goyenko et al. Reference Goyenko, Holden and Trzcinka2009).
The liquidity measure for the years 1870–1913 is calculated based on the IMM data hosted at YICF, as described above. For years preceding 1870, it is backwards extrapolated using the equal-weighted liquidity measure for equities on the London Stock Exchange by Campbell et al. (Reference Campbell, Turner and Ye2018), which follows the same zero-returns methodology. Campbell et al. also show that this liquidity measure is correlated with the bid–ask spreads of a set of securities during 1855–70, thus validating its use. To ensure consistency with Campbell et al., the measure for 1870–1913 is based on equities and not fixed-income securities. Basing the measure on equities is advantageous, because it leaves the liquidity measure unaffected by changing ratios of bonds to equities listed on the British stock markets.
V
Time series models used in several previous studies on finance and growth assume that the relationship between finance and the economy is stable over time (Beck Reference Beck, Mills and Patterson2009). This assumption is restrictive in the case of the UK during the period under consideration, because as the literature review above indicates, the financial system underwent considerable changes from 1850 to 1913. The relationship between banks and the economy may thus have been very different in, say, 1900 compared to 1870. The findings from structural break tests reported in the Appendix also suggest that there were several non-linearities present in the underlying data. A changing relationship between finance and economic growth should also be expected in light of the empirical studies reviewed above, showing that the effect of finance on growth tends to weaken as countries become more developed. To factor in time-varying linkages between finance and growth, a novel econometric approach is needed.
A commonly used multivariate time series tool for testing linkages between finance and growth has been the vector autoregression (VAR), which is especially useful for testing hypotheses in a country-specific setting (Beck Reference Beck, Mills and Patterson2009). The VAR approach has the benefit of needing few a priori restrictions on how the data should behave, making it less likely that results are driven by potentially implausible constraints imposed on a model.
The VAR model can be extended to allow for time-varying relationships between variables of interest. VAR models with time-varying parameters (TVP-VARs) have become widely used tools in empirical macroeconomics following the contributions by Primiceri (Reference Primiceri2005) and Cogley and Sargent (Reference Cogley and Sargent2005). This approach has been applied to historical data to study monetary policy, the macroeconomic impact of financial shocks, and the drivers of inflation, among other topics in macroeconomic dynamics.Footnote 25 Because it allows for time-varying relationships, the TVP-VAR has a better forecasting performance than several other commonly used econometric models (D'Agostino et al. Reference D'agostino, Gambetti and Giannone2013).
Consider the time-varying parameter VAR with ρ lags and N variables, representing different macroeconomic time series:
 $${{\bi y}_t = {\bi \mu }_t + \mathop \sum \limits_{i = 1}^\rho {\bi B}_{i,t}{\bi y}_{t-i} + {\bi \nu }_t } $$
 $${var\left( {{\bi \nu }_t} \right) = {\bi R}_t }$$
The vector yt contains the observations of the N macroeconomic or financial series at time t. In the baseline specification, it includes paid-in capital, deposits, and GDP: yt = [paidinK t, depositst, GDPt]′ in real per capita log-differences. μ t are time-varying constants, and the N × N matrix B i,t contains VAR parameters to be estimated for lag i. Note the subscript t, which means that at each time t, the parameters are allowed to change. In an ordinary VAR with static parameters, this subscript would not exist. ν t are error terms and Rt contain the variances of the errors.
The model allows for the variance of the error terms to change over time (referred to as stochastic volatility). This makes the model inferences more precise, as it does not confound macroeconomic instability with changing relationships between economic indicators (Primiceri Reference Primiceri2005). The time-varying covariance, embodied in Rt, is decomposed as follows:
 $${{\bi R}_t = {\bi A}_t^{-1} {\bi H}_t{\bi A}_t^{-{1}^{\prime}} }$$
At is a lower triangular matrix with ones on the diagonal, which governs the contemporaneous relationships between the error terms. In the trivariate case:
 $${\bi A}_t = \left[ {\matrix{ 1 & 0 & 0 \cr {a_{21,t}} & 1 & 0 \cr {a_{31,t}} & {a_{32,t}} & 1 \cr } } \right] \;{\rm and} \; {\bi H}_t = \left[ {\matrix{ {h_{1,t}} & 0 & 0 \cr 0 & {h_{2,t}} & 0 \cr 0 & 0 & {h_{3,t}} \cr } } \right]$$
Define  ${\bi \beta }_t $ as a stacked vector of all the coefficients, such that
 ${\bi \beta }_t = vec\left( {\left[ {{\bi \mu }_t,\; {\bi B}_{1,t}...{\bi B}_{\rho ,t}\; } \right]\; } \right)$.Footnote 26 The dynamics of the parameters can then be summarised as follows:
 $${{\bi \beta }_t = {\bi \beta }_{t-1} + {\bi e}_t;var\left( {{\bi e}_t} \right) = {\bi Q} } $$
 $$\matrix{ {ln\left( {h_{i,t}} \right) = ln\left( {h_{{\bi i},t-1}} \right) + z_{i,t};var\left( {z_{i,t}} \right) = w_i} } $$
 $$\matrix{ {a_{ij,t} = a_{ij,t-1} + \upsilon _{i,t};var\left( {\upsilon _{i,t}} \right) = s_i} } $$
for all i and j.
The equations say that all parameters are assumed to evolve as random walks: they are determined by their own past values and a random process. The matrix Q determines the degree to which the coefficients can vary. The variances w i and s i determine how much the error variances and covariances can change over time.
The model is estimated using Bayesian methods, which are especially useful in the presence of a large number of parameters, as they provide a natural approach for achieving shrinkage for the possible parameter values. Primiceri (Reference Primiceri2005) outlines a Markov Chain Monte Carlo (MCMC) algorithm for estimating the model, which is applied in this study.Footnote 27 I apply training sample priors, which are typically used in the TVP-VAR literature. More details on estimation and priors used for the parameters can be found in the Appendix.
VI
This section presents results from parameter restriction tests based on the time-varying VAR. The logic of the test is the same as that of the ordinary Granger causality test. It tells us if one variable (e.g. financial development) helps predict another (e.g. economic growth) at a statistically significant level. To answer this, we compare the estimated model with a model where the hypothesised ‘predictor’ variable is set to zero. In a TVP-VAR context, such a comparison is performed at each point in time. Koop et al. (Reference Koop, Leon-Gonzalez and Strachan2010) outline a methodology for doing this, which is applied below.Footnote 28 The advantage of testing for parameter restrictions is that it requires no additional assumptions of the model once it has been estimated. This contrasts with impulse response analysis, which is discussed in the next subsection.
The time-varying parameter model is estimated using the following three variables: GDP, deposits and paid-in capital. The variables are in log-differences and converted to real, per capita terms. These types of models are typically specified with a parsimonious lag structure, and studies with quarterly data often use two lags.Footnote 29 The results in this section are derived using a VAR with one lag, although they are robust to using models with two lags. The results are obtained by running the MCMC algorithm 50,000 times, with the first 30,000 draws discarded.
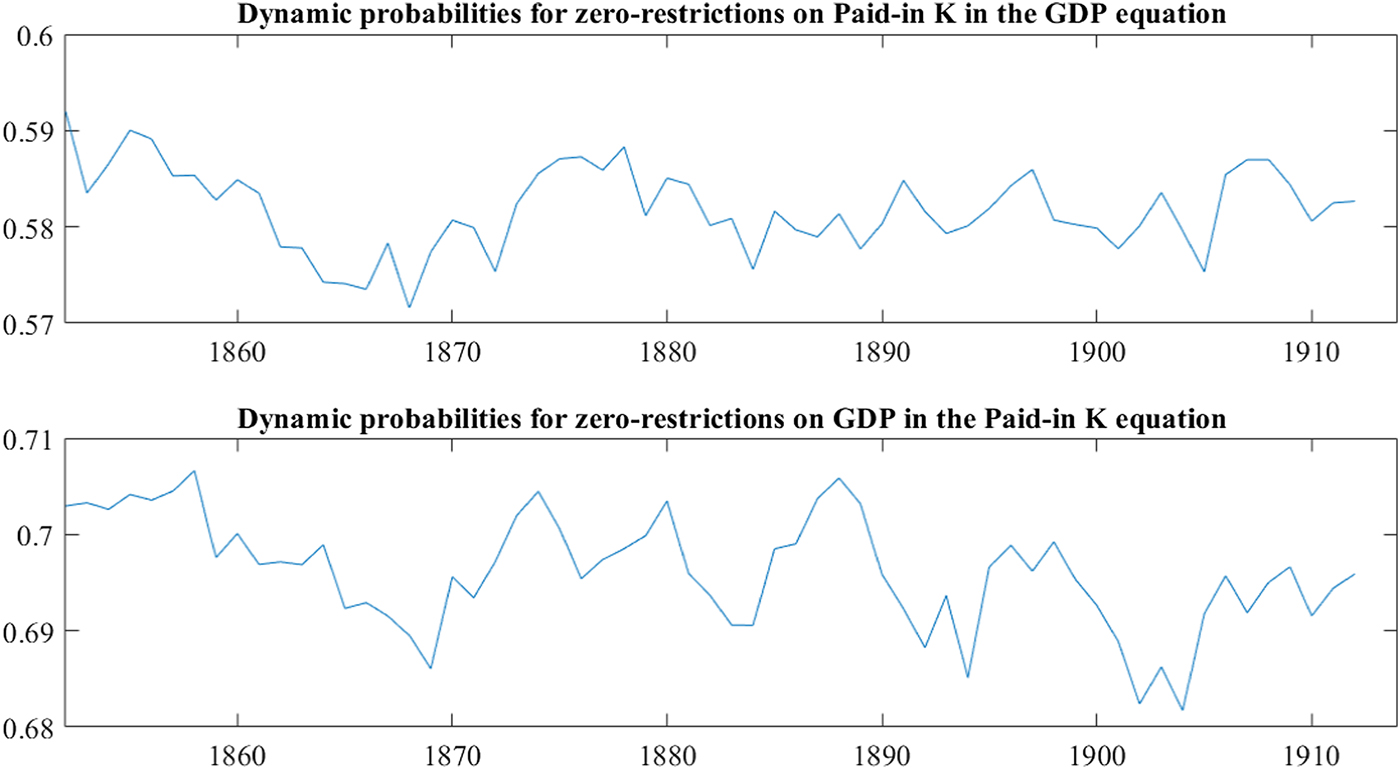
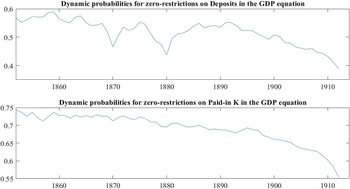
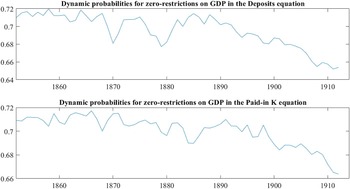
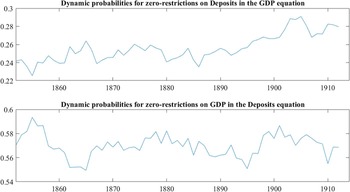
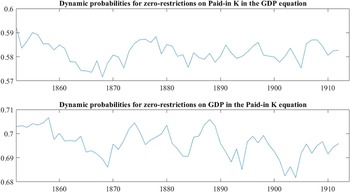
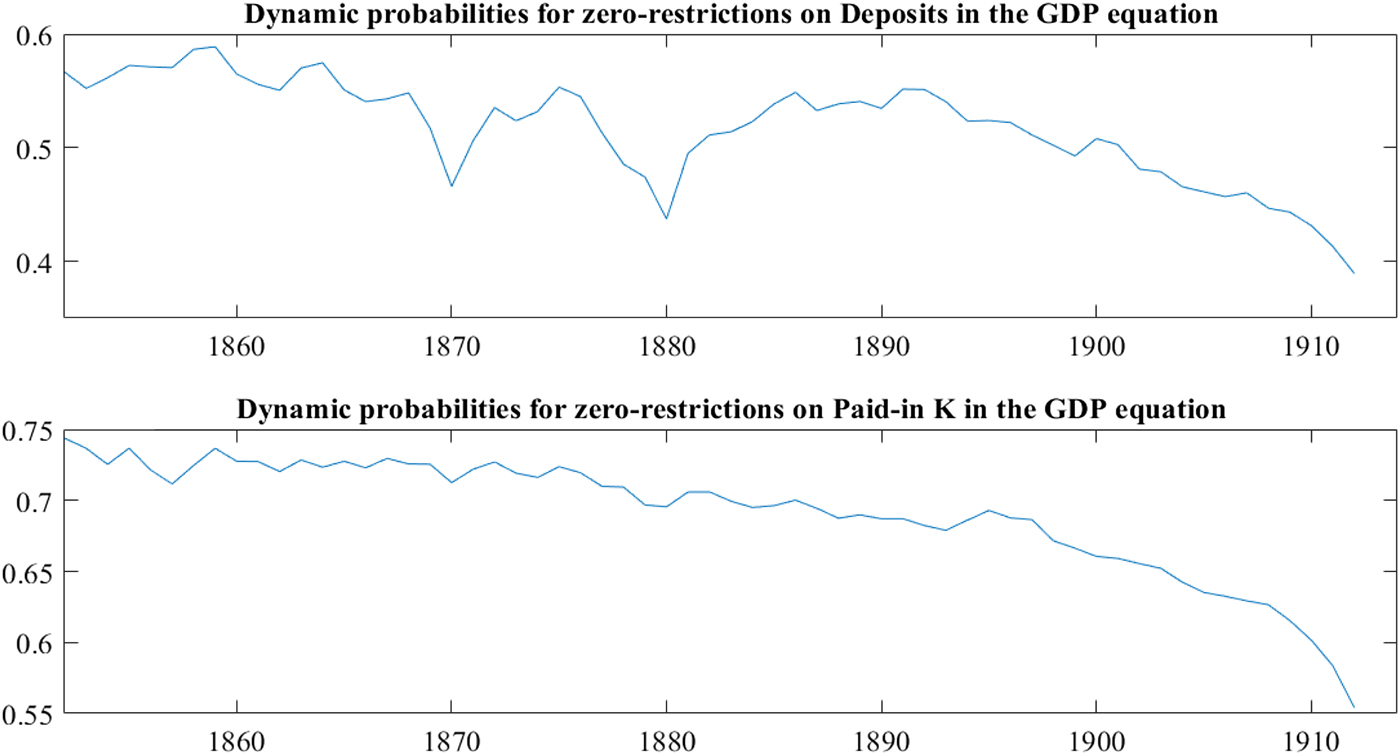
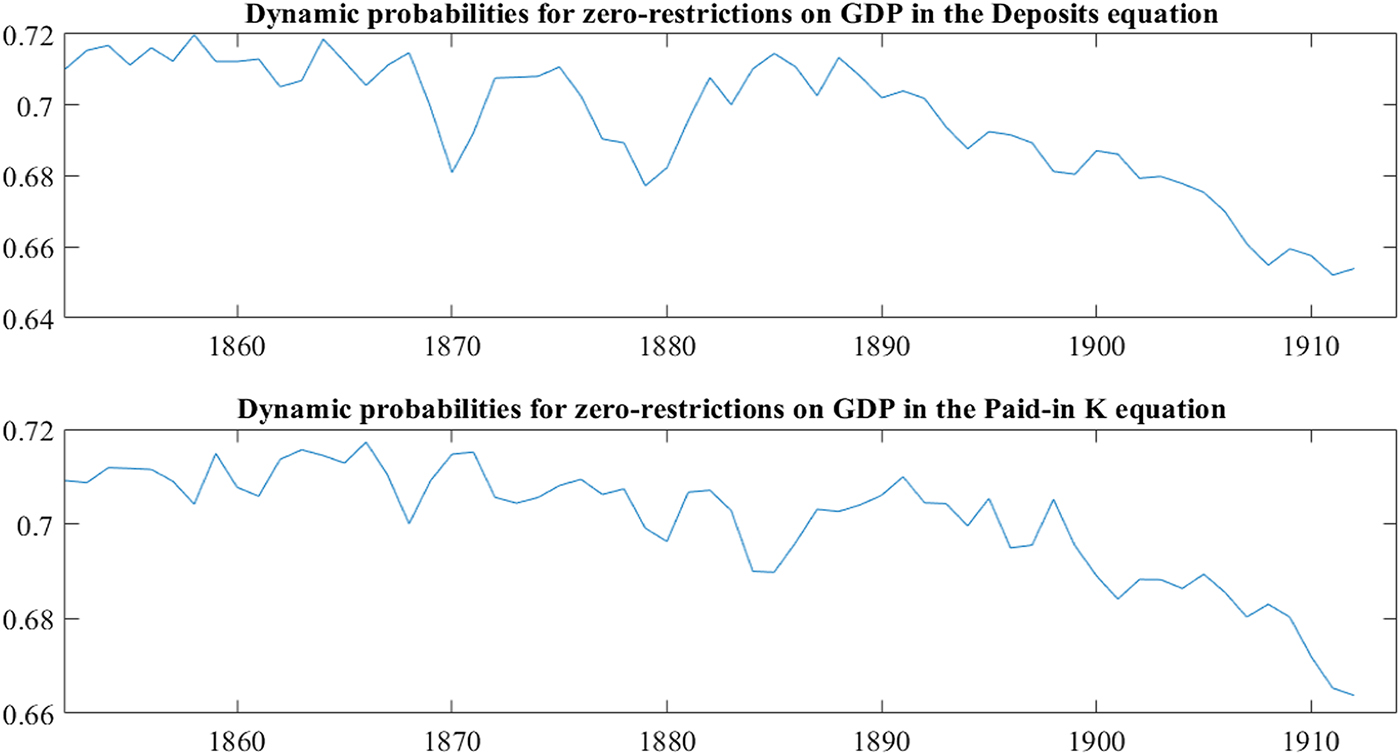
Results in the top panel of Figure 3 show the probability that the past evolution of deposits was not a significant factor in subsequent GDP growth at each point in time. The bottom panel shows corresponding results for paid-in capital and GDP. The lower the line is on the y-axis, the more likely it is that financial development could predict economic growth. Informally, these can be thought of as similar to p-values from a regression. To infer a significant predictive link from the financial variable to GDP, the line should be below 0.1 (corresponding to a 10 per cent probability). As is clear from the figures, there is no evidence of finance-led growth in the UK from 1850 to 1913. The probabilities of no linkage to GDP fluctuate between 0.45 and 0.55 in the case of deposits, and 0.6–0.75 in the case of paid-in capital. There is also no evidence of reverse contribution from economic growth to financial development, as shown in Figure 4. In fact, it is highly probable that the growth of the banking sector and stock markets was not driven by economic growth.
Time-varying parameter restriction tests of deposits and paid-in capital to GDP
Time-varying parameter restriction tests of GDP to deposits and paid-in capital
Based on the indicators used in the model above, it can be inferred that the stock market did not make a substantial contribution to UK economic growth in its capacity as a primary market. This reinforces the notion from the historical literature that most firms could rely on other sources to cover their needs for capital. Similarly, the findings suggest that commercial banks’ contribution to the payments system or provision of short-term credit was not an important driver of GDP growth, hence validating the cautious view that historians have taken about the banking sector's role in UK macroeconomic development.Footnote 30
Impulse response functions (IRFs) present an alternative way of examining the interaction between finance and growth. These show how shocks to a given variable (such as deposits) impact others (such as GDP). We can think of a shock to deposits as a change in deposits that cannot be explained by prevailing economic conditions, or by other variables in the VAR. The IRFs are convenient for summarising linkages between variables, as they depict the magnitude rather than just the significance of a relationship.
For the impulse responses to have an economic interpretation, we typically impose a structure on how the variables interact contemporaneously, while leaving their relationships otherwise unrestricted.Footnote 31 To render the model identified, I apply sign restrictions. These impose the condition that financial and economic variables should move in the same direction contemporaneously, but can move freely subsequently.Footnote 32 These assumptions are theoretically consistent with standard endogenous economic growth models augmented with financial variables (Luintel and Khan Reference Luintel and Khan1999). The results are also robust to restrictions where the financial indicator of interest is set to move contemporaneously in the opposite direction to other variables in the model.Footnote 33 Because of these assumptions and the absence of additional identifying restrictions, the impulse response findings should be considered supplementary to the findings from parameter restrictions.
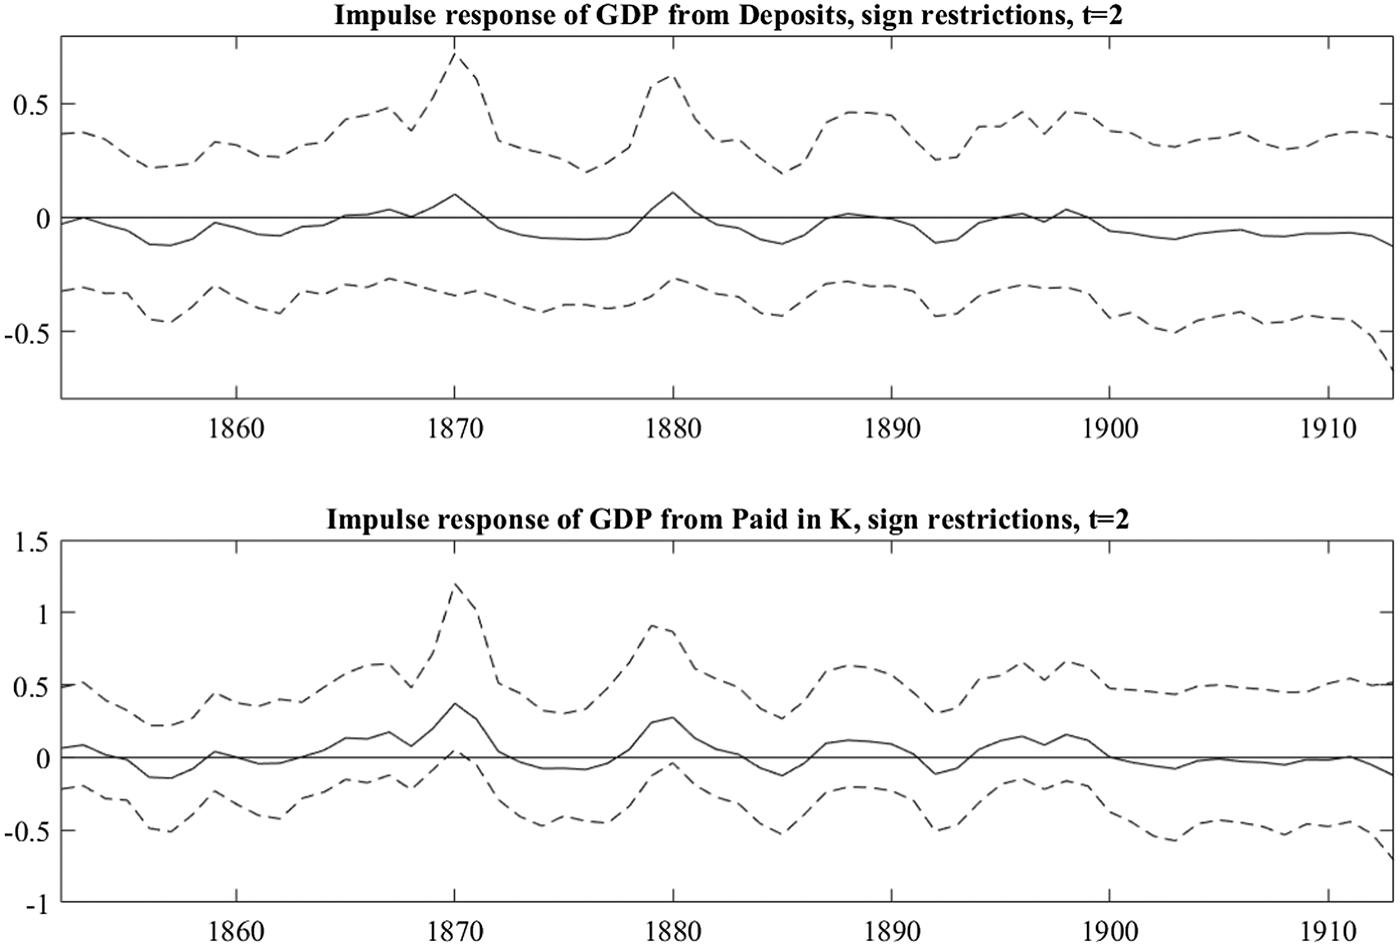
Figure 5 shows the impulse response of GDP from a shock to bank deposits (upper panel) and paid-in capital (lower panel) after one year. Impulse responses at longer horizons are insignificant and are thus omitted. The solid line in each graph represents the median impulse response obtained by running the estimation algorithm 20,000 times. The dashed lines indicate the 84 per cent and 16 per cent quantiles of these draws, typically used in Bayesian statistics.Footnote 34 If the lower dashed line is above zero, then we can infer a positive effect from one variable to another. A significant negative effect exists if the upper dashed line is below zero.
Response of GDP to a shock in deposits and paid-in capital after one year

The results in the upper panel of Figure 5 are consistent with those obtained from parameter restriction tests: an increase in deposits had little impact on GDP from 1850 to 1913. While the median impulse does show time-variation (the line in the middle fluctuates over time), the impact is not statistically significant in any year.
Turning to the stock markets, the lower panel in Figure 5 also gives little evidence of stock markets having a positive impact on economic growth. The impact of shocks on paid-in capital was marginally significant only around the years 1870 and 1880, while remaining insignificant throughout the rest of the period. Although the result for these two years should not be overemphasised, it is noteworthy that they were near the financial crises of 1866 and 1878, potentially indicating that these were the few years when financial constraints were significant. Overall, however, the results provide no evidence of economic growth having been driven by the expansion of the stock market.
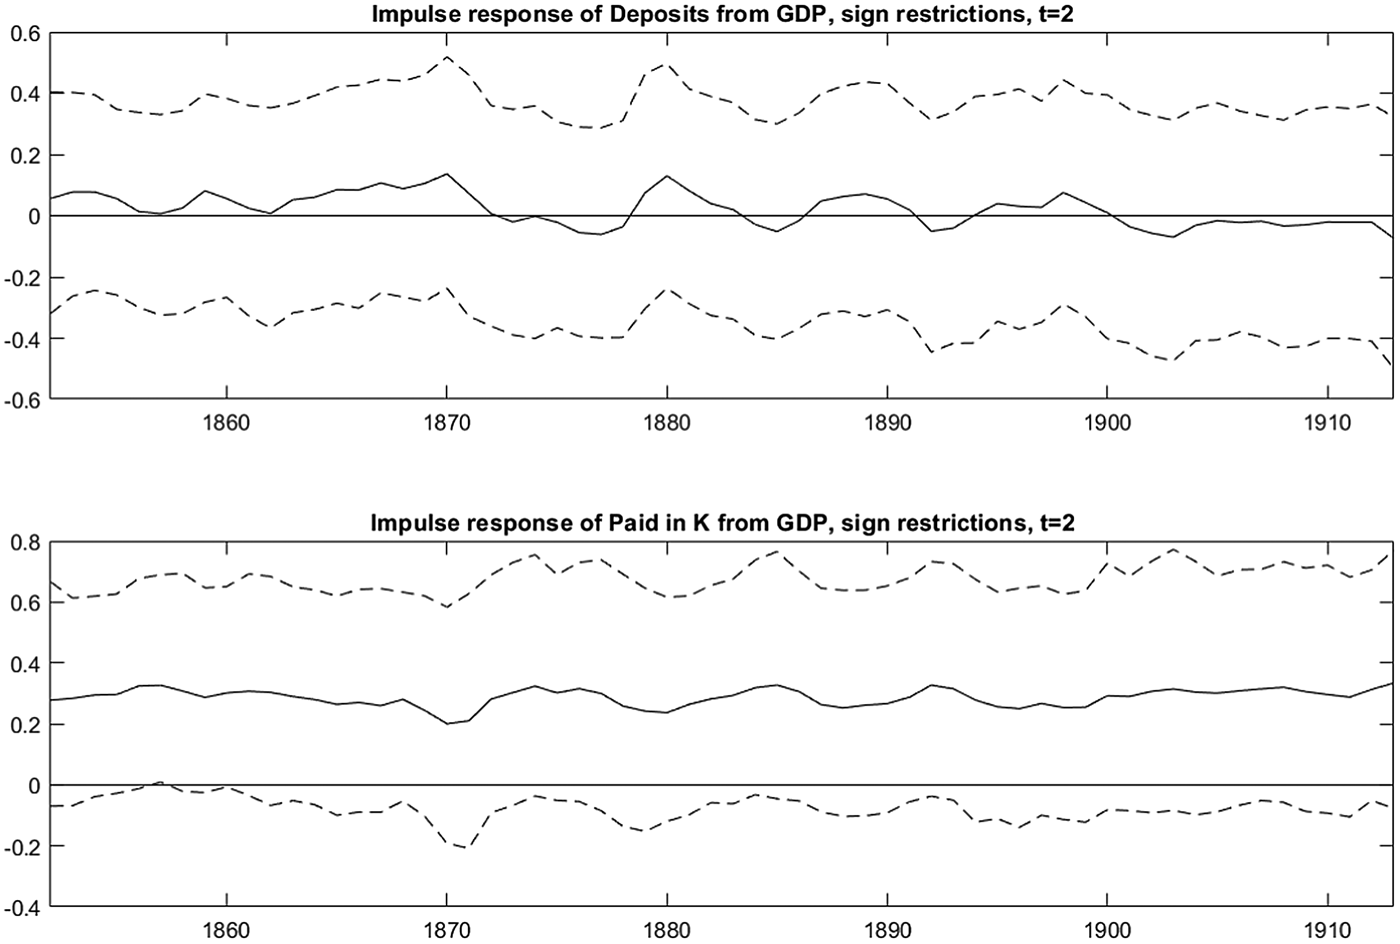
The impact of changes in economic conditions on the development of the banking sector and the stock markets was largely insignificant over a two-year horizon. The impulse response of GDP to deposits and paid-in capital after one year are shown in Figure 6. This implies that the commercial banking system grew to a significant extent due to factors that were not directly linked to economic conditions alone. The response of paid-in capital from GDP is positive, but only marginally significant during a few years of the sample. At most, this might be taken as relatively weak evidence of the stock market's growth having been driven by domestic demand in certain years. But as is the case with the banking sector, it is likely that most of the market's growth can be explained by other factors, such as demand coming from abroad.
Response of deposits and paid-in capital to a shock in GDP after one year

VII
This section shows that the results discussed above are robust to using alternative indicators of financial development: stock market liquidity and bank offices per capita. As is the case with other financial indicators used in this study, both series are differenced when used in the econometric model. Further robustness tests with specifications incorporating series on fixed capital formation can be found in the Appendix.
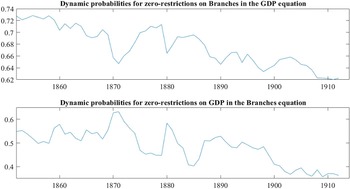
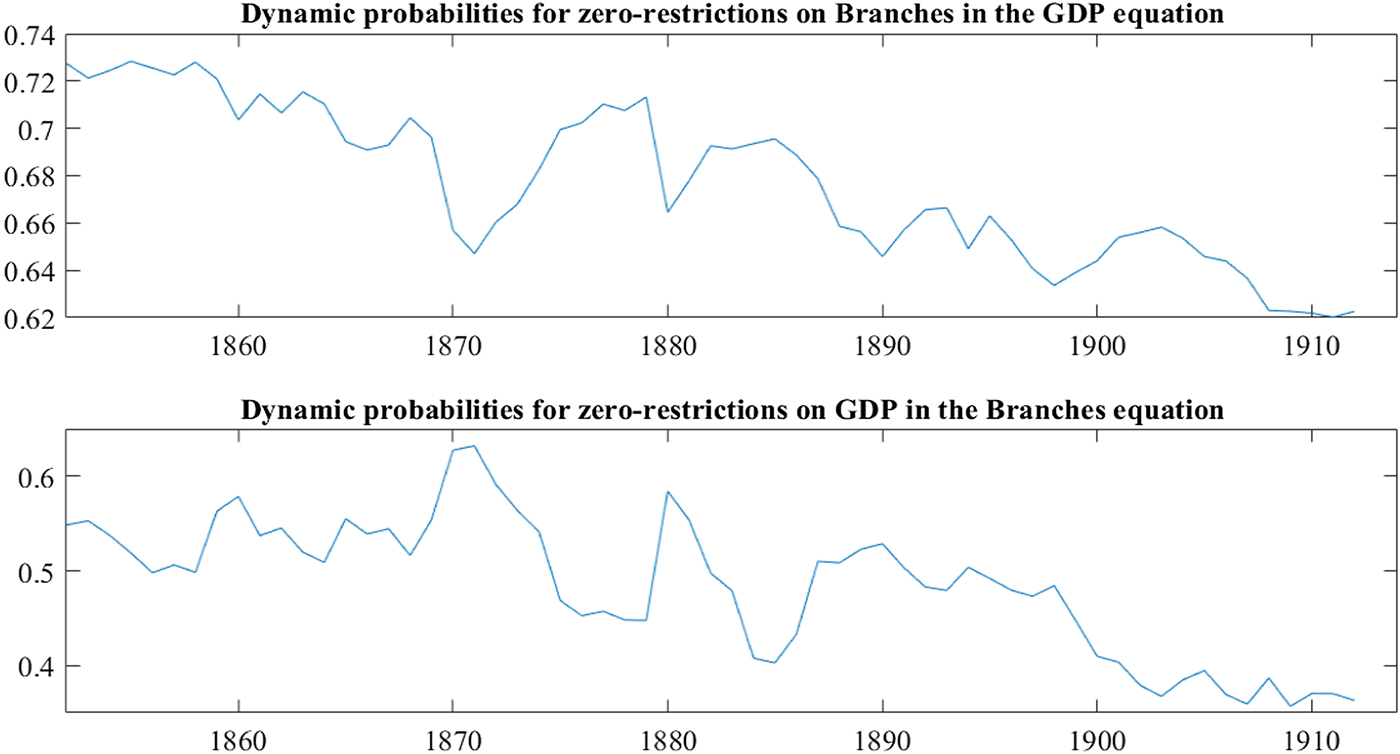
Figure 7 shows the results from a model with GDP, bank offices, and paid-in capital. The results are consistent with those displayed above: banks did not have a significant impact on subsequent economic growth. The spread of bank offices in the late nineteenth century thus did not render a major contribution to macroeconomic growth through mitigating information asymmetries and agency problems between borrowers and lenders.
Time-varying parameter restriction probabilities between branches and GDP
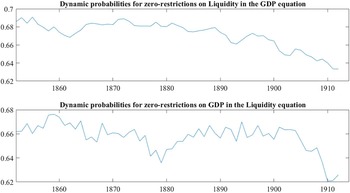
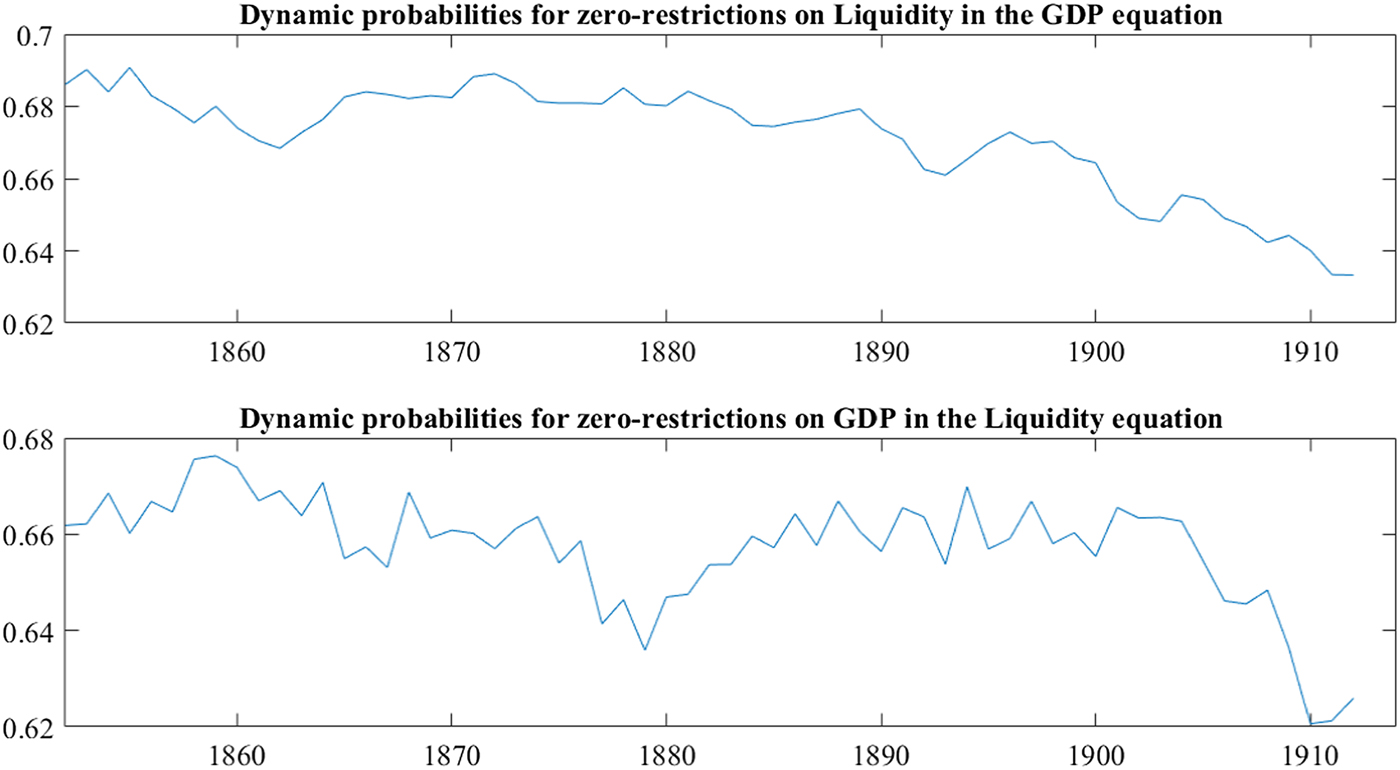
The results in Figure 8 are based on a model with GDP, deposits and the liquidity indicator described above. Changes in liquidity carried no significant predictive content for subsequent GDP growth, and the reverse is also true. This reinforces the notion that the stock markets did not significantly increase economic growth through channels other than raising capital, such as the provision of secondary markets. One should nevertheless be careful when interpreting results based on the liquidity measure in a time series econometric context, as year-on-year fluctuations within it may not provide an accurate proxy for changes in how the stock market functioned.
Time-varying parameter restriction probabilities between liquidity and GDP
VIII
This article uses new data coupled with time-varying parameter VARs to test if there was a significant link between financial development and subsequent economic growth in the UK from 1850 to 1913. The results suggest that there was not. The growth of the banking sector and that of the stock market was driven largely by factors other than yearly fluctuations in economic growth.
An advantage of this study's methodology is that the findings are easy to compare with econometric studies on other historical cases. In this regard, the results are consistent with Gerschenkron's hypothesis (although they do not explicitly test it) that a leading economy such as the UK benefited less from financial development than did less developed economies in the late nineteenth and early twentieth centuries. Previous empirical findings of finance-driven growth in these cases could thus be explained by their relatively low levels of economic development. In a similar vein, the results are also consistent with recent literature arguing that the growth of a large and already well-developed financial sector often has little impact on economic growth in advanced economies.
The findings indicate that the growth of the banking sector did not have a substantial economic impact either through the provision of liquidity and short-term loans or through the mitigation of agency problems, which constituted the primary channels through which historians have suggested that banks could have supported the economy. Moreover, results from time-varying parameter models have further implications for the historical literature on British banking. Banks shifted a significant share of their assets away from loans to the non-financial sector after the late 1870s. Yet, according to this study's results, these changes did not have a significant impact on the broader economy. Notably, crises such as those of 1866 and 1878 did not appear to change the link between the banking sector and the economy over the longer run, although it is precisely after these episodes that substantial changes in banking practices and the banking industry appear to have occurred.
The results pertaining to the stock markets support a cautious view of their role in promoting macroeconomic growth during the period under consideration. This is not controversial with regards to the years 1850–90, as before the 1890s, domestic companies (except for railways and financial institutions) would rarely seek capital from the public. What is more surprising is the muted role of the capital markets after 1890. Their economic impact did not change from earlier years, despite the fact that during this period, domestic companies in several industries became more reliant on stock exchanges. At the same time, this study does not find support for the argument that the growth of the capital markets was merely driven by domestic demand. According to impulse response analysis, economic growth contributed to the expansion of the stock markets only at a marginally significant level during some years between 1850 and 1913. It follows that institutional factors, along with demand coming from abroad, might be more relevant for explaining the rapid expansion of the UK's stock markets.
An optimistic way of interpreting the results on capital markets is to suggest that the supply of long-term finance was not constrained significantly in the UK during 1850–1913. This view is consistent with literature suggesting that firms in the late nineteenth century could easily find capital through private channels if needed. The contribution of the stock markets may therefore have been muted, because a large share of firms could find substitutes for capital raised from the public. Notwithstanding this possibility, the results still imply that the capital markets did not make a significant contribution to the economy through other channels, such as improving corporate governance or through decreasing liquidity premia on securities. It remains unclear whether the stock markets’ ability to foster growth was hindered through institutional weaknesses, and further research on the topic is needed.
A potential criticism of this article's methodology is that annual data aggregated at the national level are too coarse to garner an understanding of the changing relationship between finance and economic growth. An advantage of working with such aggregated data is an increase of the results’ consistency with those of other studies on historical finance–growth links. Nevertheless, more granular data could be used for more accurate study of the individual channels through which the financial sector and the real economy interacted. Another important avenue for further research is to construct a long-run series of commercial bank credit for the UK and to use it in a similar econometric examination. Such a dataset would provide a more accurate proxy for banks’ allocation of resources rather than the growth of their funds.
Appendix
Data on Scottish banks
The sources used to supplement the deposit data with those of Scottish banks are outlined in Table A1.
Data on public liabilities of Scottish banks included in the sample
Comparison of paid-in capital with other indicators for the development of capital markets
The purpose of this part of the Appendix is to illustrate briefly that the series on paid-in capital correlates well with a few other available indicators of the development of British stock markets, thus validating its use.
Hannah (Reference Hannah2017) has recently criticised data collected by Grossman (Reference Grossman2015) from the IMM on the paid-in capital of securities listed on the London Stock Exchange. He shows that there are wide disparities between contemporary published figures on paid-in capital on the London Stock Exchange and the figures that Grossman reports. This is a clear problem with Grossman's data, and brings into question the validity of constructing series based on the IMM. My data on paid-in capital are more consistent with other contemporary data, as they address issues with Grossman's series by including debt securities and preference shares.
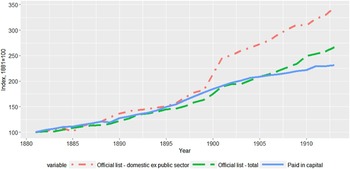
The London Stock Exchange's Share and Loan Department reported annual figures on the paid-in capital of securities on the exchange from 1881 onwards.Footnote 35 These were published in Burdett's Official Intelligence from 1881 to 1897, and the Stock Exchange Official Intelligence thereafter. These data – referred to as the ‘official list data’ – are presented together with my data on paid in capital in Figure A1. One of the series shows the growth of the total capital quoted on the official list, except for securities with coupons payable abroad. Another shows the growth of capital of mostly domestic securities on the official list, excluding public sector debt. The series is mostly domestic, because some securities in the categories included may also be foreign, particularly later in the sample.Footnote 36
Amount of paid-in capital quoted on the London Stock Exchange compared with data used in this study
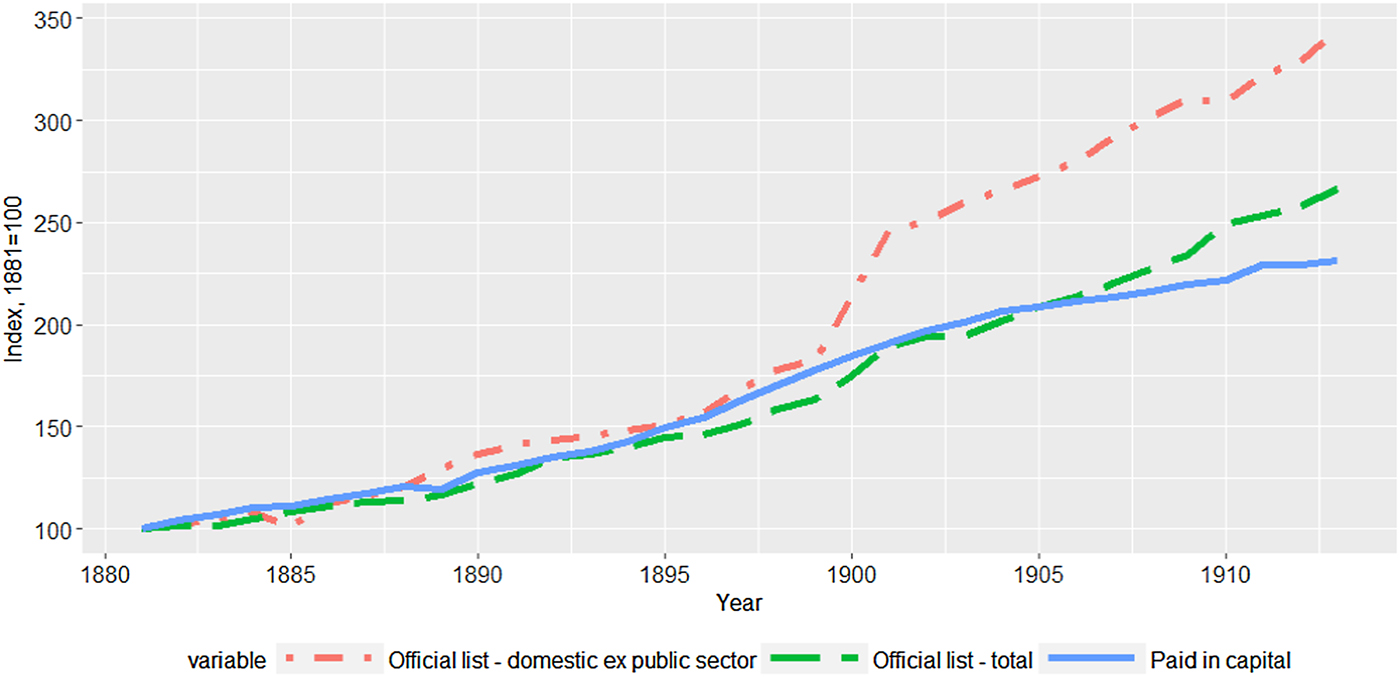
Whatever the problems in Grossman's data are, they do not appear to be present in the data used in this study. Figure A1 shows that the growth of my data on paid in capital is, for the most part, consistent with the growth rate of the official series. The main point of divergence in the growth trends occurs around 1900–2, where the domestic official list series expands more rapidly than my paid-in capital series. There is no individual item that can explain why the domestic series grew so quickly in these two years, although the capital of banking and insurance companies expanded markedly during this time. It is likely that this is in part driven by listings of foreign financial institutions. The official list does not distinguish between domestic and foreign banks.
Even if we were to assume that the 1900–2 episode of growth in the domestic series was due to an increase in domestic listings, this omission would be of little consequence for the econometric results. This is because the change only happens over two or three years, which will not cause consequential changes to overall TVP-VAR results.
To supplement the liquidity measure used in this article's econometric examination, it would be difficult to build direct transaction volumes based on tax records. Stock Exchange transactions were taxed until 1893, but the tax was abandoned as the government feared that business would be driven to other financial centres (Michie Reference Michie1987, p. 89). Stamp duties were collected on transfers of certain marketable securities after 1893, but there were major changes in what types of securities were subject to this tax. For example, there was an imposition of duties on previously excluded foreign and colonial certificates at the turn of the century.Footnote 37 These inconsistencies, together with an extremely high year-on-year variability, render the stamp duty data unsuitable for econometric purposes.
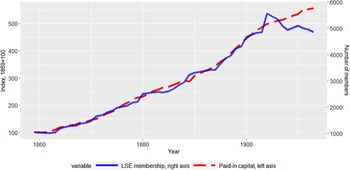
Another proxy for the ease of trading shares on the capital market can be obtained from the membership figures of the London Stock Exchange.Footnote 38 Members of the Stock Exchange were individuals for whom stockbroking was their primary occupation. They were therefore in the business of providing liquidity to the markets.Footnote 39 Figure A2 compares the membership of the London Stock Exchange with the data on paid-in capital. The figures clearly suggest that paid-in capital was quite well correlated with Stock Exchange membership. Therefore, paid-in capital might also correlate with the market's overall liquidity.
Membership of the London Stock Exchange
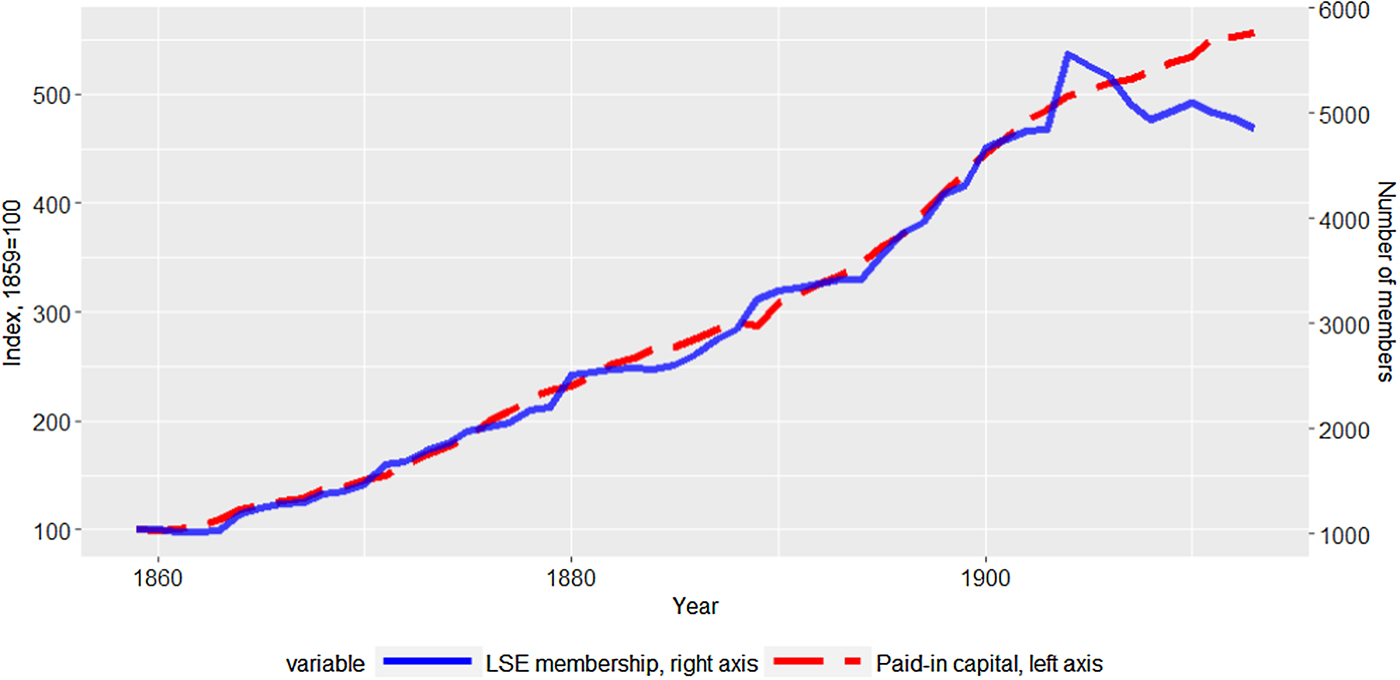
The close co-movement between paid-in capital and London Stock Exchange membership is somewhat surprising, because there were several changes to the rules that governed the growth of the membership. For example, higher membership fees were introduced in 1881, and new members were required to buy shares of the London Stock Exchange after 1900.
Nevertheless, the membership kept increasing remarkably steadily until 1905–7, when several members were unable to meet their commitments and went bankrupt (Neal and Davis Reference Neal and Davis2006). Indeed, this episode indicates the first clear divergence between the two series in Figure A2.
Priors and estimation of the TVP-VAR
In Bayesian estimation, we are concerned with obtaining the posterior probability distribution of parameters, which contains information about the parameters conditional on the data. In order to obtain estimates, we need to specify priors, which contain our prior beliefs about the parameters. Priors, together with the model likelihood function which includes information about the observed data, are then used to estimate the posterior distribution. More formally, let  $ {\,f\left( {{\bi y} \vert {\bi \theta }}\right) $ represent the likelihood function of the data conditional on the parameters, where y is the observed data and
 ${\bi \theta }\, $ are all the parameters. The posterior and prior distributions are denoted
 $ {p\left( {{\bi y} \vert {\bi \theta }}\right) $ and
 $ {p\left( {{\bi \theta }_{\bi k}}\right) $, respectively. The posterior distribution of parameters is then obtained via Bayes’ theorem:
 $${\,p\left( {{\bi \theta } \vert {\bi y}} \right) = \displaystyle{{\,f\left( {{\bi y} \vert {\bi \theta }} \right)p\left( {{\bi \theta }_{\bi k}} \right)} \over {\int f\left( {{\bi y} \vert {\bi \theta }} \right)p\left( {\bi \theta } \right)d{\bi \theta }}}} $$
 $${\,p\left( {{\bi \theta } \vert {\bi y}} \right)\propto f\left( {{\bi y} \vert {\bi \theta }} \right)p\left( {{\bi \theta }_{\bi k}} \right)} $$
Where ∝ denotes ‘proportional to’: the estimates of the parameters are proportional to the prior distributions and the likelihood function.Footnote 40
Bayesian priors are a convenient for providing some degree of restriction to what values the parameters can take. In a time-varying model they are particularly important, because priors also determine the amount of time-variance that can take place. However, it is still possible to specify priors which make the posterior draws heavily data-driven. A common starting point for doing this is to estimate a time-invariant VAR using a training sample. Because of the relatively short sample in my case, and lack of data before 1850, I use the full sample as my training sample. A similar approach has been used previously in economic history by Straumann and Woitek (Reference Straumann and Woitek2009), although owing to more data, they do not use all of their sample for training.
The priors of the parameters in the TVP-VAR specified by Primiceri can be summarised as follows:
 $${{\bf \beta }_0 \sim N\left( {{{ \hat{\bi \beta }}}_0,c_\beta \cdot V\left( {{{ \hat{\bi \beta }}}_0} \right)} \right)} $$
 $${{\bi H}_0 \sim N\left( {{{ \hat{\bi H}}}_0,c_h \cdot {\bi I}_N} \right)} $$
 $${{\bi A}_0 \sim N\left( {{{ \hat{\bi A}}}_0,c_\alpha \cdot V\left( {{{ \hat{\bi A}}}_0} \right)} \right)} $$
 $${{\bi Q} \sim IW\left( {k_Q^2 \cdot V\left( {{\bi Q}_{\,prior}} \right) \cdot {\rm \kappa },{\rm \kappa }} \right)} $$
 $${{\bi W} \sim IW\left( {k_W^2 \cdot N,{\bi I}_{\rm N}} \right)} $$
 $${{\bi S}_{\bi i} \sim IW\left( {k_S^2 \cdot \left( {i + 1} \right) \cdot V\left( {{\bi S}_{\,prior}} \right),\left( {i + 1} \right)} \right)} $$
The underlying parameters to be estimated are outlined in Section v. Here, S i denotes row i of the matrix S. S is block diagonal such that: S1 = s 1; S2 = [s 2, s 3]. W is a diagonal matrix with elements w i.
 ${ \hat{\bi \beta }}_0$;
 ${\hat{\bi H}}_0\; $ and
 ${\hat{\bi A}}_0$ are estimates based on a constant-parameter VAR on the full sample. V (·) denotes the estimated variances of these parameters. N(·) and IW(·) are the normal and inverse-Wishart distributions, respectively. κ is the prior degrees of freedom allowed for the distribution of Q. To avoid unnecessary restrictions, it is set close to the minimum allowed for the prior to be proper: (1 + Nρ)×N + 1 (Cogley and Sargent Reference Cogley and Sargent2005). This allows the data significant freedom to determine how much time-variance there is in the parameters. This choice is motivated by recent simulation studies showing that the traditionally used prior by Primiceri with more degrees of freedom is too restrictive (Reusens and Croux Reference Reusens and Croux2017).
Following Kang et al. (Reference Kang, Ratti and Yoon2015), I specify V(Qprior) = IN×(Nρ+1) and V(S prior) = I N. This constitutes an uninformative and relatively flat prior, and contrasts with the more traditional approach by, for example, Primiceri (Reference Primiceri2005), who sets V(Qprior) = V( ${{{ \hat{\bi \beta }}}_0}$) and V(Sprior) = V(
 ${{{ \hat{\bi A }}}_0} $). In a small sample, the latter approach is too restrictive, as it imposes too many prior constraints on the amount of time-variance that the model can exhibit. In a longer sample this matters less. However, my results are robust to using the latter specification, although this type of model's time-variance is muted.
For the hyperparameters, I set k Q = 0.0035; k S = 0.01; k W = 0.05.Footnote 41 For the priors of  ${ {\bi \beta }}$, A and H, I set c β = 4; c α = 4 and c h = 4, which are consistent with the specification of Primiceri. I have experimented with setting priors of k Q between 0.001 and 0.01; k S between 0.01 and 0.1; k W between 0.01 and 0.1. I have also tried changing c β, c α and c h between 1 and 4. The results are robust to these changes, although high levels of k Q and low values of k W led to high degrees of dispersion and instability in the draws. These priors are largely consistent with those used in the macroeconomic literature.
Once the model parameters have been estimated, it is possible to estimate parameter restriction probabilities in a time-varying setting using the approach outlined by Koop et al. (Reference Koop, Leon-Gonzalez and Strachan2010). This method builds on the intuition behind Bayesian model selection. Suppose we have two models, M 1 and M 2, where model 1 incorporates restrictions on the relationship between finance and the economy. In other words, M 1 contains the restriction that all elements of β that link past values of financial development to economic growth are zero, which implies that financial development was not a significant predictor of subsequent economic growth. Let p(M 1) denote the prior probability that model M 1 is correct, whereby the corresponding probability for the unrestricted model is p(M 2) = 1 − p(M 1).
To ascertain whether a variable has predictive power, we evaluate the probability that M 1 is true. The posterior odds ratio is used to compare the restricted and unrestricted models:
 $${\displaystyle{{\,p\left( {M_1 \vert {\bi y}} \right)} \over {\,p\left( {M_2 \vert {\bi y}} \right)}} = \displaystyle{{\,f\left( {{\bi y} \vert M_1} \right)p\left( {M_1} \right)} \over {\,f\left( {{\bi y} \vert M_2} \right)p\left( {M_2} \right)}} = BF\displaystyle{{\,p\left( {M_1} \right)} \over {\,p\left( {M_2} \right)}}} $$
Where p(M i|y) is the posterior probability that model i is true under the data y, and BF stands for ‘Bayes factor’, which is central to the method outlined by Koop et al. This is the ratio of the marginal likelihoods, which are defined as:
 $${\,f\left( {{\bi y} \vert M_i} \right) = \int f\left( {{\bi y} \vert {\bi \theta }_i,M_i} \right)p\left( {{\bi \theta }_i \vert M_i} \right)d{\bi \theta }_i} $$
Let βrestricted incorporate the restriction that there is no contribution from finance to economic growth. Koop et al. show that in the TVP-VAR case, the Bayes factor can be obtained as the ratio of the unrestricted posterior and prior, evaluated at the point where the restrictions on β hold. Formally:
 $${BF = \displaystyle{{\,p\left( {{\bi \beta } = {\bi \beta }_{{\bi restricted}} \vert {\bi y}} \right)} \over {\,p({\bi \beta } = {\bi \beta }_{{\bi restricted})}}}} $$
This calculation can be based directly on the draws of the TVP-VAR estimation algorithm. Koop et al. outline the precise formulae for doing this. Once the Bayes factor is calculated, it is possible to calculate the probability of a dynamic relationship between macroeconomic variables during each year in the sample.
Structural breaks
Structural breaks in the underlying series may limit the validity of inferences drawn from standard VARs. If breaks represent few temporary changes in the series, they could be dealt with using dummy variables. However, if these breaks reflect more gradual changes, or if the relationships between financial and economic variables change, standard VAR models are not adequate, even when dummy variables are used. Moreover, in the presence of several breaks of different magnitude, dummy variables themselves may be inadequate for making the model unbiased. These possibilities motivate the application of the TVP-VAR.
The indicators of financial development – deposits and paid in capital – both include several breaks. This can be shown by using the Bai and Perron (Reference Bai and Perron2003) test. The test is carried out on the following equation:
 $${y_t = \alpha + \beta y_{t-1} + \gamma t + \left( {\mathop \sum \limits_{i = 1}^k \delta _iD_i} \right) + u_t} $$
where y t is the value of a series of interest at time t. We test if any number of parameters corresponding to dummies D i are significant. D i is an indicator variable, taking the value 1 in a given year and zero otherwise. The date at which D i is 1 is the proposed date of the structural break. The Bai–Perron algorithm tests for breakpoints at unknown dates, and returns the dates at which structural changes in the variable y are most likely to have occurred.
The Bai–Perron test on deposits suggests two breakpoints, for the years 1876 and 1899, based on the Bayesian Information Criterion. Especially the 1876 breakpoint is to be expected, as it is close to the City of Glasgow Bank failure in 1878. With regards to paid in capital, the test suggests at least four breakpoints, for the years 1880, 1889, 1895 and 1905. In the presence of such instability in the series, it is useful to apply methods that are able to deal with non-linearities in the underlying data.
Robustness of TVP-VAR results
The results below show that switching one of the financial variables with a variable for fixed capital formation, which can be used as a proxy for investment, does not change the results. Data on fixed capital formation at constant prices, excluding buildings and works, are taken from Mitchell (Reference Mitchell1988, ch. 16, table 6).Footnote 42
Figure A3 shows results from a VAR system with GDP, deposits, and fixed capital formation. In Figure A4, the exercise is repeated with a VAR including data on GDP, paid-in capital, and fixed capital formation. Neither system provides evidence of a relationship between financial and economic variables. There is no evidence of investment-led growth being driven either by stock markets or banks.
Time-varying parameter restriction probabilities between GDP and deposits, equation with fixed capital formation
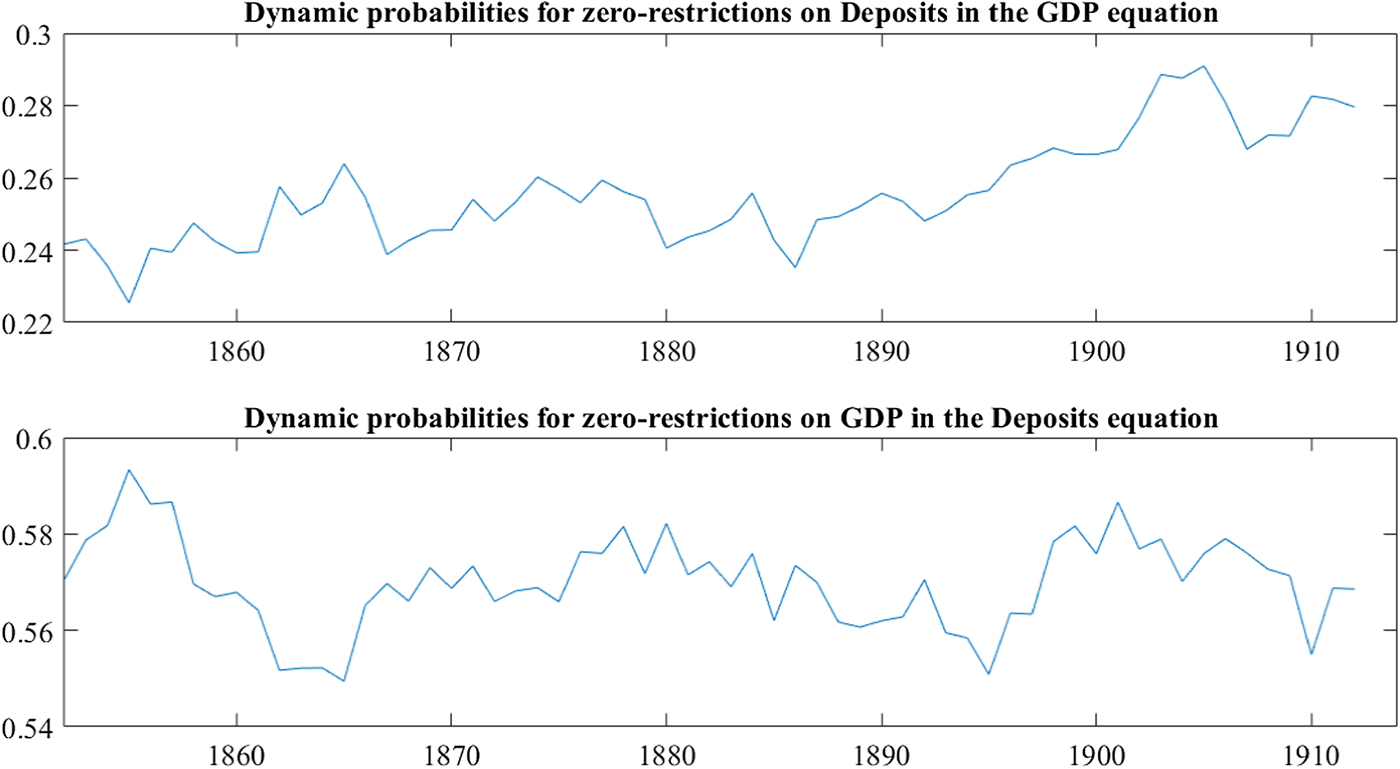
Time-varying parameter restriction probabilities between GDP and paid-in capital, equation with fixed capital formation