





Introduction
Field margins can harbor both weeds and pest insects, which can disperse into crop fields and become problematic (Schütz et al. Reference Schütz, Wenzel, Rottstock, Dachbrodt-Saaydeh, Golla and Kehlenbeck2022; Zimdahl Reference Zimdahl2018). Farmers often use practices such as mowing or applying herbicides to manage field margins. However, planting desirable species in field margins may also suppress weeds while enhancing biodiversity and providing ecosystem services (Bokenstrand et al. Reference Bokenstrand, Lagerlöf and Torstensson2004; De Cauwer et al. Reference De Cauwer, Reheul, Nijs and Milbau2008; Denys and Tscharntke Reference Denys and Tscharntke2002; Le Clech et al. Reference Le Clech, Van Bussel, Lof, De Knegt, Szentirmai and Andersen2024; Uyttenbroeck et al. Reference Uyttenbroeck, Hatt, Paul, Boeraeve, Piqueray, Francis, Danthine, Frédérich, Dufrêne, Bodson and Monty2016). Field margin plantings are well known to improve on-farm biodiversity. Both pollinators and predatory arthropods have been found in greater abundance in sown field margins, and greater arthropod biodiversity is typically associated with lower pest population densities (Meek et al. Reference Meek, Loxton, Sparks, Pywell, Pickett and Nowakowski2002; Sutter et al. Reference Sutter, Albrecht and Jeanneret2017).
It is unclear to what extent field margin management impacts weed communities (Sosnoskie et al. Reference Sosnoskie, Luschei and Fanning2007). With a few notable exceptions, most research on biodiversity plantings, as well as field margins more generally, focuses on their ecological potential rather than their impact on weeds. Reberg-Horton et al. (Reference Reberg-Horton, Mueller, Mellage, Creamer, Brownie, Bell and Burton2011) found that weed abundance decreased as distance from the field edge increased and that neither field margin management (consisting of either mowing or herbicide application) nor the presence of weeds in the margin was a predictor of weeds within fields. A recent study conducted in Germany found that the presence of wildflower strips within field margins had no impact on weed biomass within crop fields (Hatt and Döring Reference Hatt and Döring2024). Hedgerows, a different type of biodiversity planting along crop borders, have been found to reduce weed numbers, cover, and species richness within annual crop fields (Long and Valliere Reference Long and Valliere2025). Despite the myriad of potential ecological benefits associated with field margin plantings, perception of their value has been mixed. The public often values field margin plantings for their aesthetic qualities, especially when they include colorful flowering plants (De Snoo et al. Reference De Snoo, Van Dijk, Vletter and Musters2023).
While wildflower strips are considered likely to be a net positive for farmers, surveys of European farmers have found that wildflower strips are one of the least liked methods of ecological intensification (Kleijn et al. Reference Kleijn, Bommarco, Fijen, Garibaldi, Potts and Van Der Putten2019; Uyttenbroeck et al. Reference Uyttenbroeck, Hatt, Paul, Boeraeve, Piqueray, Francis, Danthine, Frédérich, Dufrêne, Bodson and Monty2016). Although farmers often express concern about the loss of productive land, a study conducted in England showed that establishing wildlife-friendly habitats increased yields within the cropped areas of fields, compensating for the land removed from production and resulting in no net yield loss (Pywell et al. Reference Pywell, Heard, Woodcock, Hinsley, Ridding, Nowakowski and Bullock2015). Within New York State, farmers have expressed concern about establishing biodiversity plantings close to crop fields because they do not know if the planting will act as a reservoir for weeds or if the seeded species will become weedy (AS Westbrook, personal communication).
In this study, the objective was to determine how perennial field margin plantings compare with more conventional methods of field margin management in terms of biodiversity, weed abundance, and pest insect foraging choice. Perennial field margin plantings tend to be weedier during the first year of establishment than other types of field margin plantings, but not in subsequent years (Angelella et al. Reference Angelella, Stange, Scoggins and O’Rourke2019). However, weediness in sown plantings in the first year might lead to problems in the crop in future years if weed seeds from the plantings are allowed to enter the seedbank. We hypothesized that (1) field margin plantings do not increase the abundance of aboveground weeds or pest insects relative to conventional field margin management strategies, (2) that mowing within field margin plantings would improve weed control, (3) that field margins planted with a native grass mix would have a more pronounced suppressive effect on weeds, and (4) that field margins planted with a native wildflower mix would attract higher numbers of arthropods. Within conventionally managed field margins, we hypothesized (5) that frequent mowing and especially glyphosate applications would reduce all plant and insect parameters compared with infrequent mowing, the unmanaged control, or any of the biodiversity plantings.
Materials and Methods
Experimental Design
A 2-yr field study beginning in May 2024 was conducted at the Pullyen Research Farm in Varna, NY (42.462395°N, 76.439234°W) and at the Musgrave Research Farm in Aurora, NY (42.725208°N, 76.652688°W). The soil at Pullyen was a Genesee silt loam (a fine-loamy, mixed, superactive, mesic Fluventic Eutrudept), and the soil at Musgrave was a Lima silt loam (a fine-loamy, mixed, semiactive, mesic Oxyaquic Hapludalf). Soil fertility testing was performed for each site at the beginning of the experiment. Each site was planted with corn (Zea mays L.) in the year preceding the start of this experiment. The entire field at each site was plowed, disked, and harrowed in May of the first year of the experiment. Tillage was only applied to the corn rows in subsequent years, after the biodiversity plantings were established. Corn was planted on May 30, 2024, and June 9, 2025, at Pullyen, and June 7, 2024, and June 4, 2025, at Musgrave. Corn was planted at a rate of 74,625 seeds ha−1 in 76-cm rows. The variety planted at Pullyen was Optimum® AcreMax® (Pioneer Hi Bred International, Johnston, IA, USA), and at Musgrave the variety planted was SmartStax® RIB Complete® (Bayer Crop Sciences, Chesterfield, MI, USA). Fertilizer (10-20-20 NPK, 224 kg ha−1) was applied exclusively to the corn rows at planting. Irrigation was not provided. Glyphosate was applied once the corn reached V3, at the rates recommended by Cornell Cooperative Extension. At Musgrave, a mixture of Roundup PowerMax 3® (Bayer Crop Sciences) and Quest® (Helena, Collierville, TN, USA) was sprayed at 0.59 L ha−1 on July 3, 2024, and July 11, 2025, using a Hardi Ranger 2000 (HARDI International, Davenport, IA, USA) with a 12-m boom. The nozzles used were Hardi 025 Mini Drift Duo nozzles (HARDI International) at a pressure of 275.79 kPa. At Pullyen, Credit 41 Extra® (Nufarm Americas, Alsip, IL, USA) was applied on June 26, 2024, and July 10, 2025, at a rate of 0.95 L ha−1 with a CropCare (CropCare Equipment, Lititz, PA, USA) sprayer with a 9-m boom. Air-induction flat nozzles (TeeJet® Technologies, Glendale Heights, IL, USA) were used at a pressure of 276 kPa.
In the first year of the experiment, native plant strips were established concurrently with corn planting at each site. Seed was sourced from Ernst Conservation Seeds (Meadville, PA, USA). Native grasses (ERNMX-177) and forbs (ERNMX-153-1) were broadcast at the recommended rates of 16.8 and 11.2 kg ha−1, respectively. The species included in this study and the percentage of each species in each mix are included in Supplementary Table 1. At the Musgrave site, two of the wildflower plots and one of the grass plots were accidentally seeded twice.
The experiment at each site used a randomized complete block design with four blocks. Each block contained eight 10 by 10 m plots separated by 7.9 m. One side of each plot was adjacent to a crop strip consisting of eight corn rows spaced 76.2 cm apart. Each block was located at least 10 m away from all other blocks. The plots in each block were randomly assigned to one of seven treatments: infrequently mowed wildflower strip, wildflower strip without mowing, infrequently mowed grass strip, grass strip without mowing, infrequently mowed unplanted margin, frequently mowed unplanted margin, glyphosate applied at the same rate and time as in the adjacent crop, and an unmanaged control. Plots in the frequent mowing treatment, as well as the areas around the plots, were mowed to 8 cm every 3 wk starting in June and ending in late August. The infrequent mowing treatment was adapted from the Xerces and USDA-NRCS guidelines for weed suppression during wildflower habitat establishment (Xerces Society for Invertebrate Conservation 2018). Infrequently mowed plots were mowed to a height of 20 cm when the canopy reached a minimum of 25 to 30 cm, once again ending in late August. Because the mowed plantings exhibited high establishment success and early flowering, the infrequent mowing treatment was implemented only in 2024. Glyphosate treatment plots were sprayed at the same rate and time as the corn. At the Musgrave site, two of the grass plots were accidentally sprayed, and one of the glyphosate plots was only partially sprayed. Data from these plots were not included in the analysis.
Data Collection
Soil samples were collected for a soil health analysis and a seedbank survey before planting. Samples were collected from Musgrave on May 16, 2024, and from Pullyen on May 17, 2024. For soil health testing, ten 15 by 5 cm soil slices were collected from the field in a zigzag pattern. Soil samples were mixed before being sent to the Cornell Soil Health Lab for analysis. Soil cores were collected on the same dates as the soil samples were collected in 2024 and on April 4, 2025. For the seedbank survey, five 20-cm soil cores (1.5-cm diameter) were taken from each treatment plot in a W-shaped pattern, with each sampling point at least 2 m from the edge of the plot and pooled across blocks. Fresh weights were recorded, as sample weight was used as a covariate for the statistical analysis. Samples were stored in a cold room at 4 C for 4 wk to break physiological dormancy. At the end of the 4 wk, samples were placed in 50 by 25 cm plastic flats for a greenhouse germination assay. The greenhouse soil mix used consisted of 0.2 m3 of peat, 0.2 m3 of vermiculite, and 0.1 m3 of perlite, as well as 1.8 kg of CaSO4, 1.8 kg of 10-5-10 N-P-K, and 2.3 kg of lime. The greenhouse temperature was kept at 22 C with a 12-h photoperiod. Flats were watered daily. Flats were inspected weekly for seedling emergence. Emerged seedlings were identified to species, counted, and then removed from the flats. Seedlings that could not be identified were allowed to grow for another week before being counted and removed. Once germination ceased, soil samples were returned to the cold room for 3 wk. Flats were returned to the greenhouse, where emergence data were collected again until germination ended.
Aboveground vegetation data were collected on July 18 and September 17 to 18, 2024, at the Musgrave site, and July 22 and September 19 to 24, 2024, at the Pullyen site. In 2025, sampling at the Musgrave site occurred on July 14 and September 22 to 24, and Pullyen sampling occurred on July 16 and September 17 to 19. Two locations were sampled in each plot using a 0.5-m2 quadrat. Sampling locations were randomized before the event based on the number of steps in the east/west and north/south direction from a corner of the plot, with a buffer zone of at least 2 m between the sampling location and the edge of the plot. Percent cover of monocots and dicots was visually estimated, and the researchers who collected these data practiced together beforehand to reduce variation in visual estimates. The number of each species present in the quadrat was recorded. During the September sampling events, biomass data were also collected. The plants in each plot were removed after being identified to species and separated into the categories of non-seeded monocot (NSM), non-seeded dicot (NSD), seeded monocot (SM), and seeded dicot (SD). Biomass samples were dried at 55 C for a minimum of 72 h before being weighed. In 2025, sampling was also conducted within the cornfield. Quadrats were placed between the third and fourth rows of corn at each sampling event, adjacent to the center of the treatment plot.
Sweep-net sampling was performed at both sites in July and August in 2024 and 2025 to assess the foraging preferences of beneficial and pest arthropods. Each plot was sampled using 10 sweep-net passes through the center of the plot at canopy height with a 39-cm-diameter canvas sweep net. Canopy height measurements were taken, and counts of the number of flowering seeded species per plot were recorded at the time of sweep net sampling. Arthropod samples were placed in a freezer after collection. Density data were collected for arthropods in two categories of interest: beneficial arthropods and corn pests. The beneficial arthropods chosen for this study were bees (clade Anthophila), lady beetles (family Coccinellidae; individuals were identified to species), and spiders and harvestmen (orders Araneae and Opiliones; combined into a single category) (Westbrook et al. Reference Westbrook, Stup, Morris, Ugine and DiTommaso2024). Corn pests identified were larvae in the family Noctuidae, Japanese beetle (Popillia japonica), corn rootworm (Diabrotica virgifera), and seedcorn maggot (Delia platura).
Yellow sticky traps measuring 10 by 20 cm (Qualirey, Shenzhen Xiankewei Network Technology, Shenzhen, China) were placed 2.5 and 7.5 m into the corn crop adjacent to the center of the plot. The traps were attached to bamboo stakes at a height of 50 cm from the ground, with the traps oriented parallel to the plots. Sticky traps were replaced once a week for a period of 6 wk between August 12 and September 24 in 2024 and August 15 and September 26 in 2025. We had originally intended to assess weed seed rain based on a protocol by De Cauwer et al. (Reference De Cauwer, Reheul, Nijs and Milbau2008), but no wind-dispersed seeds were found on the traps. Arthropods captured on the traps were processed and identified using the same procedures employed for specimens collected in the sweep-net sampling.
Pitfall traps were used to analyze ground beetle abundance within the plots to determine foraging preference (Baars Reference Baars1979). The traps consisted of a 473-ml plastic cup (Dart Containers, Mason, MI, USA) buried in the ground, flush with the surface, with a 118-ml cup (Dart Containers) placed inside the larger cup for ease of collection. Traps were placed in the center of each plot, as well as 2.5 m into the corn, adjacent to the center of the plot. Traps were established on June 13, 2025, and the collection cups were sampled and replaced weekly until August 29, 2025. Arthropod samples were placed in a freezer before identification. The beneficial arthropods identified were beetles in the families Carabidae and Staphylinidae, which were identified to genus. Pest arthropods were not assessed in this portion of the study.
Statistical Analysis
Data were analyzed in R v. 4.5.2 (R Core Team 2025) using linear mixed-effect models (package lmer) unless stated otherwise. Response variables were transformed to meet model assumptions when necessary. Significance of fixed effects was assessed using Type III ANOVA, and pairwise comparisons were made for significant factors (Tukey P-value adjustment, package emmeans). Figures were created using package ggpubr. All data has been made available within the supplementary material of this paper.
Grubb’s test was used to identify outliers. To determine whether to include problem plots (erroneously seeded at the wrong rate or sprayed incorrectly) both total and seeded species density in the problem plots was compared with the rest of the plots of that treatment at that site using Student’s t-test. It was found that the increased seeding rate did not cause a significant change in overall or seeded species density for either the grass (P = 0.5, P = 0.7) or the wildflower (P = 0.96, P = 0.1) plots, but the plots that had been sprayed incorrectly in 2024 had to be excluded from the analysis.
Seedbank density, species richness, and the Shannon diversity index were analyzed with site, treatment, and the mass of each sample at the time of collection (with no interactions) as fixed effects and compared with the corresponding aboveground diversity estimates using analysis of covariance (ANCOVA). Data were aggregated before analysis to prevent pseudo-replication. Aboveground density, species richness, the Shannon diversity index, and percent cover estimates were analyzed with year, site, treatment, and all interactions as fixed effects, and block nested within site and individual quadrats as random effects. Count data were aggregated by month for the analysis and means across both months that data were collected were used for the percent cover and Shannon diversity analyses. Separate models were developed to assess the abundance of seeded and non-seeded species, using only data from the wildflower and grass treatments.
Biomass data analyses were similarly to the aboveground density data analyses. Data for two combinations of individual quadrat and species category were lost and were not included in the analysis. The abundance of individual arthropod groups collected by sweep netting was analyzed with year, site, canopy height, and treatment as fixed effects, and block nested within site as a random effect. Total arthropod abundance within the cornfield was analyzed with collection date, distance from the edge of the cornfield, site, and treatment as fixed effects, and block nested within site as a random effect. Pitfall trap data were analyzed with collection date, site, and treatment as fixed effects, and block nested within site as a random effect.
Results and Discussion
Weed Seedbank Density and Diversity
A total of 71 species were observed in the seedbank study, of which all but three were weeds. All alpha diversity measurements in the seedbank portion of the study were most strongly influenced by site. The Musgrave site had 23 species, and the Pullyen site had 66. In addition to having less species richness, the Musgrave site also had fewer individual weeds in the seedbank. Only 1,624 individuals were counted from the Musgrave seedbank, compared with 6,934 individuals from the Pullyen site. The most frequently observed species at Musgrave was fall panicum (Panicum dichotomiflorum Michx.) (1,016 occurrences), and at Pullyen, common lambsquarters (Chenopodium album L.) (2,828 occurrences). Weed density and diversity were assessed using data from 2025, after treatments were established. Weed seedbank density within the plots was not affected by any of the explanatory variables. Weed species richness and the Shannon diversity index were affected by site (P < 0.001). Within the corn, weed density, richness, and diversity were also affected by site (P < 0.001). These results represent only the first year following treatment establishment. Consequently, the full effects of the treatments on the weed seedbank cannot be evaluated without additional germination trials conducted in subsequent years.
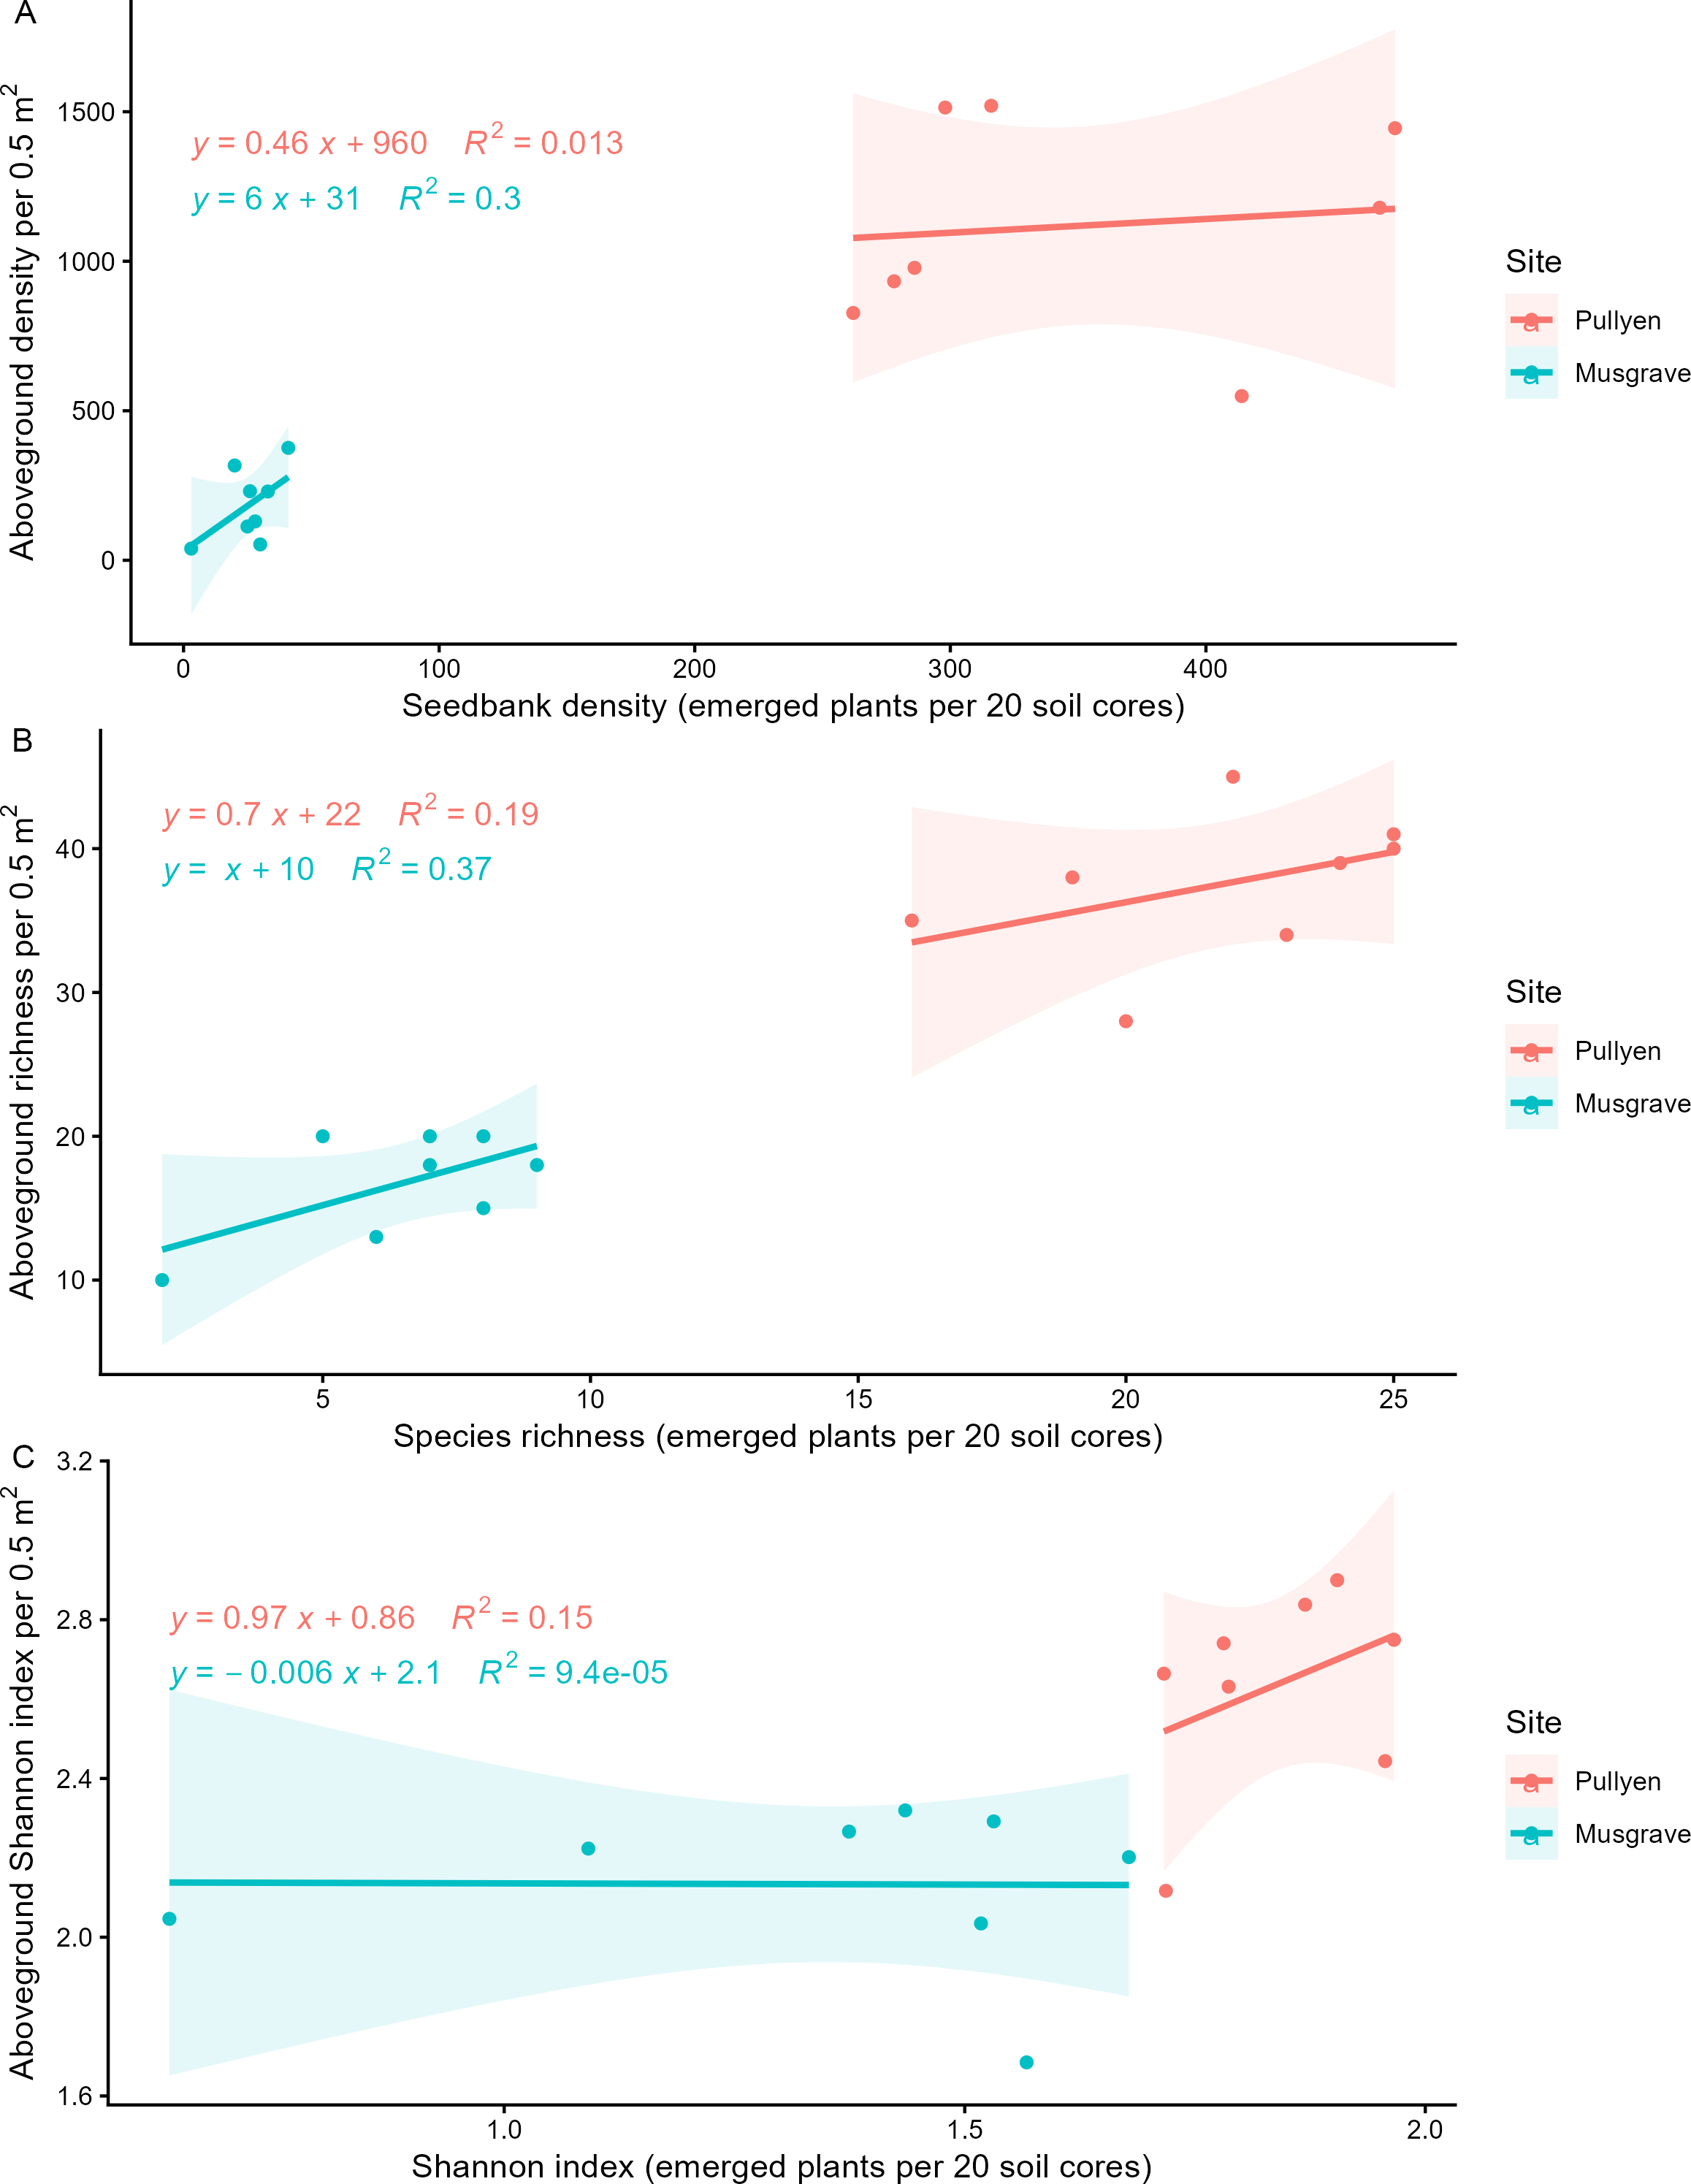
Seedbank data from 2024 were compared with data from the first aboveground sampling event in July 2024, before most emergence of the seeded species, to assess the similarity between the seedbank and the aboveground weed community. The best-fit models for aboveground weed density (Figure 1A) and richness (Figure 1B) both included the corresponding seedbank measure (insignificant, P = 0.8; insignificant, P = 0.2, respectively) and site (significant, P = 0.02; insignificant, P = 0.3, respectively). The best-fit model for the Shannon diversity index (Figure 1C) only included site (P = 0.0007). Seedbank diversity was a stronger predictor of aboveground diversity at the Pullyen site than at the Musgrave site, suggesting that a greater proportion of the weed community was recruited from the weed seedbank at Pullyen than at Musgrave.
Associations between seedbank density or diversity in May 2024 (before planting) and aboveground density or diversity in July 2024 for each treatment site in upstate New York, pooled across blocks.

Aboveground Density and Diversity
In total, 146 species were observed within the quadrats in this study, as well as a Geranium species that could not be identified beyond genus. Across all 31,860 individuals sampled across sites and years, the most abundant weed was P. dichotomiflorum (4,404 occurrences), followed by yellow foxtail [Setaria pumila (Poir.) Roem. & Schult.] (3,869), C. album (3,390), common ragweed (Ambrosia artemisiifolia L.) (2,581), common dandelion (Taraxacum officinale F.H. Wigg.) (1,280), and horseweed [Erigeron canadensis L.; syn.: Conyza canadensis (L.) Cronquist] (1,002). All other weed species were observed fewer than 1,000 times. The dominant species at the Musgrave site was P. dichotomiflorum (4,385 occurrences), and at the Pullyen site, S. pumila (3,465). Of the weeds, Setaria spp. were recently listed in a survey by the WSSA as one of the most troublesome weeds in corn, and A. artemisiifolia and C. album were listed as two of the most troublesome weeds in soybean [Glycine max (L.) Merr.] (Van Wychen Reference Van Wychen2023, Reference Van Wychen2025). Within the native grass plantings, Virginia wildrye (Elymus virginicus L.) was observed most frequently, followed by switchgrass (Panicum virgatum L.) and big bluestem [Andropogon gerardii Vitman]. Within the wildflower strips, the most common species were purple coneflower [Echinacea purpurea (L.) Moench], black-eyed Susan (Rudbeckia hirta L.), lanceleaf coreopsis (Coreopsis lanceolata L.), and partridge pea [Chamaecrista fasciculata (Michx.) Greene].
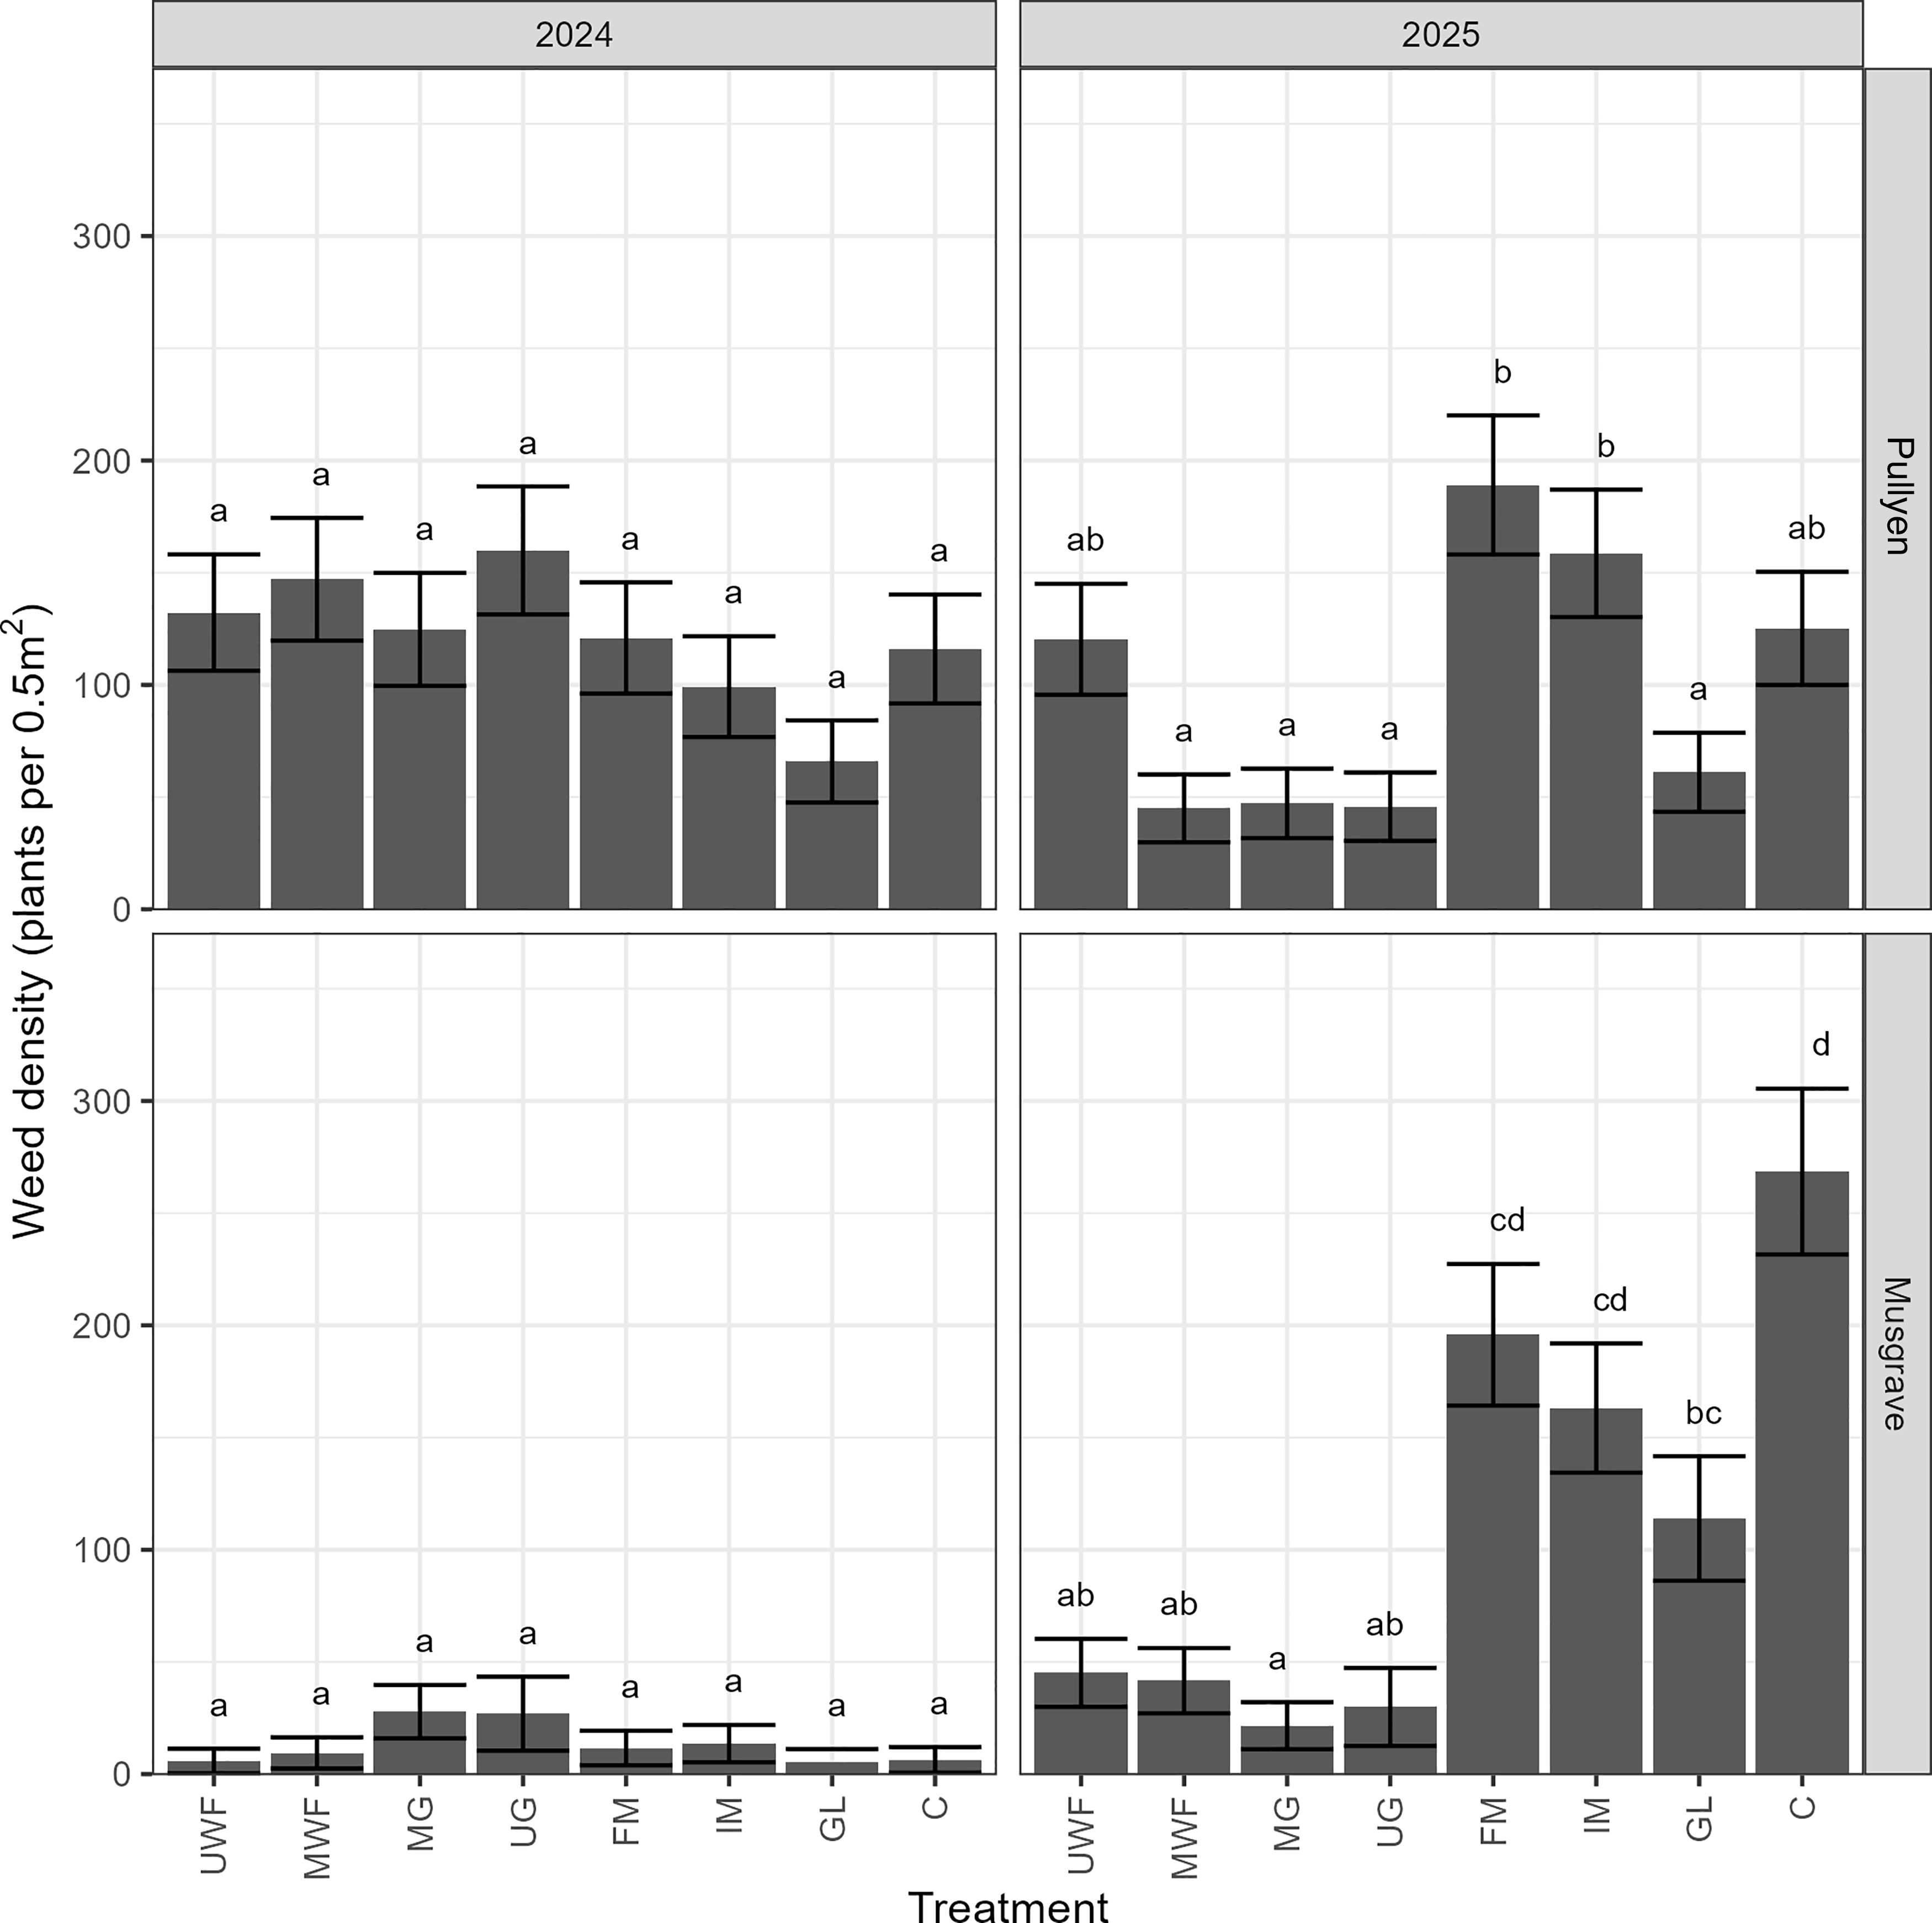
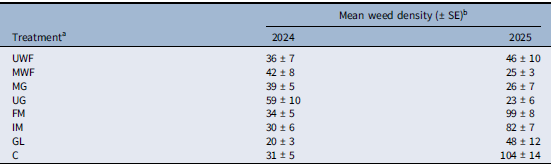
Total density was affected by treatment, year, and site, as well as by the interactions between year and site; year and treatment; and year, treatment, and site (P < 0.05). Weed density was affected by treatment, year, and site, as well as by the interactions between year and site; year and treatment; and year, treatment, and site (P < 0.001). Weed density did not vary much in the first year of the study, but after the plantings were fully established, weed density was generally lower in the field margin plantings, except for the unmanaged wildflower treatment (Figure 2; Table 1). This indicates a suppressive effect on weeds by the grass mix not observed in the wildflower mix. However, first-year mowing of the wildflower mix compensated for its lower competitive ability during establishment. The poor establishment of seeded species in the first year may have been partly attributable to the seedbed preparation method used in this study. Seedbeds were tilled at the same time as the crop, but previous research has indicated that no-till wildflower plantings have less weed cover and better establishment of flowering plant species (Angelella et al. Reference Angelella, Stange, Scoggins and O’Rourke2019). In both the unplanted mowing treatments, the unmanaged control, and to a lesser extent the glyphosate treatment, weed density increased from 2024 to 2025 (Table 1). This is most likely due to first-year tillage, resulting in a flush of ruderal weeds such as C. album and P. dichotomiflorum that grew quickly and closed the canopy. In 2025, when the soil in the margins was not disturbed, a greater number of smaller weed species were observed.
Model-estimated effect of treatment, site, and year on weed density for field studies in upstate New York. Mean ± SE across blocks within sites. UWF, unmanaged wildflower plantings; MWF, mowed wildflower planting; MG, mowed grass planting; UG, unmanaged grass planting; FM, frequent mowing; IM, infrequent mowing; GL, glyphosate application; C, unmanaged control. Within each treatment column, means with different letters are significantly different according to Tukey’s honestly significant difference (HSD) test at P ≤ 0.05.

Effect of treatment and year on weed density for field studies in upstate New York.

Table 1. Long description
The table presents the mean weed density with standard error for various treatments over the years 2024 and 2025. It consists of 8 rows and 3 columns. The columns are labeled ‘Treatment’, ‘Mean weed density (± SE) 2024’, and ‘Mean weed density (± SE) 2025’. The treatments listed are UWF, MWF, MG, UG, FM, IM, GL, and C. Each row provides the mean weed density values for the respective treatment in the years 2024 and 2025. For example, the UWF treatment shows a mean weed density of 36 ± 7 in 2024 and 46 ± 10 in 2025. The table highlights variations in weed density across different treatments and years, indicating the impact of treatments on weed density over time.
a Mean ± SE across months, sites, and blocks within sites.
b UWF, unmanaged wildflower plantings; MWF, mowed wildflower planting; MG, mowed grass planting; UG, unmanaged grass planting; FM, frequent mowing; IM, infrequent mowing; GL, glyphosate application; C, unmanaged control.
Weed density within the first 7.5 m from the edge of the cornfield was not affected by any of the explanatory variables. Except for a single R. hirta seedling at Musgrave in 2025, the entire plant community other than the crop consisted of weeds. This aligns with the results of previous research. The effects of field margins on biodiversity often extend only a short distance into adjacent crops, particularly in conventional production systems. In some cases, these effects decline sharply and become undetectable within 1 m of the crop edge (Reberg-Horton et al. Reference Reberg-Horton, Mueller, Mellage, Creamer, Brownie, Bell and Burton2011; Sutcliffe et al. Reference Sutcliffe, Schellenberg, Meyer and Leuschner2024). However, in fields where weed diversity is high and there are many flowering weeds present, the weeds within the crop can add to the benefits provided by wildflower strips (Aviron et al. Reference Aviron, Berry, Leroy, Savary and Alignier2023; Hatt and Döring Reference Hatt and Döring2024).
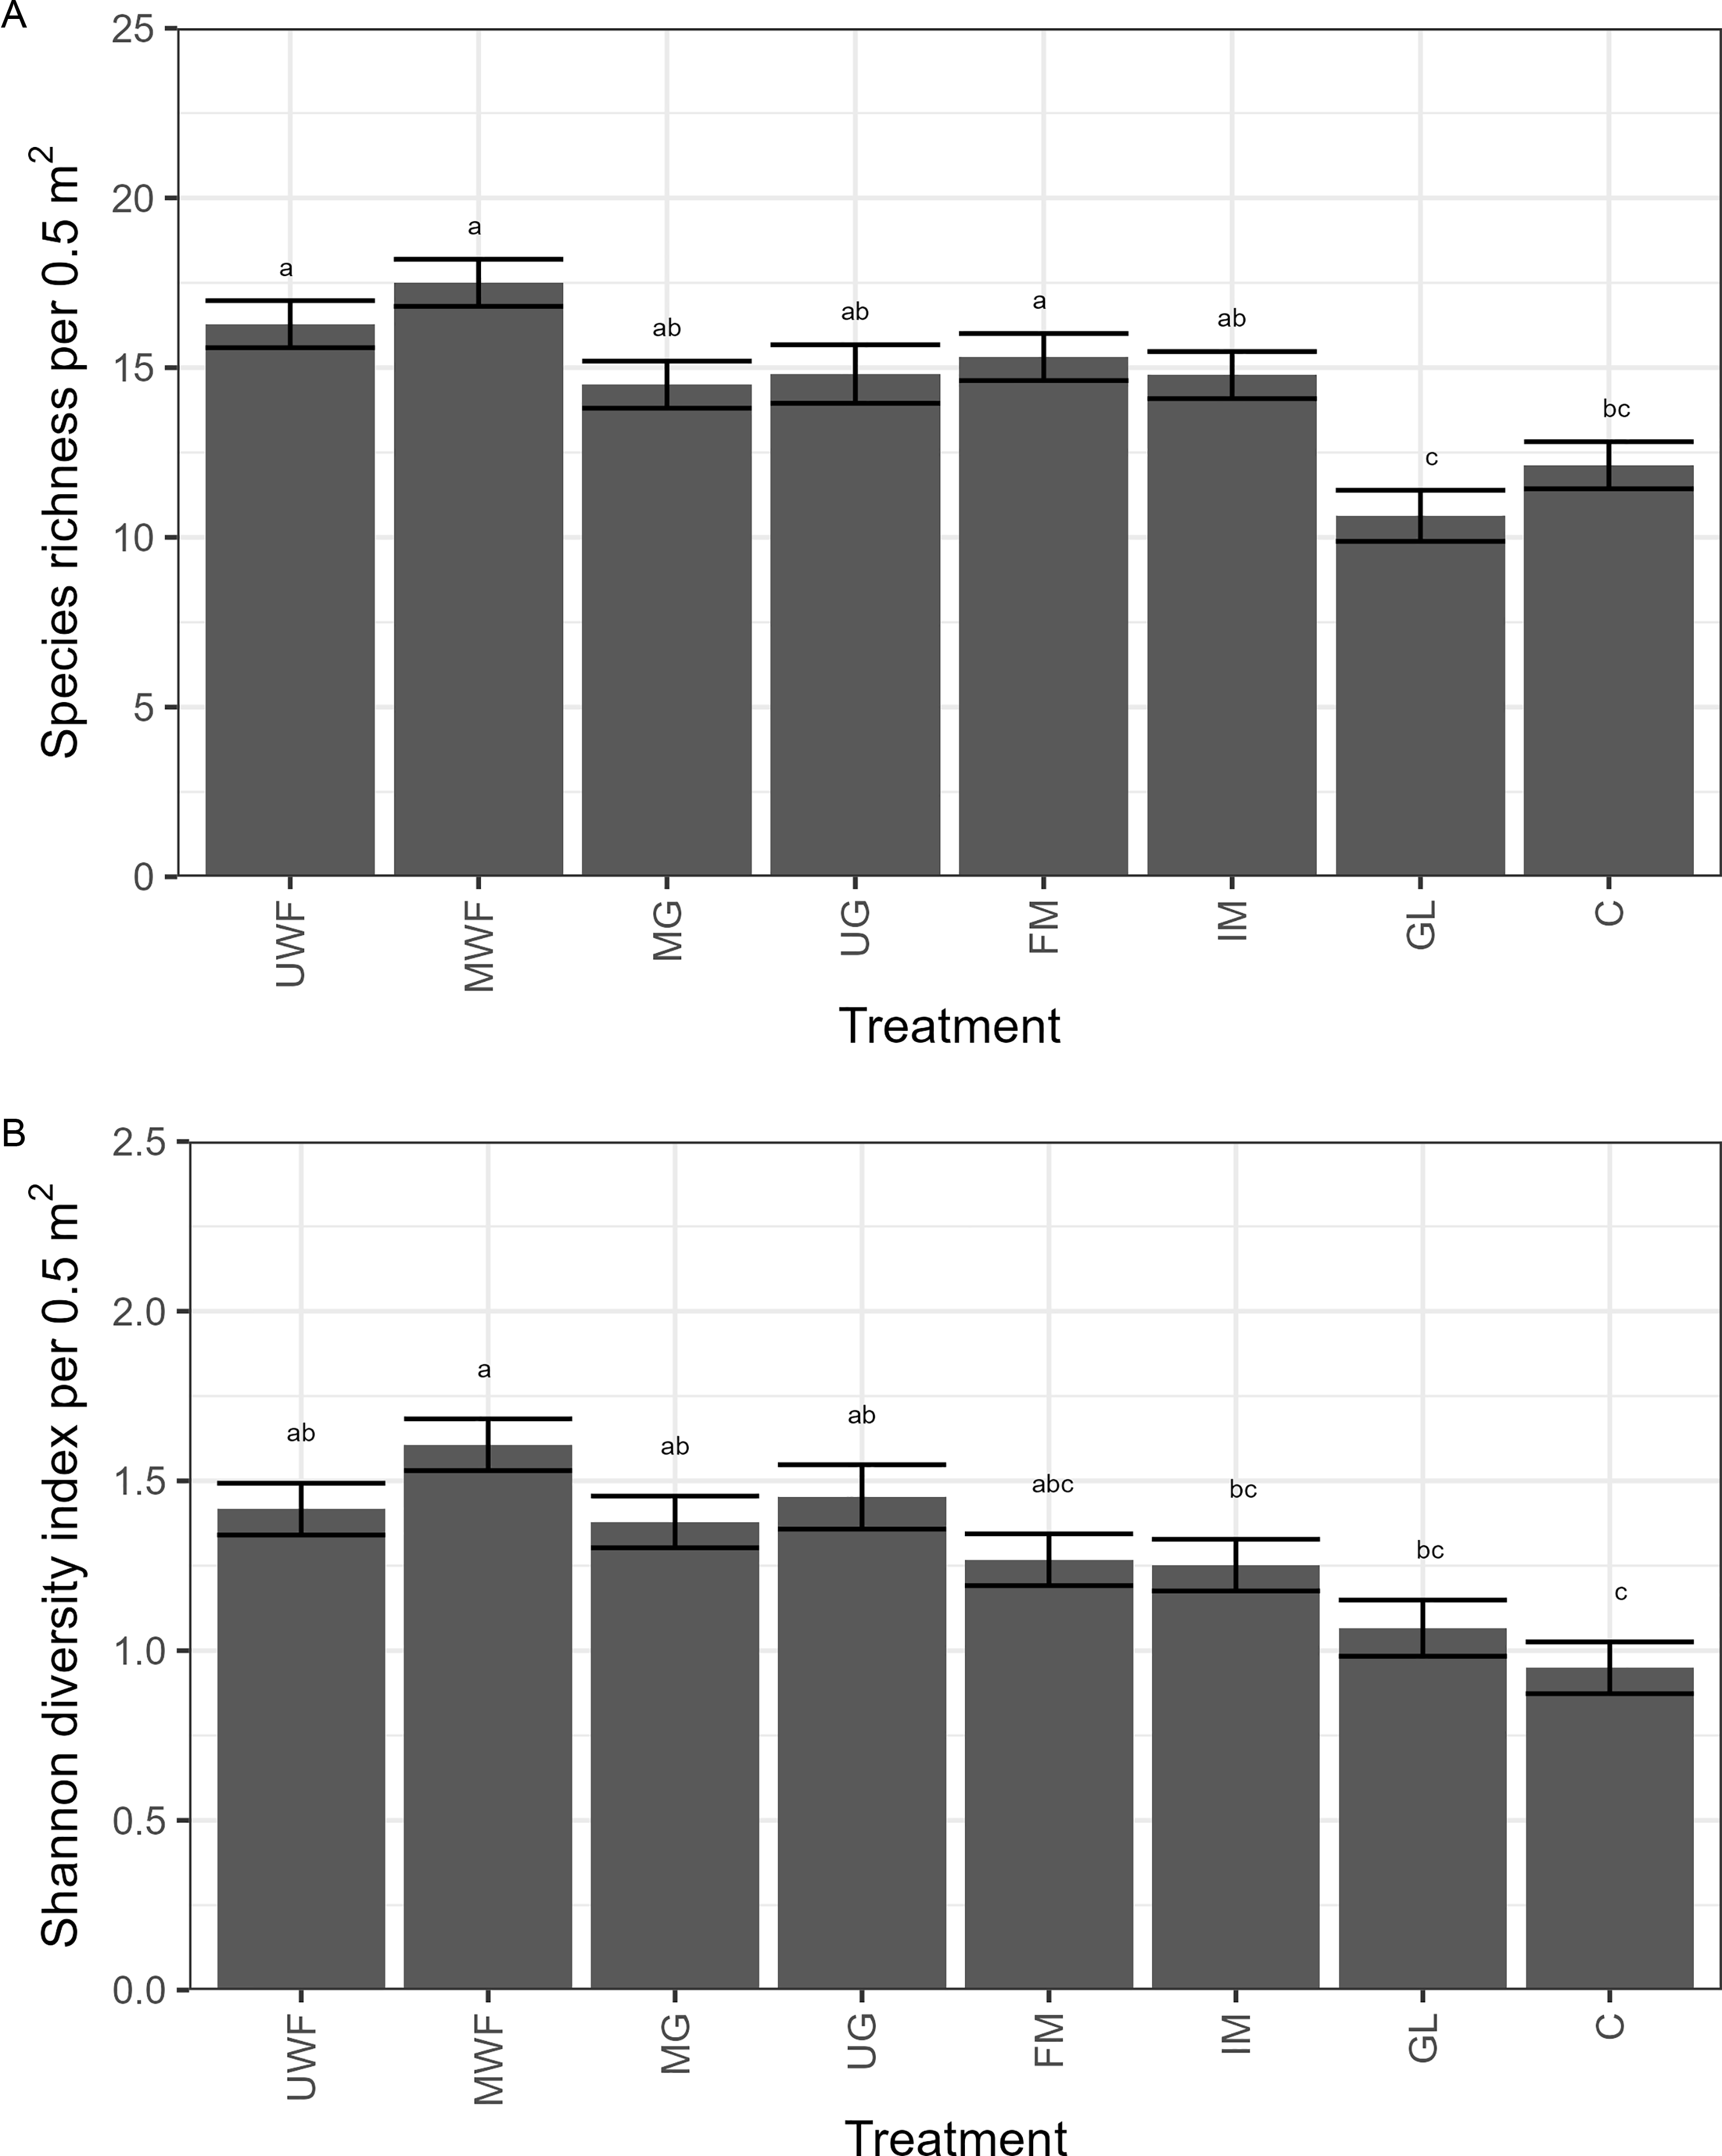
Species richness was affected by treatment, year, and site, as well as by the interactions between year and site; year and treatment; and year, treatment, and site (P < 0.05). Diversity, as calculated with the Shannon diversity index, was affected by treatment year, site, as well as by the interactions between year and site, and year, treatment, and site (P < 0.05). Species richness was lower in the glyphosate treatment than in all other treatments except for the unmanaged control (Figure 3A), and the Shannon diversity index was higher in the planted margins than in the unmanaged control (Figure 3B). Weed richness and diversity within the crop were not influenced by treatment.
Model-estimated effects of treatment on (A) species richness and (B) Shannon diversity. Mean ± SE across years, sites, and blocks within sites for field studies in upstate New York. UWF, unmanaged wildflower plantings; MWF, mowed wildflower planting; MG, mowed grass planting; UG, unmanaged grass planting; FM, frequent mowing; IM, infrequent mowing; GL, glyphosate application; C, unmanaged control. Within each treatment column, means with different letters are significantly different according to Tukey’s honestly significant difference (HSD) test at P ≤ 0.05.

Weed Seed Rain
No wind-dispersed weed seeds were found on the sticky cards for the duration of the 6-wk study in 2024, and a single thistle (Cirsium spp.) seed was found in 2025. This does not mean that there was no wind dispersal of weed seeds into the corn or that field margins are not a source of weed seed rain into crops. Rather, this pattern was likely attributable to the orientation of prevailing winds relative to the field at the Musgrave site and to the limited adaptation of the dominant species at the Pullyen site for wind-mediated seed dispersal.
Ground Cover
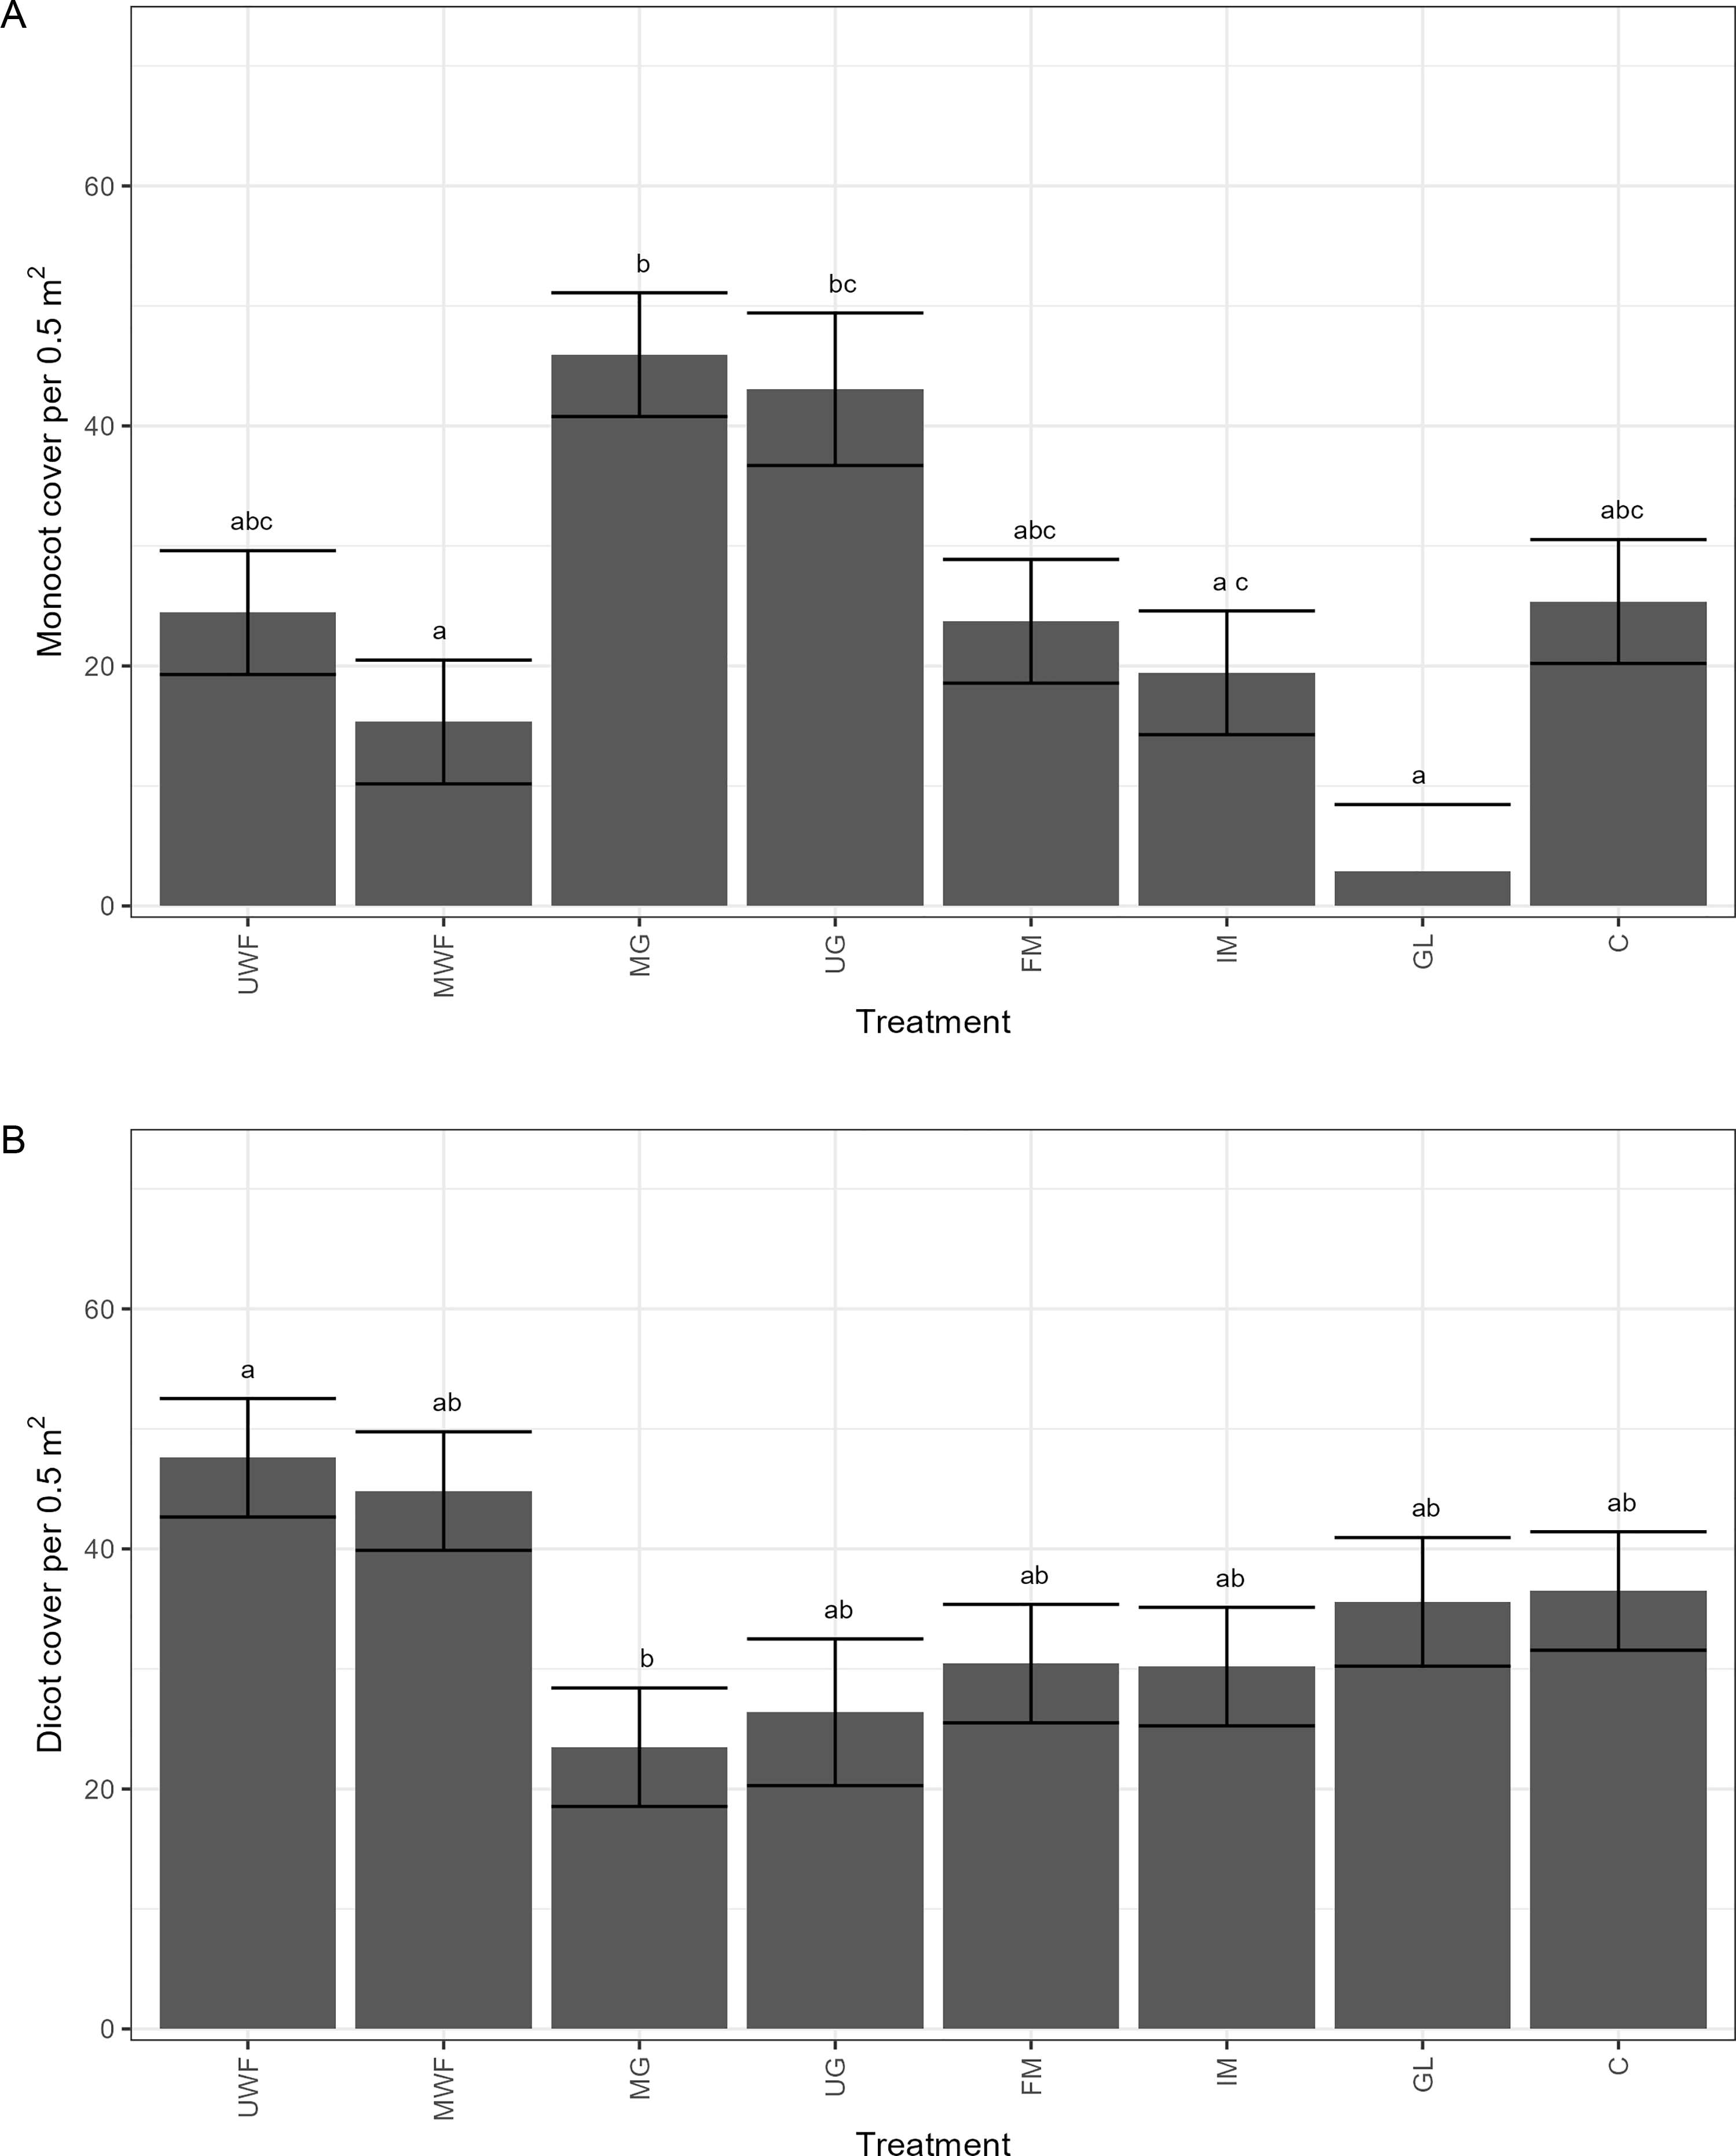
Total ground cover within field margins was affected by treatment, year, and site, as well as by the interactions between year and site; year and treatment; and year, treatment, and site (P < 0.05). Monocot cover was affected by treatment, and year, as well as by the interactions between year and treatment; year and site; and year, plot, and site (P < 0.05). Sprayed margins had the least monocot cover, which was less than both planted grass treatments but comparable to all other treatments (Figure 4A). Dicot cover was affected by treatment, year, and site, as well as by the interactions between year and treatment; and year, site, and treatment (P < 0.05). Dicot cover was greater in the unmanaged wildflower plantings than in the managed grass plantings, and all other treatment levels were comparable (Figure 4B). Ground cover within the corn was not affected by any of the explanatory variables.
Model-estimated effects of treatment on (A) monocot cover and (B) dicot cover. Mean ± SE across year, sites, and blocks within sites for field studies in upstate New York. UWF, unmanaged wildflower plantings; MWF, mowed wildflower planting; MG, mowed grass planting; UG, unmanaged grass planting; FM, frequent mowing; IM, infrequent mowing; GL, glyphosate application; C, unmanaged control. Within each treatment column, means with different letters are significantly different according to Tukey’s honestly significant difference (HSD) test at P ≤ 0.05.

Biomass
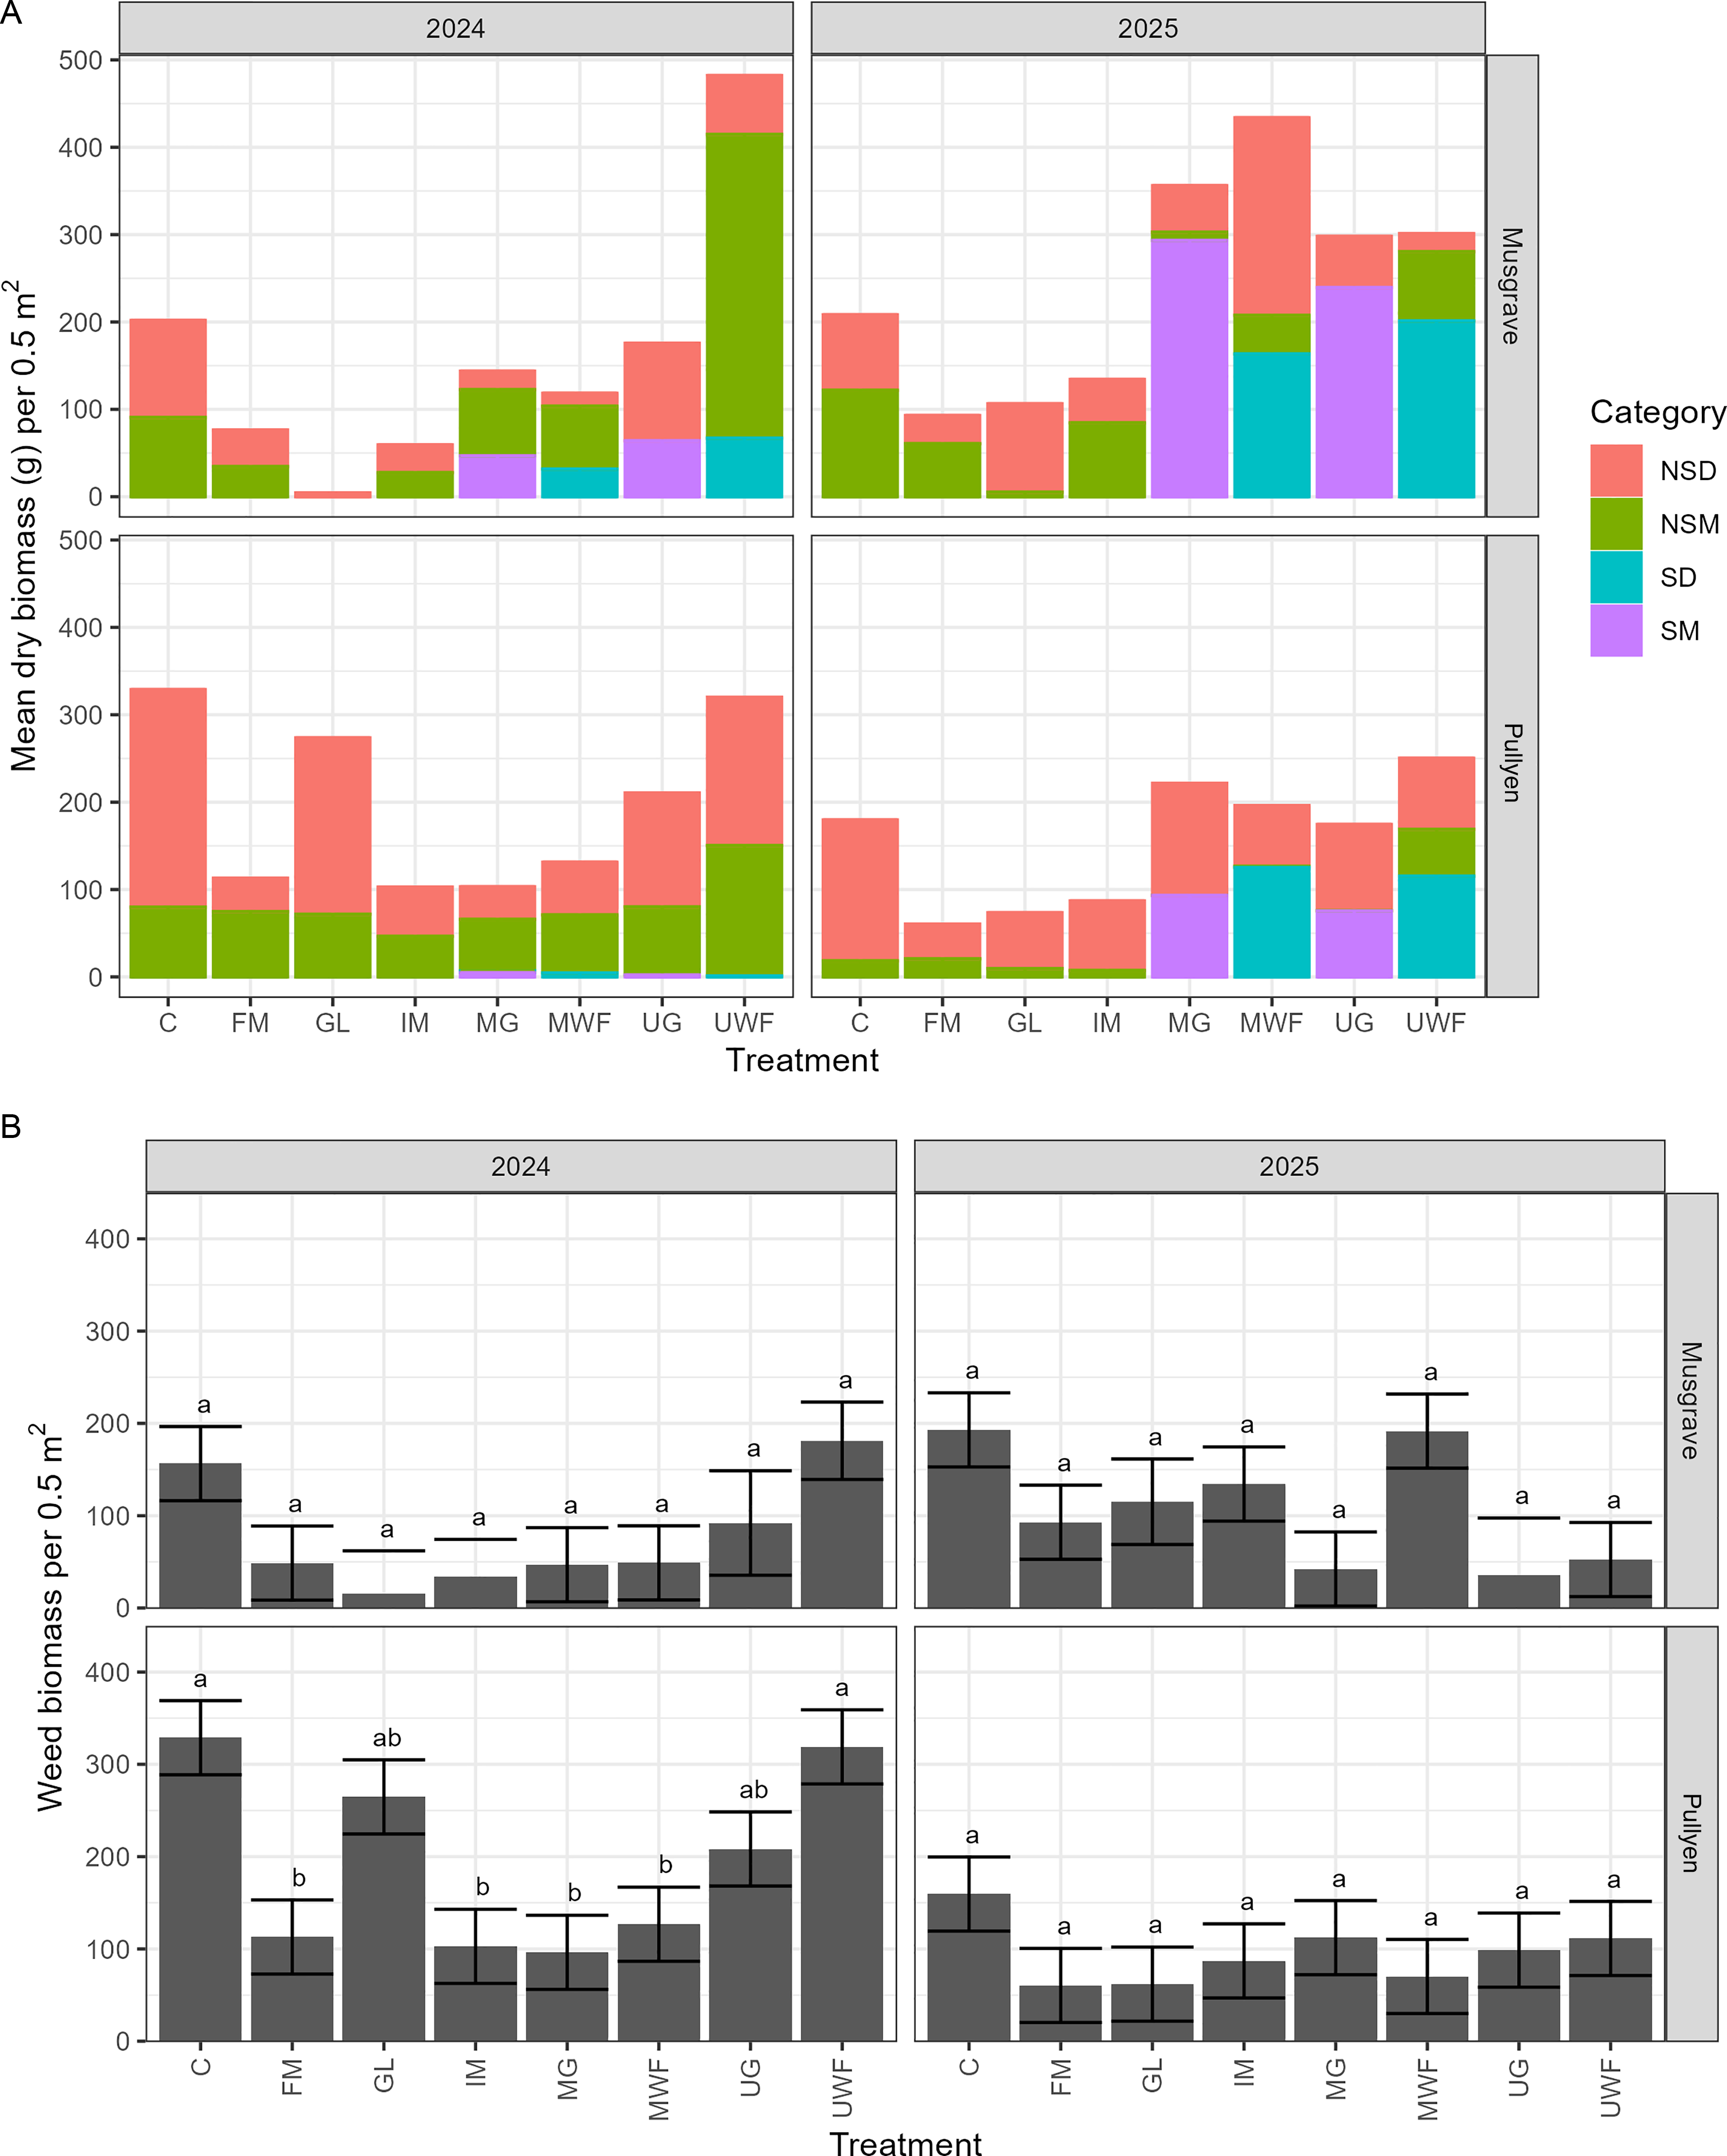
Total biomass within the plots was affected by treatment (P < 0.001), year, and site, as well as by all possible first-order interactions between the three (P < 0.05; Figure 5A). Biomass within the corn was not affected by any of these factors. The biomass of only weedy species within the plots was affected by treatment (P = 0.002) and year (P = 0.002), as well as by the interactions between site and year (P < 0.001); treatment and year (P < 0.001); and site, treatment, and year (P = 0.01). Despite the effect of treatment in the model, treatment means only significantly differed at the Pullyen site in 2024 according to Tukey’s honestly significant difference (HSD) (Figure 5B).
Model-estimated effects of treatment, year, and site on (A) total biomass and (B) weed biomass for field studies in upstate New York. Mean ± SE across blocks within sites. NSD, non-seeded dicot; NSM, non-seeded monocot; SD, seeded dicot; SM, seeded monocot. UWF, unmanaged wildflower plantings; MWF, mowed wildflower planting; MG, mowed grass planting; UG, unmanaged grass planting; FM, frequent mowing; IM, infrequent mowing; GL, glyphosate application; C, unmanaged control. Within each treatment column, means with different letters are significantly different according to Tukey’s honestly significant difference (HSD) test at P ≤ 0.05.

Arthropod Abundance
The two most frequently captured pest arthropod species in this study were D. virgifera and P. japonica, each observed 38 times. The most commonly observed lady beetle species were the pink spotted lady beetle (Coleomegilla maculata; 96 occurrences), the Asian lady beetle (Harmonia axyridis; 27), and the fourteen-spotted lady beetle (Propylea quatuordecimpunctata.; 26). All other species of adult lady beetles were observed fewer than 20 times, and 155 larvae were observed. Bees were not identified to species, but anecdotally, most of the bees observed in this study were quite small and likely belonged to the family Halictidae. Bee abundance was affected by the interaction between treatment and site (P < 0.001) and the interaction between site, plot, and year (P = 0.002). Lady beetle abundance and the abundance of spiders and harvestmen (Araneae and Opiliones) were not affected by any of the explanatory variables. Similar patterns were observed in the sticky card samples collected within the corn crop, where spiders and harvestmen were the only arthropod group of interest whose abundance was affected by treatment. Spider and harvestman abundance within the crop was affected by treatment (P = 0.04) and site (P = 0.01). Treatment means only varied at the Musgrave site, and only at a distance of 2.5 m from the edge of the crop. This is consistent with previous literature, in that there is typically limited arthropod spillover from field margins into the crop, which decreases with distance from the margin; however, it is somewhat contradictory to previous literature that the presence of a margin planting did not have much of an effect on arthropod abundance (Albrecht et al. Reference Albrecht, Kleijn, Williams, Tschumi, Blaauw, Bommarco, Campbell, Dainese, Drummond, Entling, Ganser, Arjen De Groot, Goulson, Grab and Hamilton2020; Denys and Tscharntke Reference Denys and Tscharntke2002; Gonzalez et al. Reference Gonzalez, Štrobl, Venturo, Pařízek, Tajovský and Knapp2025; Kujawa et al. Reference Kujawa, Bernacki, Kowalska, Kujawa, Oleszczuk, Sienkiewicz and Sobczyk2020).
The four most common genera of ground beetles (Carabidae) observed in the pitfall trap portion of this study were Harpalus spp. (2,012 occurrences), Poecilus spp. (1,918), and Chlaenius spp. (570). All other genera of ground beetles were observed fewer than 500 times. Carabid abundance was not affected by treatment in either the margins or the cornfields. It is important to note that this component of the study was conducted for only a single year; therefore, the lack of temporal replication limits the strength of any conclusions that can be drawn.
The lack of treatment effect on the arthropod groups in this study was unexpected. Previous research has found that sprayed or unplanted field margins have less arthropod diversity than sown margins (Denys and Tscharntke Reference Denys and Tscharntke2002). Margin plantings, especially those containing wildflowers, are generally attractive to and increase the abundance and diversity of multiple taxa of beneficial arthropods, including pollinators, predators of pest insects, and seed predators (Haaland et al. Reference Haaland, Naisbit and Bersier2011; Kowalska et al. Reference Kowalska, Antkowiak, Tymoszuk, Matysiak and Sienkiewicz2025; Magagnoli et al. Reference Magagnoli, Bosi, Negri, Dinelli, Burgio and Masetti2024). On the other hand, weedy areas can increase pest arthropod abundance, such as the European corn borer (Ostrinia nubilalis), which prefers these sites for mating (Showers et al. Reference Showers, Reed, Robinson and Derozari1976). These effects may have been less pronounced in this study because both field sites were situated within relatively heterogeneous landscapes, with nearby forested areas and residential gardens, unlike the more homogeneous landscapes typical of intensive cropland.
For some ecosystem services, such as control of natural enemies, the amount of semi-natural land is a driving factor (Veres et al. Reference Veres, Petit, Conord and Lavigne2013). This experiment may have taken place in too complex a landscape for any effects of margin plantings on arthropod abundance to be visible. According to the intermediate landscape-complexity hypothesis, local conservation efforts are generally most effective in simple, low-complexity landscapes (Tscharntke et al. Reference Tscharntke, Tylianakis, Rand, Didham, Fahrig, Batáry, Bengtsson, Clough, Crist, Dormann, Ewers, Fründ, Holt, Holzschuh and Klein2012). Additionally, the limited spatial scale of the experiment may have contributed to the absence of significant treatment effects. As the plots were only 8 m apart within a block and 30 m apart between blocks, it would be very easy for many of the arthropods sampled in this study to move between plots.
Implications for Management
The role of the soil seedbank in shaping plant community structure and dynamics within field margins remains uncertain. Landscape-level factors that cannot be easily influenced by management can shape margin communities and, in some cases, exert greater influence than the seedbank itself (Boinot et al. Reference Boinot, Alignier and Storkey2024; Sosnoskie et al. Reference Sosnoskie, Luschei and Fanning2007; Tarmi et al. Reference Tarmi, Helenius and Hyvönen2011). However, it is also possible for margin plantings to be dominated by species from the seedbank (Kowalska et al. Reference Kowalska, Antkowiak and Tymoszuk2023). If flowering species with value as a resource for beneficial arthropods are present in the seedbank, they can complement sown species, especially during the first year of establishment (Bihaly et al. Reference Bihaly, Piross, Pellaton, Szigeti, Somay, Vajna, Soltész, Báldi, Sárospataki and Kovács-Hostyánszki2024).
It is possible for seeded species, especially grasses, to have a suppressive effect on problematic weed species (Bokenstrand et al. Reference Bokenstrand, Lagerlöf and Torstensson2004; Bryan et al. Reference Bryan, Sipes, Arduser, Kassim, Gibson, Scott and Gage2021; Critchley et al. Reference Critchley, Fowbert, Sherwood and Pywell2006; Marshall and Moonen Reference Marshall and Moonen2002). In hedgerows, a type of field margin containing woody plants, margin vegetation not only suppressed weeds but reduced their intrusion into the adjacent crop (Long and Valliere Reference Long and Valliere2025). As expected, seeded field margins contained fewer individual weeds than unseeded margins. However, the weeds present in the plantings were often larger, resulting in minimal differences in weed biomass across treatments. It is worth noting that while the margin plantings in this study may not have fully suppressed weeds, contrary to farmer concerns, they did not increase weed pressure within the adjacent crop.
While our data did not reflect any strong effect of mowing within plantings, growers should still consider mowing as a means of controlling weeds. Mowing has been associated with increased species richness and diversity, as well as flower abundance, and does not favor problematic weeds (Genty et al. Reference Genty, Meynard, Bopp, Henckel, Chayre, Gibert and Fried2026; Piqueray et al. Reference Piqueray, Gilliaux, Decruyenaere, Cornelis, Uyttenbroeck and Mahy2019; Tarmi et al. Reference Tarmi, Helenius and Hyvönen2011). Mowing infrequently before establishment of biodiversity plantings has been shown to decrease weed cover once the plantings are established (Perkins et al. Reference Perkins, Walters, Rowe, Brokaw, Gedlinske, Anderson, Wang and Isaacs2024). However, mowing within plantings will not prevent weeds within the margin from increasing to unacceptable levels by 5 yr after establishment (Piqueray et al. Reference Piqueray, Gilliaux, Decruyenaere, Cornelis, Uyttenbroeck and Mahy2019). Plantings may need to be reestablished every few years if weed pressure increases too much over time. Even if plantings are not established, mowing might still be a preferable alternative to spraying field edges. In this study, for all measurements other than weed density, glyphosate application was not superior to mowing treatments in either suppressing weeds or promoting biodiversity. Additionally, spraying the margins can negatively impact diversity over long periods and select for weedy species (Boinot et al. Reference Boinot, Alignier and Storkey2024).
Supplementary material
To view supplementary material for this article, please visit https://doi.org/10.1017/wsc.2026.10141
Acknowledgments
We thank members of the DiTommaso Lab, the greenhouse staff, and the staff at the Cornell Agricultural Experiment Stations, especially Gene Sczepanski and Brian Lanphere.
Funding statement
Funding for this project was provided by the Cornell University Agricultural Experiment Station, using Federal Capacity Funds from the U.S. Department of Agriculture’s National Institute of Food and Agriculture: project accession no. 7005300.
Competing interests
The authors declare no conflicts of interest.


 Open access

