α-Lactalbumin (α-la) is a small, acidic and hydrophilic metalo-protein present in milk of all mammals (Hill & Brew, Reference Hill and Brew1975). Several functions have been ascribed to α-la during the neonatal period. One of the most important biological functions of this protein is to participate as the non-catalytic regulatory subunit (specifier component) in lactose synthase complex (Calderone et al. Reference Calderone, Giuffrida, Viterbo, Napolitano, Fortunato, Conti and Acharya1996). Recently, a folding variant of α-la was shown to induce apoptosis in tumor and immature cells (Casbarra et al. Reference Casbarra, Birolo, Infusini, Dal Piaz, Svensson, Pucci, Svanborg and Marino2004). It has been suggested that active form of α-la may reduce the pool of potentially malignant cells in gut, inducing their apoptosis (Svensson et al. Reference Svensson, Hakansson, Mossberg, Linse and Svanborg2000). Native α-la consists of a large α-helical domain (composed of three major α-helices and two short 310-helices) and a small β-sheet domain (composed of a series of loops and of a small three-stranded anti-parallel β-pleated sheet), which are connected by a calcium-binding loop. A deep cleft between them divides two domains (Permyakov & Berliner, Reference Permyakov and Berliner2000). Two hydrophobic regions (called aromatic clusters I and II) are located in the interior of the globular structure (Chrysina et al. Reference Chrysina, Brew and Acharya2000) and four disulphide bridges also stabilize the structure of this protein (Kuhlman et al. Reference Kuhlman, Boice, Wu, Fairman and Raleigh1997).
One of the most interesting features of α-la is its ability to bind metal cations. The protein has a high affinity calcium-binding site in a loop between two helices and has multiple binding sites for other physiologically significant cations (Vanhooren et al. Reference Vanhooren, Vanhee, Noyelle, Majer, Joniau and Janssens2002). Calcium binding strongly influences the α-la tertiary structure, molecular stability and is required for the formation of disulphide bond in the reduced and denatured α-la (Rao & Brew, Reference Rao and Brew1989).
Since α-la is known to adapt different folds as a response to the medium condition, it has been extensively used in protein folding studies (Lala & Keul, Reference Lala and Keul1992). α-La is known to be a very suitable protein object for elucidation of protein folding mechanism and one of the most popular model systems for studies of molten globule (MG) state, which generally contains native-like secondary structures but lacks stable tertiary structures (Paci et al. Reference Paci, Smith, Dobson and Karplus2001). The calcium-depleted apo-form of α-la at neutral pH can be induced to adopt a partly unfolded state or MG upon moderate heating (Griko & Remeta, Reference Griko and Remeta1999). On the other hand, the acid state (A-state) of this protein at very low pH values, so called the classical MG state, produced calcium release during protonation of its binding sites (Hill & Brew, Reference Hill and Brew1975). Since α-la has many important biological functions, which depend on the conformational states, the interest in the molecular and biological properties of this protein continues. Most of the studies on α-la were carried out using bovine or human proteins. Camel milk contains α-la with a concentration around 2·2 mg/ml. Camel milk also lacks β-lactoglobulin (Haddadin et al. Reference Haddadin, Gammoh and Robinson2008; El-Hatmi et al. Reference El-Hatmi, Levieux and Levieux2006, Reference El-Hatmi, Girardet, Gaillard, Yahyaoui and Attia2007). To our knowledge, most of the studies on the stability of camel milk proteins were done on total milk (Farah, Reference Farah and Atkins1992; Elagamy, Reference Elagamy2000) or total whey proteins (Farah, Reference Farah1986; Levieux, Reference Levieux, Levieux, El-Hatmi and Rigaudière2006; Laleye, Reference Laleye, Jobe and Wasesa2008). Study of pure camel α-la in a controlled buffering condition may give more particular information about its structure and heat stability.
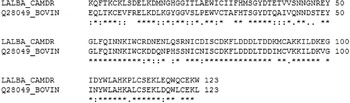
Conti et al. (Reference Conti, Godovac Zimmermann, Napolitano and Liberatori1985) reported there are two variants of α-la in camel milk. Generally camel α-la is composed of 123 amino acids (Beg et al. Reference Beg, von Bahr-Lindstrom, Zaidi and Jornvall1985) and has a molecular mass of 14·43 kDa whereas its bovine counterpart with the same number (but somewhat different composition) of amino acid residues has a molecular mass of 14·18 kDa. According to the sequence alignment data (Fig. 1), the similarity and identity between these proteins are 82·9 and 69·1%, respectively. These similarities and differences and also potential ability of α-la to adopt cytotoxic MG-like state folding have stimulated the present study. It was aiming to investigate the differences in the structures and stabilities between camel and bovine α-la in apo and calcium saturated (holo) states in comparative biophysical studies such as differential scanning calorimetry (DSC), fluorescence and circular dichroism (CD).
Sequence alignment of bovine and camel α-La. Protein sequence alignment was done with CLUSTALW (v. 2.0.11; http://www.ebi.ac.uk). PubMed accession numbers are P00710 (camel) and Q28049 (bovine). Identical (*), conserved (:) and semi-conserved (.) amino acids in two sequences are marked.

Material and Methods
Milk from camel (Camelus dromedarius) was provided by the Department of Clinical Sciences and Faculty of Veterinary Medicine of the University of Tehran. Bovine α-la was obtained from Sigma chemical Co. Other chemicals were of analytical grade (Sigma) and used without further purification. All solutions prepared with double distilled water were kept at 4°C until use.
Purification of camel α-la
After defatting, major fractions of caseins and whey proteins of camel milk were precipitated using ammonium sulphate (26·4%). The supernatant was dialyzed against double distilled water for 96 h at 4°C and applied to an UF membrane (cut off 30 kDa). The filtrate collected was applied to another UF membrane (cut off 10 kDa) to increase the protein concentration. The purity (>97%) of α-la sample prepared by this method, was estimated by SDS-PAGE (15% acrylamide gel; Schägger & von Jagow, Reference Schägger and von Jagow1987) by Coomassie blue staining. Purified camel α-la, which was retained on 10 kDa UF membrane, was collected and lyophilized for further usages.
Preparation of apo-form of camel α-la
Camel apo α-la was generated from the native protein by dissolving it in 20 mm-Tris-HCl buffer, pH 7·5, containing 3·5 mm-EDTA removing bound calcium (Svensson et al. Reference Svensson, Hakansson, Mossberg, Linse and Svanborg2000). The induced conformational change and the increase of exposure of hydrophobic sites on the surface of apo-form of α-la were confirmed by CD spectroscopy and the increase of 8-anilino-1-naphthalenesulfonic acid (ANS)-fluorescence, respectively.
Protein assay
The protein concentration was determined using the Bradford reagent (Bio-Rad) with bovine serum albumin (BSA) as the standard protein (Bradford, Reference Bradford1976).
Calorimetric measurements
DSC measurements of α-la samples (70 μm) were carried out in an N-DSC II differential scanning calorimeter having 0·324 ml cell at a heating rate of 2 K/min. All buffers and samples were thoroughly degassed by stirring in an evacuated chamber at room temperature. Prior to the loading, the instruments and the cells were pressurized to about 2 atm to prevent the formation of gas bubbles during the heating. Subtraction of the buffer baseline was performed and the values of T m, ΔS, ΔH cal, ΔH vH, and ΔC p were calculated from thermograms using CpCalc software (version 2.1). The reversibility of the unfolding was checked routinely by re-heating of the cooled sample immediately following the first scan. The thermodynamic parameters of camel and bovine α-la unfolding are presented in Table 1 and are the average of three replications.
The thermodynamic parameters of thermal unfolding of bovine and camel proteins in calcium loaded (holo) and calcium depleted (apo) states

Fluorescence spectroscopy
Fluorescence intensity was measured with a Cary Eclipse spectrofluorimeter (Varian, Australia). Intrinsic tryptophan fluorescence was measured in protein solutions (10 μm in 20 mm-Tris-HCl buffer, pH 7·5). All experiments were performed using a 1-cm path length fluorescence cuvette, 5 nm slit size and excitation wavelength of 280 nm.
The assessment of ANS binding by apo- and holo-forms of bovine and camel α-la was carried out after 15 min incubation with 20 μm-ANS. During fluorescence measurements of ANS-α-la complex (excitation 385 nm), the emission spectra were recorded between 400 and 600 nm on Cary-Eclipse spectrofluorimeter. The bandwidths for both excitation and emission were 10 nm.
CD-measurements
The CD spectra of camel and bovine α-la (holo- and apo-forms) were recorded on a Jasco J-810 instrument equipped with a thermoelectric sample holder. A cuvette of 1-mm path length was used. The protein concentration in the CD experiments was 15 μm. The results were expressed in molar ellipticity [θ] (deg cm2 dmol−1) based on a mean amino acid residue weight (MRW) of 115·3 for bovine α-la (Yang et al. Reference Yang, Zhang, Chen and Liang2006) and 117·3 for camel α-la. The molar ellipticity was determined as [θ]λ=(100 MRW θobs/cl), where θobs is the observed ellipticity in degrees at a given wavelength, c is the protein concentration in mg/ml and l is the length of the light path (cm). Secondary structure estimation from the far-UV CD spectra was calculated using circular dichroism spectra by neural networks (CDNN) (Böhm et al. Reference Böhm, Muhr and Jaenicke1992). Changes of the secondary structures of camel and bovine α-la have been followed by monitoring the ellipticity at 222 nm in the far-UV region. Temperature scans were performed stepwise, allowing the sample to equilibrate at each temperature for at least 3 min. The average of three measurements was plotted, and error bars indicate the standard deviation from the mean. Data were fitted with sigmoidal curve using SigmaPlot 10.0 software.
Results and Discussion
Camel and bovine α-la heat denaturation measurements
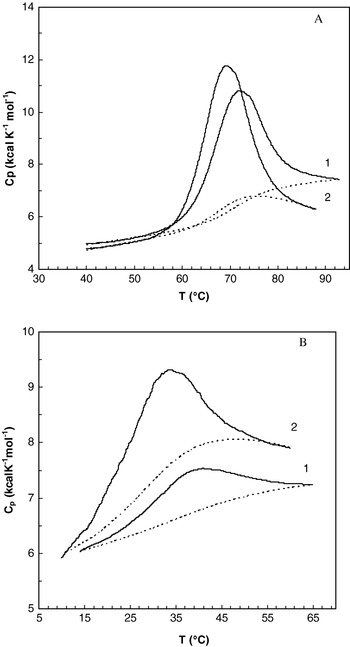
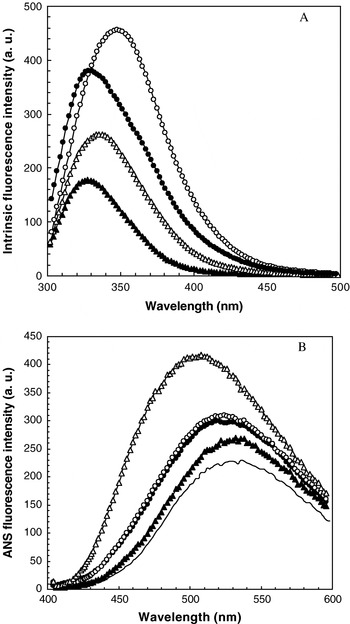
DSC thermogram shows the excess heat capacity (Cp, sample minus reference buffer) as a function of temperature. In this study, camel and bovine α-la in 2 mm-calcium as well as in 3·5 mm-EDTA was heated and their unfolding was followed by DSC. The thermograms obtained for all proteins showed classic single endothermic peak typical of protein denaturation (Fig. 2). The heat capacity change upon unfolding (ΔCp) is the thermodynamic property that can be connected most directly to the exposure of hydrophobic surface areas and disorganization of water shell around the protein (Gómez et al. Reference Gómez, Hilser, Xie and Freire1995).The change in heat capacity between the native and unfolded sates (ΔCp) of camel and bovine α-la in the presence of calcium was found to be 1·7 and 0·8 kcal mol−1 K−1, respectively. Higher ΔCp of camel α-la than that of bovine counterpart under the same experimental conditions suggests a greater contribution of hydrophobic interactions to the stability of camel α-la than in its bovine counterpart. Sequence comparison of bovine and camel α-la shows greater hydrophobicity of the amino acid sequence 25–35 in the hydrophobic core (see Fig. 1). This is in good agreement with the higher ΔCp and higher intensity of ANS fluorescence (Fig. 3B) observed for holo camel α-la.
Plot of measured heat capacity against temperature for camel (1) and bovine (2) α-La in 20 mm-Tris-HCl, pH 7·5, in the presence of (A) 2 mm-CaCl2 (holo form) or (B) 3·5 mm-EDTA (apo form). Protein concentration was 70 μm. Dashed lines represent the polynomial baseline fit.

The intrinsic (A) and ANS fluorescence emission spectra (B) of 10 μm-camel apo α-la (○), camel holo α-la (•), bovine apo α-la (▵), bovine holo α-la (▴), and ANS alone (-) in 20 mm-Tris-HCl, pH 7·5, in the presence of 2 mm-CaCl2 (holo form) or 3·5 mm-EDTA (apo form) at 20°C. The excitation wavelengths were 280 nm (A) and 350 nm (B) with slits of 5 and 10 nm, respectively.

The enthalpy of denaturation (ΔH) depends on the temperature at which denaturation occurs as judged by the area of heat absorption peak (Sanchez-Ruiz, Reference Sanchez-Ruiz1995). In Fig. 2, the dashed line represents the polynomial baseline fit with the area under the curve representing the calorimetric enthalpy (ΔH) and the peak of the curves representing the midpoint of the unfolding transition (Tm). Values of calorimetric enthalpy (ΔHcal), van't Hoff enthalpy (ΔHvH), ΔCp and Tm deduced from the thermograms are given in Table 1. Larger enthalpy change for bovine α-la in similar solvent conditions indicates that larger amount of energy is necessary for its unfolding as compared with the camel protein counterpart (Hendrix et al. Reference Hendrix, Griko and Privalov2000). The enthalpy of denaturation we found for camel α-la is more than what Levieux et al. (Reference Levieux, Levieux, El-Hatmi and Rigaudière2006) have reported before. This might be because of differences in methods or solvent conditions; they obtained thermodynamic parameters indirectly by immunochemical method for camel α-la in milk.
As reported in Table 1, the ΔHvH/ΔHcal ratio of the camel protein is close to one, indicating that the heat unfolding follows two state process (Sturtevant, Reference Sturtevant1987), similar to what was reported previously for bovine α-la in similar solvent conditions (Griko et al. Reference Griko, Freire and Privalov1994). Superimposition of the DSC curves for all α-la upon re-heating of the cooled sample shows that the unfolding transition is reversible for all of them. As reflected by its Tm, bovine α-la is less stable than camel α-la. The stability of α-la is dependent on binding of calcium to the primary α-la calcium-binding site (Greene et al. Reference Greene, Grobler, Malinovskii, Tian, Acharya and Brew1999). As shown in Fig. 2, for apo α-la in the presence of EDTA very broad transitions were obtained starting at low temperatures.
It is amply documented that removal of metal ions or prosthetic groups from holo protein leads to local or overall conformational changes, reduction of stability, and enhanced chain flexibility (Polverino de Laureto et al. Reference Polverino de Laureto, Frare, Gottardo and Fontana2002). When calcium was depleted the maximal temperatures of denaturation of bovine and camel proteins were decreased.
Fluorescence study of camel and bovine α-la
Intrinsic fluorescence emission measurements of camel and bovine α-la in the presence of 2 mm-calcium and 3·5 mm-EDTA were performed using excitation wavelength of 280 nm. As indicated in Fig. 3A, the intrinsic fluorescence maximum emission wavelength of camel and bovine holo α-la is 328 nm, which implies that the Trp environment is very similar in the native structure of both α-la. The maximum of emission intensity of camel α-la is greater than the maximum of emission intensity of bovine α-la. Primary structure of camel α-la contains 5 Trp, 4 Phe and 3 Tyr while its bovine counterpart contains 4 Trp, 4 Phe and 4 Tyr. The large difference between the emissions of two proteins is mainly due to the extra Trp in camel α-la. The removal of calcium bound to both α-la provokes an increase in their fluorescence intensities and a red shift of their maxima. The λmax after calcium removal, were 347 nm and 335 nm for camel and bovine α-la, respectively. These changes suggest that Trp residues are more exposed to solvent in the apo form of both α-la reflecting the conformational changes caused by removal of the bound calcium. The shift of λmax after calcium removal is greater in the case of camel α-la than in the case of bovine α-la.
ANS binding studies indicate the quantity of hydrophobic sites available on the surface of protein able to bind the ANS probe. Hence, to some extent, ANS binding depicts the overall three-dimensional (3D) structure in solution (Cardamone & Puri, Reference Cardamone and Puri1992; Hawe et al. Reference Hawe, Sutter and Jiskoot2008) and the status of hydrophobic surface clusters. It has been shown that ANS has a strong affinity for a solvated hydrophobic core of the MG state. However, it binds weakly both with unfolded chains and with native proteins (Semisotnov et al. Reference Semisotnov, Rodionova, Kutyshenko, Ebert, Blanck and Ptitsyn1987). As mentioned before, two hydrophobic clusters have been detected in the native structure of α-la (Acharya et al. Reference Acharya, Stuart, Walker, Lewis and Phillips1989). ANS fluorescence measurements were made to probe the accessibility of the hydrophobic areas after calcium removal in the studied α-la. As shown in Fig. 3B a greater surface hydrophobicity of camel α-la than that of bovine protein at equivalent protein concentration can be explained by a greater hydrophobicity of N-terminal part of the α-helical domain of this α-la than its bovine counterpart. Apo bovine α-la shows ANS binding resembling MG state. For camel α-la little ANS fluorescence intensity increase after calcium removal was observed (Fig. 3B). This might be due to partial unfolding of the molecule. This remains in agreement with less value of ΔCp of camel α-la in the apo state and bigger red shift of λmax of fluorescence emission after calcium removal (Fig. 3A) in camel α-la reflecting bigger conformational changes.
The results of intrinsic and extrinsic fluorescence studies suggest that conformational integrities of both camel and bovine α-la are sensitive to calcium removal. However, camel α-la shows greater change in exposure of buried hydrophobic areas upon calcium depletion.
Far-UV ellipticity changes of bovine and camel α-la
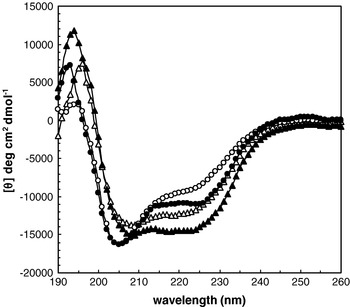
The far-UV CD spectra characterize the secondary structures of proteins due to the peptide bond absorption, and changes in this spectrum usually reflect the major backbone changes in proteins (Kelly & Price, Reference Kelly and Price2000). The far-UV CD spectra of bovine and camel α-la were recorded at room temperature, in the presence of 2 mm-calcium or 3·5 mm-EDTA (Fig. 4). The relative proportions of secondary structures are presented in Table 2. Table 2 shows that the secondary structure of camel α-la is very similar to that of bovine α-la. Calcium loaded holo forms of these proteins are slightly more structured than their apo forms (see Fig. 4).
Far-UV circular dichroism spectra of 15 μm-camel apo α-la (○), camel holo α-la (•), bovine apo α-la (▵), and bovine holo α-la (▴) in 20 mm-Tris-HCl (pH 7·5) at 25°C.

The secondary structure content of camel and bovine α-la

The relative proportion of secondary structures before and after calcium removal at 25°C was calculated by CDNN (Böhm et al. Reference Böhm, Muhr and Jaenicke1992)
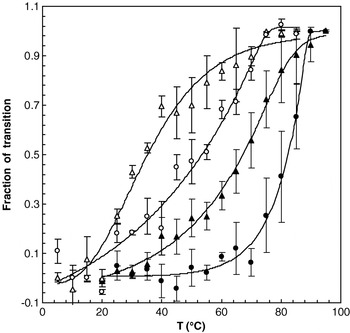
As shown in Fig. 4 and Table 2, and based on the results obtained from the fluorescence studies, it is clear that the removal of calcium from these proteins causes pronounced structural changes mostly in tertiary structure but also slight changes in secondary structures. As seen in Table 2, after calcium removal, a reduction in α-helix content and a slight elevation in β-structures were observed. Formation of non-native β-sheets in destabilizing condition was reported previously to increase propensity of some proteins to aggregation (Norma & Greenfield, Reference Norma and Greenfield1999). Non native β-structure formation and exposure of hydrophobic interior of the protein in the apo state (Fig. 2B) possibly gives to this protein capability to penetrate biological membranes what could explain its subsequent cytotoxic activity. As shown in Fig. 5 thermal denaturation of camel α-la was observed at higher temperatures in both apo and holo states. Similar changes happen in β-sheet structure since similar results were obtained at 217 nm. Consequently, these results indicate that the secondary structure of camel α-la is better preserved than that of bovine α-la during heat denaturation.
Thermal unfolding profile of α-La monitored by ellipticity at 222 nm; Total α-la concentration was 15 μm in 20 mm-Tris-HCl buffer, pH 7·5, containing 2 mm-CaCl2 (holo form) or 3·5 mm-EDTA (apo form). The lines represent the sigmoidal curve fit to the unfolding data and error bars denote standard deviation from the mean values. Symbols are identical to those of Fig. 4.

In 2 mm-calcium, even at 90°C, the value of ellipticity at 222 nm is higher than that observed in the presence of 3·5 mm-EDTA (data not shown). This indicates that, even at 90°C, calcium remains bound to camel α-la and influences its conformation. This result remains in agreement with the results reported previously for bovine α-la (Vanderheeren & Hanssen, Reference Vanderheeren and Hanssen1994).
The support of Research Council of University of Tehran, Iran National Science Foundation (INSF), Center for International Research and Collaboration (ISMO) and French Embassy in Tehran (for approving the Gundishapour project) is gratefully acknowledged.