
Introduction
Leishmania (Viannia) braziliensis was the first Leishmania species assigned as the aetiological agent of American tegumentary leishmaniasis (ATL), (Lainson, Reference Lainson1983; Grimaldi et al., Reference Grimaldi, David and and McMahon-Pratt1987). Currently, this parasite is related to a majority of ATL cases, with a total estimated number reaching up to 300 000. Clinical manifestations encompassing cutaneous, cutaneous disseminated and mucocutaneous features (Lessa et al., Reference Lessa, Lessa, Castro, Oliveira, Scherifer, Machado and Carvalho2007; Burza et al., Reference Burza, Croft and Boelaert2018). ATL clinical polymorphism and the spectrum of signs and symptoms have been related with both parasite and host factors (Lessa et al., Reference Lessa, Lessa, Castro, Oliveira, Scherifer, Machado and Carvalho2007; Oliveira et al., Reference Oliveira, Valete-Rosalino, Pacheco, Costa, Schubach and Pacheco2013). In fact, the genetic diversity of L. (V.) braziliensis isolates has been correlated to the spectre of clinical manifestations as well as to treatment resistance (Schriefer et al., Reference Schriefer, Schriefer, Goes-Neto, Guimarães, Carvalho, Almeida and Carvalho2004; Giudice et al., Reference Giudice, Camada, Leopoldo, Pereira, Riley, Wilson, Ho, de Jesus, Carvalho and Almeida2007; Queiroz et al., Reference Queiroz, Sousa, Heine, Cardoso, Guimaraes, Machado, Carvalho, Riley, Wilson and Schriefer2012), and epidemiological characteristics (Gomes et al., Reference Gomes, Macedo, Pena and Melo1995; Ishikawa et al., Reference Ishikawa, Silveira, Magalhães, Guerra, Melo, Gomes, Silveira and Shaw2002; Cupolillo et al., Reference Cupolillo, Brahim, Toaldo, de Oliveira-Neto, de Brito, Falqueto and Grimaldi2003). These data suggest the possibility that population structure within strains or isolates impacts the success of biological cycle and pathogenicity in hosts (Oliveira et al., Reference Oliveira, Valete-Rosalino, Pacheco, Costa, Schubach and Pacheco2013).
Such complexity of the population structure in L. (V.) braziliensis parasites is a focus of many studies. In L. (V.) braziliensis strains, as well as other Leishmania spp., isolated from naturally infected hosts have characteristics of heterogeneous parasites, presenting as a multiclonal population (Pacheco et al., Reference Pacheco, Grimaldi, Momen and Morel1990; Tibayrenc et al., Reference Tibayrenc, Kjellberg and Ayala1990; Cupolillo et al., Reference Cupolillo, Grimaldi and Momen1997; Jiménez et al., Reference Jiménez, Alvar and Tibayrenc1997; Gelanew et al., Reference Gelanew, Kuhls, Hurissa, Weldegebreal, Hailu, Kassahun, Abebe, Hailu and Schönian2010; Decuypere et al., Reference Decuypere, Vanaerschot, Brunker, Imamura, Müller, Khanal, Rijal, Dujardin and Coombs2012; Dumetz et al., Reference Dumetz, Cuypers, Imamura, Zander, D'Haenens, Maes, Domagalska, Clos, Dujardin and De Muylder2018; Tibayrenc and Ayala, Reference Tibayrenc and Ayala2021). Herein, the term subpopulation is applied as a synonym for clone, as previously proposed in a study of a L. (V.) braziliensis laboratory-maintained strain (Cysne-Finkelstein et al., Reference Cysne-Finkelstein, Silva-Almeida, Pereira, dos Santos Charret, Bertho, Bastos and Alves2018). It must be considered that the implications of the clonal population structure discussed here do not exclude the potential roles of recombination events (Akopyants et al., Reference Akopyants, Kimblin, Secundino, Patrick, Peters, Lawyer, Dobson, Beverley and Sacks2009; Inbar et al., Reference Inbar, Akopyants, Charmoy, Romano, Lawyer, Elnaiem, Kauffmann, Barhoumi, Grigg, Owens, Fay, Dobson, Shaik, Beverley and Sacks2013; Patino et al., Reference Patino, Muñoz, Cruz-Saavedra, Muskus and Ramírez2020; Tibayrenc and Ayala, Reference Tibayrenc and Ayala2021).
The heterogeneous composition of parasite populations in Leishmania spp. can be illustrated by phenotypic variations in antimony susceptibility, as observed for L. (V.) braziliensis, Leishmania (V.) guyanensis and Leishmania (L.) amazonensis isolates (Moreira et al., Reference Moreira, Anacleto and Petrillo-Peixoto1998; Zabala-Peñafiel et al., Reference Zabala-Peñafiel, Dias-Lopes, Cysne-Finkelstein, Conceição-Silva, Miranda, Fagundes, Schubach, Pimentel, Souza-Silva, Machado and Alves2021), and for Leishmania (L.) donovani isolates which were described as a mixture of subpopulations susceptible and resistant to sodium stibogluconate (Pal et al., Reference Pal, Mandal and Duttagupta2001; Bhattacharyya et al., Reference Bhattacharyya, Mukherjee and Duttagupta2002). Another example for the role of population structure in the environmental adaptive success of the parasites is the study performed with L. (L.) major submitted to in vitro treatment with miltefosine, which indicated that resistance is related to population heterogeneity, with subpopulations that differ in susceptibility phenotypes (Coelho et al., Reference Coelho, Boisvert, Mukherjee, Leprohon, Corbeil and Ouellette2012). Moreover, different subpopulations of Leishmania spp. may also contribute to the process of cutaneous metastases, visceralization and time to lesion development (Martínez et al., Reference Martínez, Valderrama, Gama, Leiby and Saravia2000; Garin et al., Reference Garin, Sulahian, Pratlong, Meneceur, Gangneux, Prina, Dedet and Derouin2001; Espiau et al., Reference Espiau, Vilhena, Cuvillier, Barral and Merlin2017).
The loss of virulence in L. (L.) amazonensis strains cultivated in the laboratory for an extended period could be explained due to selection of avirulent subpopulations, if those present a higher growth rate under the culture conditions (Kink and Chang, Reference Kink and Chang1988). Conversely, the virulence recovery after an animal passage of attenuated laboratory strains could result in in vivo selection of more infective subpopulations (Espiau et al., Reference Espiau, Vilhena, Cuvillier, Barral and Merlin2017). In fact, the presence of parasite subpopulations with distinct biological potentialities can contribute not only to the survival of some individuals, but of the population in general, depending on changes in the environmental conditions (Espiau et al., Reference Espiau, Vilhena, Cuvillier, Barral and Merlin2017). Despite evidence of heterogeneity in Leishmania spp., and the deepening of genetic aspects (Cupolillo et al., Reference Cupolillo, Grimaldi and Momen1997, Reference Cupolillo, Momen and Grimaldi1998; Pomares et al., Reference Pomares, Marty, Bañuls, Lemichez, Pratlong, Faucher, Jeddi, Moore, Michel, Aluru, Piarroux and Hide2016; Patino et al., Reference Patino, Muñoz, Cruz-Saavedra, Muskus and Ramírez2020; Salloum et al., Reference Salloum, Moussa, Rahy, Al Deek, Khalifeh, El Hajj, Hall, Hirt and Tokajian2020), studies on the phenotypic characteristics of subpopulations and their impact on the different stages of the biological cycle are scarce. These studies are essential for understanding how the phenotypic diversity of a specific population contributes to the evolutionary success of the parasite.
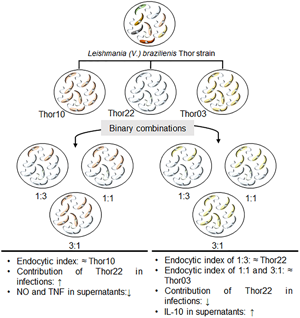
The fact of L. (V.) braziliensis virulence to be influenced by its subpopulations heterogeneity was assessed here. The present study is based on previous analysis of the L. (V.) braziliensis Thor strain (MCAN/BR/1998/R619) that showed a composition of heterogeneous subpopulations with distinct biological characteristics such as differences in the murine macrophages in vitro infection profile and cytokine production as well as variable expression patterns of their own peptidase genes. The hierarchical classification method allowed the grouping of these subpopulations into 2 clusters with distinct infection profiles (Cysne-Finkelstein et al., Reference Cysne-Finkelstein, Silva-Almeida, Pereira, dos Santos Charret, Bertho, Bastos and Alves2018). Here, we deepened the study of these subpopulations to demonstrate how heterogeneity contributes to parasite fitness. For this purpose, 3 subpopulations with different macrophage infection profiles were selected, 1 representative of cluster I (Thor22) and 2 of cluster II (Thor03 and Thor10). The results presented suggest that depending on the combination of these parasite subpopulations, emergent properties contribute to the survival of the population, indicating a collaborative action that could be decisive for the parasite fitness in the mammalian host cells.
Materials and methods
Chemicals and culture media
Fetal bovine serum (FBS), CellTrace carboxyfluorescein succinimidyl ester (CFSE) cell proliferation kit and Lab-Tek chamber slides were purchased from ThermoFisher Scientific (Massachusetts, U.S.A.). Complement sera human (CSH) lyophilized powder, antibiotics (penicillin and streptomycin), RPMI 1640 medium and Schneider's insect medium were purchased from Sigma-Aldrich Chemical Co. (Missouri, U.S.A.). Quick Panoptic was purchased from Newprov (Paraná, Brazil). Brewer thioglycollate medium, sulphanilamide (C6H8N2O2S), N-(1-nafitil)dihydrochloride ethylenediamine (C12H14N2), sodium nitrite (NaNO2) and phosphoric acid (H3PO4) were purchased from Merck Millipore (Massachusetts, U.S.A.). BD CBA Mouse Th1/Th2/Th17 Cytokine Kit was purchased from Becton-Dickinson Biosciences (New Jersey, U.S.A.). All reagents were of analytical grade or superior.
Parasite and culture conditions
Promastigotes of previously isolated subpopulations (Thor03, Thor10 and Thor22) of the L. (V.) braziliensis Thor strain (MCAN/BR/1998/R619) were used throughout this study. The selection of these subpopulations was based on the macrophage infection profile. Thus, parasites with very low (EI ≤ 160) or high (EI ≥ 400) infection rates were excluded due to the difficulty in evaluating the contribution of each subpopulation in the binary combinations (Cysne-Finkelstein et al., Reference Cysne-Finkelstein, Silva-Almeida, Pereira, dos Santos Charret, Bertho, Bastos and Alves2018). Furthermore, to corroborate the effect of the cooperation between subpopulations was pertinent to assess more than 1 representative of the most infective cluster. The same batch of cryopreserved Thor strain subpopulations, previously obtained by cell sorting and flow cytometry and assessed for macrophage infection, was used in all experimental assays.
After thawing, the parasites were cultivated in Schneider's insect medium supplemented with 10% heat-inactivated FBS, 200 IU penicillin and 200 μg mL−1 streptomycin at pH 7.2, and maintained at 26°C. To obtain each subpopulation growth curve, promastigotes (5 × 10⁵ mL−1) were cultured in 25 cm2 flasks, as described above. The number of viable parasites was determined daily in a Neubauer counting chamber.
Complement lysis
CSH vial was diluted in water and stored at −80°C, according to the manufacturer's instructions. The assays were performed in 96-well plates using 2% CSH, immediately after thawing. Parasites were washed by centrifugation (1650 × g, 10 min, 4°C) in sterile cold phosphate-buffered saline (PBS) pH 7.2 and plated at a density of 1.0 × 10⁶ mL−1. The parasites were incubated with CSH (45 min, 37°C), and then placed on ice. Finally, the viable parasites were counted in a Neubauer chamber and the results expressed as the percentage of viable promastigotes in CSH-treated samples as compared to non-treated control.
Isolation and culture of murine peritoneal macrophages
Brewer thioglycollate medium was intraperitoneally injected in BALB/c mice (4- to 8-week-old females) 72 h prior to macrophage extraction. Afterwards, RPMI 1640 medium (10 mL) was injected into the peritoneal cavity and the macrophages were aspirated using sterile syringes. Samples were sedimented by centrifugation (520 × g, 5 min, 4°C) and plated, at a density of 5 × 10⁵ mL−1, on Lab-Tek chamber slides containing RPMI 1640 medium with 10% FBS for 24 h (37°C in 5% CO2).
Infection of peritoneal macrophages
The macrophage infection assays were performed with the stationary phase of promastigotes at a ratio of 10:1 (parasite:macrophage) with 2 h or 5 h interaction (37°C in 5% CO2). Following interaction, the cultures were washed with RPMI 1640 medium and fresh medium containing 10% FBS added. The parasite–macrophage infection was evaluated at different time courses (24, 48 and 72 h), and non-infected macrophage cultures were used as control for cell viability. Finally, macrophages in the LabTek slides were stained using the Quick Panoptic method and observed using a Panthera L optical microscope (Motic, Xiamen, China). The assays were performed in triplicate and repeated in 3 different thawing of the parasites.
Macrophage infections were performed with subpopulations alone and in mixed infections with binary combinations at different proportions as follows: 1:3 (25% of Thor03 or Thor10 and 75% of Thor22), 1:1 (50% of Thor03 or Thor10 and 50% of Thor22), 3:1 (75% of Thor03 or Thor10 and 25% of Thor22). To determine the percentage of infected macrophage and the number of parasites per cell, a total of 100 macrophages was analysed per slide chamber. These values were used to estimate the endocytic index (EI) as follows: EI = (% of infected macrophages) × (mean number of parasites in each infected macrophage).
Labelling of parasites with fluorescent dye
Promastigotes were labelled with CFSE according to the manufacturer's instructions. Briefly, a total of 1 × 10⁷ parasites mL−1 was incubated (25 min, 37°C) in a water bath with 2.5 μ m of CFSE under light protection. Unbound dye was quenched by the addition of 1 volume of FBS, and incubated (5 min, 37°C) in a water bath protected from light. Then, parasites were washed with RPMI 1640 medium by centrifugation (2-fold, 1650 × g, 10 min, 4°C) and used for infection of murine peritoneal macrophages. The infection assays were performed as previously described in 96-well plates. The analysis was performed using a SpectraMax M2 (Molecular Devices Inc.) with 492 nm excitation and a 517 nm emission filter, and results were expressed in fluorescence units (FU).
Evaluation of nitric oxide (NO) levels in the supernatant of infected murine peritoneal macrophage cultures
NO levels in the supernatants of macrophage cultures were analysed in a 96-well plate using Griess methodology (Green et al., Reference Green, Wagner, Glogowski, Skipper, Wishnok and Tannenbaum1982). Culture supernatants (100 μL) were mixed with 100 μL of Griess reagent [1% C6H8N2O2S and 0.1% C12H14N2 dissolved in 2.5% H3PO4, (v/v)] and incubated for 10 min at room temperature. In parallel, a standard curve for the determination of NO2− concentration (μ m) was produced using NaNO2 diluted in RPMI 1640 medium. The determination of absorbance was performed in a Tunable Microplate Reader VersaMax (Molecular Devices Inc.) at 540 nm.
Evaluation of cytokine levels in the supernatant of infected murine peritoneal macrophage cultures
The quantification of cytokines in supernatants of macrophage cultures was evaluated using the commercial kit Cytometric Bead Array (CBA) mouse Th1/Th2/Th17 to measure IL-2, IL-4, IL-6, IFN-γ, tumour necrosis factor (TNF-α), IL-17A and IL-10. The samples were prepared according to the manufacturer's instructions, as follows: 50 μL of sample, 50 μL of the set with specific magnetic beads for each cytokine and 50 μL of the detection reagent. Standard detection curves were also prepared for each cytokine. The tubes were incubated (2 h, 25°C) in the dark. The samples were analysed using a FACSCalibur flow cytometer (Becton-Dickinson Biosciences, U.S.A.) at the Multiuser Facility of Multiparametric Flow Cytometry Analysis of the Instituto Oswaldo Cruz. Data were expressed as mean ± standard deviation of data of cytokine concentration (pg mL−1).
Results
Growth curve profile and metacyclic promastigote rates in culture
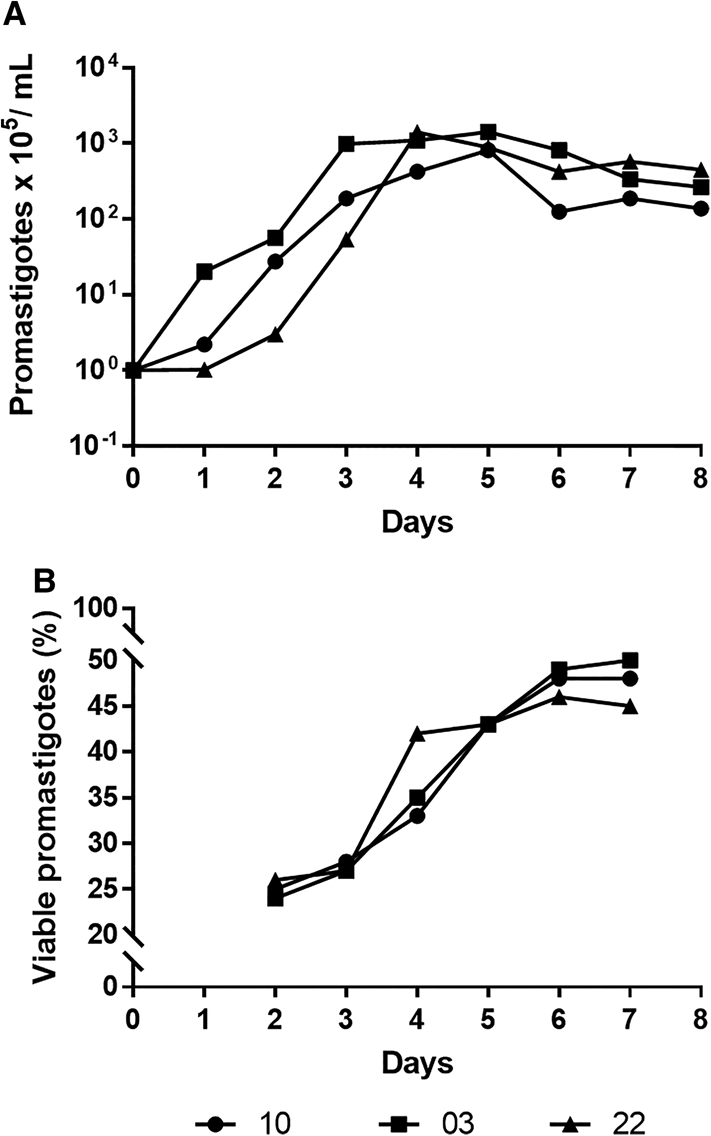
The first step of this study was to assess promastigote culture growth profile and determine the time point with the maximal percentage of metacyclic forms for the 3 studied subpopulations. Thor03 and Thor10 showed a rapid expansion in culture for the first 2 days (initial logarithmic phase) whereas Thor22 had slower growth (Fig. 1A). All subpopulations reached peak growth between the 4th and 5th day (beginning of stationary phase), when all subpopulations reached a similar number of parasites per mL (1 × 10⁸ mL−1) (Fig. 1A). The monitoring of metacyclogenesis along the growth curves pointed to levels of metacyclic promastigotes with values close to 50% (Thor03: 50%; Thor10: 48%; Thor22: 46%) from the 6th day in culture (Fig. 1B). These results were highlighted by the largest increases in Thor22 (26–42%) between days 3 and 4 and for Thor03 (24–43%) and Thor10 (25–43%) between days 3 and 5 (Fig. 1B). Thus, the promastigotes of the 4th day (Thor22) and 5th day (Thor03 and Thor10) were used in the subsequent infection assays with murine peritoneal macrophages.
In vitro profile of the L. (V.) braziliensis subpopulations behaviour. Promastigotes were analysed for growth curve (A) and for resistance to human complement (B). The parasites (1 × 10⁵ promastigotes mL−1) placed in Schneider's medium at 26°C were followed for 8 days, a daily aliquot was used to count viable parasites in a Neubauer chamber. Each point represents the mean parasite mL day−1 of the 3 independent experiments. In complement lysis assays, promastigotes (1 × 10⁶ mL−1) from the 2nd to the 7th day were maintained at 37°C for 45 min with 2% complement sera human. The results were expressed as the viable promastigotes percentage compared with control.
Time of interaction of parasites with host cells in mixed infections
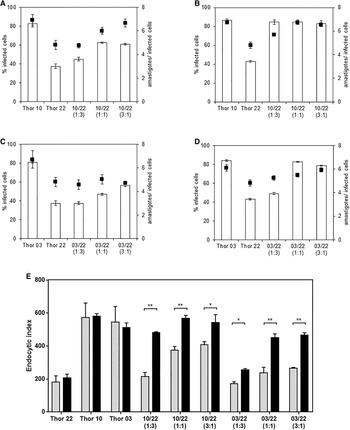
Another important step of this study was the prior evaluation of the optimal time of initial interaction of parasites with host cells in mixed infections. Profiles of the mixed subpopulation infections were compared to those of non-combined subpopulations and representative light microscopy images are shown in the Supplementary Fig. 1. Initial interactions were carried out at 10:1 (parasites:macrophage) ratio for 2 h (Fig. 2A, C) and 5 h (Fig. 2B, D). Then, free parasites were removed from the culture supernatant and the macrophage cultivated for 24 h. For mixed subpopulations, higher numbers of intracellular amastigotes were observed for 5 h of initial interaction (Fig. 2B, D). Notably, the macrophage infection rate (%) was strongly influenced by different initial interaction times, with a tendency to increase at 5 h, in combinations with 50% and 75% of the Thor10 and Thor03 [Thor10/Thor22(1:1 and 3:1); Thor03/Thor22(1:1 and 3:1)] as well as 25% of Thor10 [10/22(1:3)], which reached 45% and 85% of infection at 2 h and 5 h, respectively (Fig. 2A, B). Similar infection profile was observed among subpopulations in the non-combination condition at 2 h [Thor10 (83%), Thor03 (84%) and Thor22 (38%)] and 5 h [Thor10 (87%), Thor03 (84%) and Thor22 (43%)] (Fig. 2). The analysis of the EI of all conditions showed that the macrophage infection profile is impacted by initial interaction time only in the binary combinations (Fig. 2E), highlighting the influence of Thor03 and Thor10 in increasing the infection load, even in the presence of a low percentage of Thor10 in the mixture. Moreover, the macrophage infection profiles were independent of the parasite–host cell ratio, with ratios 5:1 and 20:1 (parasites:macrophage) showing similar effects in the combination conditions (Supplementary Fig. 2).
Influence of the initial interaction time (2 h or 5 h) on the in vitro infection of peritoneal macrophages with promastigotes of L. (V.) braziliensis subpopulations (Thor03, Thor10, Thor22) and their combinations after 24 h. Infections were carried out at a ratio of 10:1 (parasite: macrophage) during 2 h (A and C) and 5 h (B and D) of interaction before washing and adding new RPMI 1640 medium. Infection values were expressed as the percentage of infected macrophages and the number of parasites per infected cell. The EI was performed for all conditions (E), in grey, 2 h of interaction; in black, 5 h of interaction. Values are representative of the mean ± standard deviation from 3 independent experiments. Significant differences are indicated as: (*) P ≤ 0.05; (**) P ≤ 0.01.

Infection profile at different times
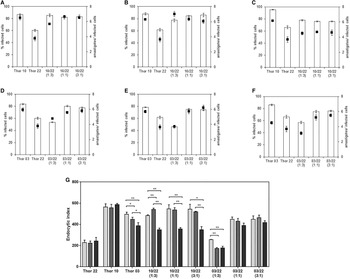
After properly establishing the standard experimental conditions for the infection assays, a kinetic study (24, 48 and 72 h) was performed to evaluate differences between subpopulations alone and in combined condition (Fig. 3). In general, the subpopulations with higher virulence (Thor03 and Thor10) increased the macrophage infection rate when in combination with Thor22, except for Thor03/Thor22 (1:3). This Thor03/Thor22 combination (24 h: 53.7% and 4.8; 48 h: 46.3% and 3.7; 72 h: 57% and 3.1) showed an infection profile similar to Thor22 (24 h: 60.3% and 3.8; 48 h: 61.7% and 3.6; 72 h: 66.3% and 3.7) in all time course (Fig. 3 D–F). While the Thor10/Thor22 (1:3) combination (24 h: 85% and 5.7; 48 h: 77.5% and 7) showed similarity with Thor10 (24 h: 87% and 6.5; 48 h: 88% and 6.3) in 24 and 48 h of infection (Fig. 3A, B). The EI showed no change in the infection profile for Thor10 and Thor22 subpopulations, while Thor03 decreased the infection rate (Fig. 3G). However, all Thor10/Thor22 combinations showed a variation in the different infection times (Fig. 3G).
In vitro infection of peritoneal macrophages with stationary phase promastigotes of L. (V.) braziliensis subpopulations (Thor03, Thor10, Thor22) and their combinations at 24 h (A and D), 48 h (B and E) and 72 h (C and F). Infections were carried out at a ratio of 10:1 (parasite:macrophage) during 5 h of interaction before washing and adding new RPMI 1640 medium. Infection values were expressed as the percentage of infected macrophages and the number of parasites per infected cell. The EI was performed for all conditions, in light grey, 24 h; in medium grey, 48 h; and dark grey, 72 h (G). Values are representative of the mean ± standard deviation from 3 independent experiments. Significant differences are indicated as: (*) P ≤ 0.05; (**) P ≤ 0.01.

Contribution of each subpopulation on the infection outcome
CFSE-labelling of parasites was applied aiming to shed light on the effects of mixed subpopulations in the macrophage infection profile. As expected, the subpopulations Thor10 (14.9 FU) and Thor03 (11.4 FU) stand out for the high parasite load compared to Thor22 (8.1 FU), based on the analysis of FU values (Fig. 4A). Although no significant difference was observed between Thor03 and Thor10 labelled parasites combined at 1:3 ratio with Thor22 [5.1 FU in 03/22 and 3.8 FU in 10/22], a remarkable increase in the fluorescence signal, revealing higher parasite load, was achieved in 1:1 and 3:1 ratio of Thor10/Thor22 combinations (Fig. 4B). A predominance of CFSE labelled Thor10 is clearly observed in 1:1 and 3:1 mixture with Thor22 (Fig. 4B), reaching maximal value ~3.5 greater than Thor22 in 3:1 ratio of Thor10/Thor22 combination (Fig. 4C). Under the same conditions, the parasite load corresponding to Thor03 and Thor22 were similar in the combinations assessed of these subpopulations, except for the 3:1 ratio where Thor03 is higher. Compared to the Thor03/Thor22 combinations, it is important to highlight that the Thor22 is significantly increased when this subpopulation was combined with Thor10 (Fig. 4C). In fact, these results showed FU values [6.6 FU in 10/22(1:3) and 6.4 FU in 10/22(1:1)] close to the infection with Thor22 alone (8.1 FU) (Fig. 4C).
Tracking of subpopulation parasites in macrophage infections. The identification of parasites was evaluated with CFSE labelling of promastigotes and reading on a spectrofluorometer at 24 h of infection. The data were expressed as fluorescence units (FU). Infection with labelled Thor03, Thor10 and Thor22 without combination (A); infection with labelled Thor03 and Thor10 and combined (1:3; 1:1; 3:1) with unlabelled Thor22 (B); and infection with labelled Thor22 and combined (1:3; 1:1; 3:1) with unlabelled Thor03 and Thor10 (C). Values of FU are representative of the mean ± standard deviation of data from 3 independent experiments. Significant differences are indicated as: (*) P ≤ 0.05; (**) P ≤ 0.01; (***) P ≤ 0.001.

Additional assays comparing the peritoneal murine macrophage infection between labelled and unlabelled Thor03, Thor10 and Thor22 non-combined subpopulations at 24 h showed no differences under the conditions evaluated (Supplementary Fig. 3A). Lastly, the labelling of both subpopulations in the combinations (Supplementary Fig. 3B) allowed us to confirm the macrophage parasite load results previously shown by direct microscopic count methodology (Figs. 2 and 3).
Levels of NO produced by macrophage cultures infected
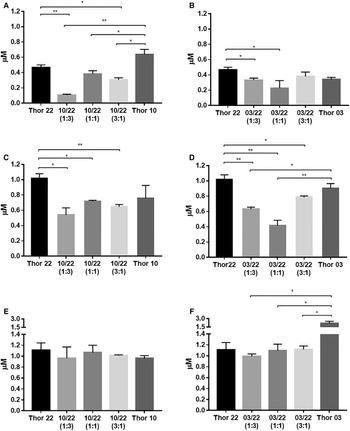
Interaction of macrophage with subpopulations differently modulates NO production. A time-dependent increase of NO level was observed in the supernatant of macrophage cultures infected with the subpopulations alone or their combinations. The subpopulations alone showed differences in NO detection at 24 and 72 h. The supernatant of macrophage cultures with Thor10 showed higher NO production than supernatants from Thor03 and Thor22 infections at 24 h, while Thor03 had the highest levels in 72 h. At 24 h of infection, the highest level of NO was produced by macrophages infected with Thor10 (0.64 μ m), followed by Thor22 (0.47 μ m) and Thor03 (0.34 μ m) infections (Fig. 5A and B). Later (72 h of infection), NO levels are even higher, reaching 0.96 μ m, 1.1 μ m and 2.18 μ m for Thor10, Thor22 and Thor03, respectively (Fig. 5E, F). The combinations of Thor10/Thor22 showed a significant decrease in NO levels at 24 h when compared to the 2 subpopulations alone (Fig. 5A). At 48 h, the difference persisted compared to Thor22 alone (Fig. 5C), while in the combinations with Thor03, differential NO levels were mainly evidenced at 48 h of infection (Fig. 5D), but the peak of NO production was detected in Thor03 alone at 72 h of infection (Fig. 5F).
Detection of NO during macrophage infections. The concentration of NO was determined in the culture supernatants of macrophages infected with the subpopulations separately and their combinations by the Griess reaction. The results represent the difference between the values of culture supernatants from infected macrophages at 24 h (A and B), 48 h (C and D) and 72 h (E and F) and were expressed in μ m as mean ± standard deviation of data from 3 independent experiments. Significant differences are indicated as: (*) P ≤ 0.05; (**) P ≤ 0.01.

Cytokine secretion in the supernatant of infected macrophages
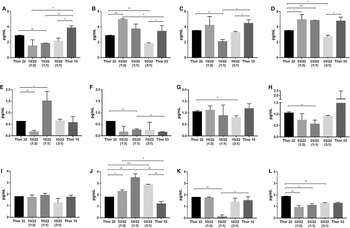
Only TNF-α, IL-6 and IL-10 levels were assessed in macrophage cultures infected by L. (V.) braziliensis subpopulations. Data of subpopulations alone showed differences in evaluated cytokines. TNF-α detection was higher in assays with Thor10 in comparison with Thor22 at 24 h of infection, while Thor03 presented higher levels than Thor22 at 48 h. The assays with the Thor22 had higher levels of IL-6 and IL-10 at 24 h, and IL-10 was better detected only at 48 h.
The Thor10/Thor22 combinations significantly downregulated the TNF-α levels at both 24 and 48 h of infection, contrasting to this subpopulation alone and its Thor10/Thor22 (1:3) combination at 48 h [4.4 pg mL−1 in Thor10 and 4.2 in Thor10/Thor22 (1:3)] (Fig. 6A, C), which showed upregulation of this cytokine. On the other hand, combinations of Thor03/Thor22 (1:3 and 1:1) induced an increase in the TNF-α levels at these time courses, compared to Thor03 and Thor22 alone (Fig. 6B, D). In contrast, higher prevalence of Thor03 in the Thor03/Thor22 (3:1) combination led to a downregulation of TNF-α level (Fig. 6B, D).
Detection of cytokines during macrophage infections. Cytometric bead array evaluated the presence of cytokines in peritoneal macrophage culture supernatants of infection with the subpopulations separately and their combinations. The cytokines TNF-α (A and B at 24 h; C and D at 48 h), IL-6 (E and F at 24 h; G and H at 48 h) and IL-10 (I and J at 24 h; K and L at 48 h) were expressed in pg mL−1 as the means ± standard deviation of data from 3 independent experiments. Significant differences are indicated as: (*) P ≤ 0.05; (**) P ≤ 0.01; (***) P ≤ 0.001.

Regarding IL-6 production, high variation in this cytokine level was observed between different combinations of Thor10/Thor22 at 24 h of infection. Compared to Thor22 alone, a significant ~3.6-fold reduction in this cytokine level was observed at the 1:3 ratio of Thor10/Thor22 whereas a peak of IL-6 production (~2.4-fold increase) was noticed in the 1:1 ratio (Fig. 6E). However, low modulation was observed at 48 h of infection, with only a significant reduction in combination of Thor10/Thor22 (3:1) (Fig. 6G). Considering Thor03, upregulation of IL-6 was evidenced at 48 h of infection, reaching ~10-fold higher values (Fig. 6H). However, in general, the mixed infections did not impact the production of this cytokine at the infection times evaluated.
A differential modulation of IL-10 by infected macrophages was evidenced among the subpopulations. No alteration in IL-10 production was noticed in Thor10/Thor22 combinations compared to Thor10 and Thor22 alone (Fig. 6I, K), except for combination Thor10/Thor22 (1:1) that led to a significant reduction of the IL-10 level at 48 h of infection (Fig. 6K). A time-dependent regulation of IL-10 production was revealed for combinations of Thor03/Thor22, with upregulation of this cytokine in all combination ratios at 24 h of infection (Fig. 6J). On the other hand, the IL-10 production of Thor03/Thor22 combinations and Thor22 alone was significantly reduced at 48 h of infection when compared to Thor03 alone, with the production of IL10 of the latter unchanged at different times of infection (Fig. 6L).
Discussion
The protozoan L. (V.) braziliensis has adaptive characteristics during its life cycle in the different biological filters from natural biomes where it occurs (Oliveira et al., Reference Oliveira, Valete-Rosalino, Pacheco, Costa, Schubach and Pacheco2013). Such adaptation potential has been proved under laboratory conditions, as previously described for subpopulations diversity in L. (V.) braziliensis Thor strain (Cysne-Finkelstein et al., Reference Cysne-Finkelstein, Silva-Almeida, Pereira, dos Santos Charret, Bertho, Bastos and Alves2018). These findings motivated the present study that proposed manipulation of Thor strain structure population by binary combinations among 3 of its subpopulations in assays of in vitro infection of BALB/c mice macrophage. The results obtained point to the ability of this parasite to resort to its phenotypic plasticity, therefore increasing its odds of survival in the vertebrate host. The potential for infectivity of these subpopulations and the effect of combinations in vivo models will be explored in future studies.
In the first phase of this work, assays that quantified parasites in metacyclic form were performed. The results demonstrated that differences in the infection profile were not related to the developmental phase of promastigotes in any of the tested subpopulations. These data are relevant as it is known that the metacyclic promastigotes present an increase of infectivity for macrophages and can interact with cell receptors and evade microbicidal mechanisms (Pinto-da-Silva et al., Reference Pinto-da-Silva, Camurate, Costa, Oliveira, da Cunha-e-Silva and Saraiva2002). Thus, subsequent assays could be conducted with a reliable management of this variable.
The impact of phenotypic variations of subpopulations from different strains of Leishmania spp. on the capacity to infect vertebrate host has been explored by different approaches. One of the classical examples is the evaluation of infectivity in BALB/c mice of Leishmania (Leishmania) tropica subpopulations obtained by limit dilution (Handman et al., Reference Handman, Hocking, Mitchell and Spithill1983). Another example, this time applying a flow cytometry cell sorting strategy to separate subpopulations, is the study that L. (V.) guyanensis parasites had differences in the ability to metastasize in hamsters (Martínez et al., Reference Martínez, Valderrama, Gama, Leiby and Saravia2000). Moreover, the outcome of infection by L. (L.) infantum and L. (L.) amazonensis in mice changed in assays with subpopulations alone or their combinations (Garin et al., Reference Garin, Sulahian, Pratlong, Meneceur, Gangneux, Prina, Dedet and Derouin2001; Espiau et al., Reference Espiau, Vilhena, Cuvillier, Barral and Merlin2017). It was observed that the visceralization always occurred in the presence of L. (L.) infantum subpopulations that presented this phenotype, in this case, the visceralization predominating over the initial resolution (Garin et al., Reference Garin, Sulahian, Pratlong, Meneceur, Gangneux, Prina, Dedet and Derouin2001). Thus, the infection profile depended on the presence of a dominant character (Garin et al., Reference Garin, Sulahian, Pratlong, Meneceur, Gangneux, Prina, Dedet and Derouin2001). In the case of lesions caused by L. (L.) amazonensis, it was observed that in fast developing lesions, a parasite subpopulation with slower growth was present in small amounts, whereas this subpopulation was predominant in slow developing lesions (Espiau et al., Reference Espiau, Vilhena, Cuvillier, Barral and Merlin2017).
The influence of collaborative subpopulations on the infection outcome was observed in this work, since infections in combinations ⩾ 50% of the most infective subpopulations (Thor10 and Thor03) had EI values comparable to those of infections with these parasites alone. This indicates that both subpopulations provide a favourable environment for infection of Thor22, which has inherent lower virulence. Furthermore, the results obtained suggest that this phenomenon does not depend on the total number of parasites, but on the proportion between subpopulations. It is also necessary to emphasize that this effect could only be observed in a 5 h initial time of parasite–host cell interaction, suggesting a time-related modulation of the macrophages. In fact, several studies showed the importance of the secretome, especially exosomes, in the infection process (Silverman et al., Reference Silverman, Clos, Horakova, Wang, Wiesgigl, Kelly, Lynn, MacMaster, Foster, Levings and Reiner2010; Lambertz et al., Reference Lambertz, Silverman, Nandan, McMaster, Clos, Foster and Reiner2012; Rodríguez-Vega et al., Reference Rodríguez-Vega, Losada-Barragán, Berbert, Mesquita-Rodrigues, Bombaça, Menna-Barreto, Aquino, Carvalho, Padrón, de Jesus and Cuervo2021). Interestingly, co-cultivation of L. (V.) guyanensis strains even without direct contact between the cultivated parasites was able to enhance growth ability and decrease drug sensitivity (Pereira et al., Reference Pereira, Sousa, Ramos, Torres-Santos, Pinheiro, Alves, Cuervo, Romero, Boité, Porrozzi and Cupolillo2021). This modulation process in subpopulation infections will further be explored in future studies.
After proving the influence of a collaborative action of Thor03 and Thor10, it was opportune to assess which subpopulations are prevalent in these mixed infections. In fact, this information was achieved using a CFSE-labelling strategy of the Thor subpopulations. CFSE has been extensively used to assess proliferation of Leishmania promastigotes (Kamau et al., Reference Kamau, Nunez and Grimm2001; Messaritakis et al., Reference Messaritakis, Mazeris, Koutala and Antoniou2010), and their potential to infect different cell types including human peripheral blood mononuclear cell-derived monocytes, macrophage cell lines, as well as human monocytes (Chang et al., Reference Chang, Thalhofer, Duerkop, Mehling, Verma, Gollob, Almeida and Wilson2007; Viana et al., Reference Viana, Magalhães, Giunchetti, Dutra and Gollob2018). Furthermore, the CellTrace CFSE dye, under our experimental condition, did not affect the L. (V.) braziliensis parasites viability or interfere in the infection process, as it was measured in the present study in comparative assays between labelled and unlabelled parasites. These assays are important since a study assessing the replication of Trypanosoma cruzi in Vero cells with CellTrace Violet fluorescent dye-labelled parasites showed lower infection rates and lower amastigote replication with labelled parasites (Ward et al., Reference Ward, Olmo, Atherton, Taylor and Kelly2020).
CFSE-labelling results showed that Thor22 had a higher infection rate in all combinations with Thor10 compared to the same proportions of combinations with Thor03. In addition, the parasites of Thor22 are the majority in the Thor10/Thor22 (1:3) combination, while in the other combinations and alone, Thor10 had a higher infection rate. Together, these findings explain the value of the EI of this combination similar to that of Thor10 alone and highlight the importance of characteristics of some subpopulations in contributing to the population in certain circumstances.
The results obtained on the EI and the contribution of each subpopulation to the infection indicated that subpopulation Thor10 has a greater capacity to immunomodulate peritoneal macrophages compared with Thor03. To understand this modulation process, the inflammatory mediator levels were evaluated. The analysis of expression of the proinflammatory cytokines TNF-α and IL-6, as well as immunoregulatory cytokine IL-10, showed that combinations are able to modify the environment for infection when compared to non-combined studied subpopulations. Analogous results were assessed for NO, an essential cytotoxic factor for the intracellular killing of Leishmania spp. in TNF-α-induced macrophages (Liew et al., Reference Liew, Li and Millott1990). It is well established that IL-10 acts as an important mediator in the process of infection of BALB/c mice by Leishmania spp. with a role in regulating a protective Th1-type response (Padigel et al., Reference Padigel, Alexander and Farrell2003). In fact, as previously proposed (Cysne-Finkelstein et al., Reference Cysne-Finkelstein, Silva-Almeida, Pereira, dos Santos Charret, Bertho, Bastos and Alves2018) and measured herein, the combination of subpopulations may influence the result of infection, for example inducing cytokines of the innate immune response. The results showed lower NO and TNF-α levels at 24 h infection in all Thor 10 combinations, while Thor03 combinations were associated with higher IL-10 levels in the supernatant at this time point. The use of 2 subpopulations with the high infection load allowed us to underline differences between them. It is possible to observe that the production of NO, as well as cytokines by macrophages during infection by these subpopulations varies considerably, which could contribute to the great difference in the EI observed in combinations with 75% of Thor22.
These findings highlight the importance of population structure in the in vitro infection of murine peritoneal macrophages by a laboratory-maintained L. (V.) braziliensis strain, but the implications of these results may reflect on several other aspects of the parasite's life cycle. The profile of population structure may influence the clinical prognosis of the disease and the efficiency of therapeutic strategies (Schriefer et al., Reference Schriefer, Schriefer, Goes-Neto, Guimarães, Carvalho, Almeida and Carvalho2004; Decuypere et al., Reference Decuypere, Vanaerschot, Brunker, Imamura, Müller, Khanal, Rijal, Dujardin and Coombs2012; Leprohon et al., Reference Leprohon, Fernandez-Prada, Gazanion, Monte-Neto and Ouellette2015). Thus, the identification of a subpopulation-specific marker could have a prognostic value to be explored for the treatment of leishmaniasis (Schriefer et al., Reference Schriefer, Schriefer, Goes-Neto, Guimarães, Carvalho, Almeida and Carvalho2004). Therefore, analysis focusing on subpopulations may be more effective to evaluate phenotypic characteristics of a Leishmania sp. strain.
In conclusion, this set of results emphasizes that the phenotypic diversity in L. (V) braziliensis is beyond the information present in the genome, and can be partly explained by the profile of the population structure with individuals able to contribute to the success of the life cycle of this parasite.
Supplementary material
The supplementary material for this article can be found at https://doi.org/10.1017/S003118202200097X.
Acknowledgements
The authors acknowledge the facilities and technical support provided by the Culture Medium Platform and Multiuser Facility of Multiparametric Flow Cytometry Analysis of the Instituto Oswaldo Cruz.
Author contributions
C.R.A. conceived and designed the study. B.C.A.-M., L.C.-F. and G.D.-L. conducted the experiments. L.F.G.-O., C.M.C., A.H.-P. and M.C.S.P. helped in the experiments planning and execution. C.R.A., B.C.A.-M. and G.D.-L processed the data and performed statistical analyses. G.D.-L. wrote the original manuscript. C.R.A., M.C.S.P and G.D.-L. critically reviewed the data analysis and the final manuscript. All authors read and approved the final manuscript.
Financial support
This study was partially financed by the Conselho Nacional de Desenvolvimento Científico e Tecnológico – Brasil (CNPq: 301744 / 2019-0), Fundação Carlos Chagas Filho de Amparo à Pesquisa do Estado do Rio de Janeiro – FAPERJ (E-26/010.000983/2019, E-26/200.799/2021 and E-26/204.188/2021) and the Coordenação de Aperfeiçoamento de Pessoal de Nível Superior – Brasil (CAPES: Finance Code 001). Carlos R. Alves and Mirian C. S. Pereira are research fellows at CNPq.
Conflicts of interest
The authors declare no conflict of interest.
Ethical standards
The L. (V.) braziliensis strain used in this work is registered on the Brazilian SisGen (A41DBDD), in compliance with the national law (13.123/2015). Animal experimental procedures performed here were approved by the Committee for the Ethical Use of Animals of Instituto Oswaldo Cruz (L0038/19).