





Introduction
Patients who undergo hematopoietic cell transplant (HCT) and chemotherapy for leukemia have one of the highest incidences of healthcare-associated Clostridioides difficile infection (CDI). Reference Dubberke, Reske and Olsen1 Such patients have near-ubiquitous antimicrobial exposures, immunosuppression, and a high frequency of prolonged hospitalizations. Reference Dubberke, Reske and Olsen1,Reference Austin, Sweet and Likar2 In these patients, attribution of CDI acquisition sources is challenging. Their colonization with toxigenic C. difficile at admission is high, and during hospitalization, they may experience intermittent carriage along with non-infectious diarrhea, complicating CDI diagnosis. Reference Austin, Sweet and Likar2 In intensive care units, patients who test positive for toxigenic C. difficile on admission are up to 24 times more likely to develop a healthcare-onset CDI compared to non-colonizers. Reference Baron, Ostrowsky and Nori3–Reference Miles-Jay, Snitkin and Lin5 Patients can also become colonized and subsequently develop CDI during hospitalization. Both CDI and asymptomatic colonized (AC) patients with C. difficile are a source of pathogen transmission. CDI patients are often considered more infectious than AC patients, as they shed and contaminate their surrounding environments more extensively than AC patients. Reference McFarland, Mulligan, Kwok and Stamm6,Reference Gilboa, Houri-Levi and Cohen7 However, AC patients outnumber CDI patients and are not targeted for transmission-blocking interventions. Reference Kociolek, Gerding and Carrico8
The contribution of CDI and AC to new infections can be quantified using transmission models of C. difficile dynamics in healthcare settings. Reference Lanzas, Jara, Tucker and Curtis9 However, predictions are uncertain because models are often calibrated using only diagnostic tests performed on suspected CDI cases, as testing to identify AC is rarely performed in clinical practice. Reference Khader, Munoz-Price and Hanson10 Here, we aim to quantify the roles of CDI and AC patients in C. difficile importation and transmission within oncological units by integrating CDI diagnostic and active surveillance testing for AC patients into a transmission model of C. difficile acquisition. Specifically, we developed a modeling framework that embeds a transmission model of C. difficile, along with an observational model that simulates patient testing and sampling frequency, so that sparse testing and diagnostic tests’ characteristics can be accounted for. Based on our prior work modeling healthcare C. difficile dynamics, Reference Lanzas, Dubberke, Lu, Reske and Gröhn11,Reference Stephenson, Lanzas, Lenhart and Day12 we hypothesized that AC patients would have a greater contribution to importation and transmission in these oncological units compared to medical units.
Methods
Study design and data sources
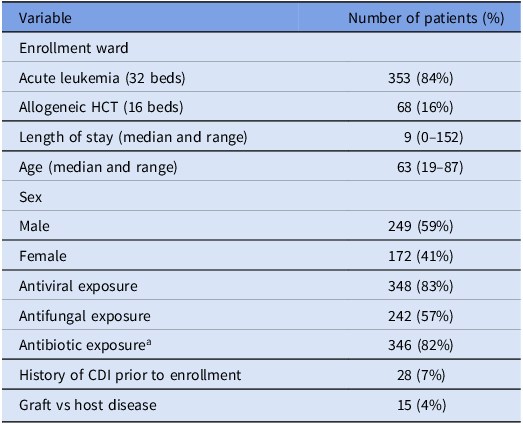
A prospective cohort study on C. difficile carriage was conducted in 2 leukemia and HCT transplant units at Barnes-Jewish Hospital in St. Louis, MO, between January 19 and July 22, 2019. The study window was determined by the enrollment period of the parent prospective cohort and not based on seasonal or staffing grounds. Patient demographic characteristics are in Table 1. Stool and rectal swabs for C. difficile culture and nucleic acid amplification testing (NAAT) were collected at enrollment and weekly until ward discharge. Of the 421 unique patients admitted to the study units, 384 (91%) consented to testing. Additional data were collected from the electronic records, including patient admission and discharge times, room assignments, medications, and laboratory tests. Clinical testing was triggered by symptomatic presentation and consisted of an enzyme immunoassay (EIA) test for C. difficile toxin (Alere TOX A/B II). Although EIA is more specific for CDI testing as it measures the presence of the toxin, NAAT tests measure the presence of toxigenic strains of C. difficile, making it more appropriate for AC. Reference Li, Dendukuri and Longtin13,Reference Burnham and Carroll14 We also collected shift-level healthcare worker (HCW) staffing assignments. C. difficile isolates were also sequenced as part of a complementary study to evaluate the role of C. difficile strain diversity in colonization outcomes. Reference Newcomer, Fishbein and Zhang15 Environmental swabs were collected for C. difficile culture from bedrails, keyboards, and sink surfaces using 3 E-swabs (Copan). Reference Newcomer, Fishbein and Zhang15,Reference Lee, Reske and Hink16
Patient demographic information for the 421 patients in the study units

Table 1. Long description
The table presents patient demographic information for a study involving 421 patients in leukemia and HCT transplant units. It has 10 rows and 2 columns. The columns are labeled ‘Variable’ and ‘Number of patients (%)’. The rows detail various patient characteristics: Enrollment ward with Acute leukemia (32 beds) having 353 patients (84 percent) and Allogeneic HCT (16 beds) having 68 patients (16 percent). Length of stay (median and range) is 9 (0-152). Age (median and range) is 63 (19-87). Sex is divided into Male with 249 patients (59 percent) and Female with 172 patients (41 percent). Antiviral exposure includes 348 patients (83 percent), Antifungal exposure includes 242 patients (57 percent), and Antibiotic exposure includes 346 patients (82 percent). History of CDI prior to enrollment is noted in 28 patients (7 percent), and Graft vs host disease is present in 15 patients (4 percent).
Note: HCT, hematopoietic cell transplant; CDI, Clostridioides difficile infection.
a Antibacterial prophylaxis was not used. Antibiotics were started when there was a clinical concern for infection.
To transform the testing data into a format suitable for comparison with model simulations, we assigned each patient’s infection status as susceptible, AC, or CDI on days when at least 1 test result was available to support the classification. Patients with a positive EIA test were considered CDI-positive. If a patient tested positive by NAAT or culture and had either an oral vancomycin start date or a CDI diagnosis date within 2 days following the positive test, they were also considered CDI-positive. Conversely, if a patient tested positive by NAAT or culture but lacked a positive EIA test or corresponding treatment or diagnosis date, they were classified as AC. Patients with only negative test results were classified as susceptible. If both positive and negative results were obtained on the same day, the patient was considered positive. Across all patient-days for the patients on-unit during the study period, only 10.3% included at least 1 C. difficile test. Furthermore, because negative EIA results rule out symptomatic infection but provide no information about asymptomatic colonization, we could assign infection status for only 9.1% of patient-days.
Transmission and observation models
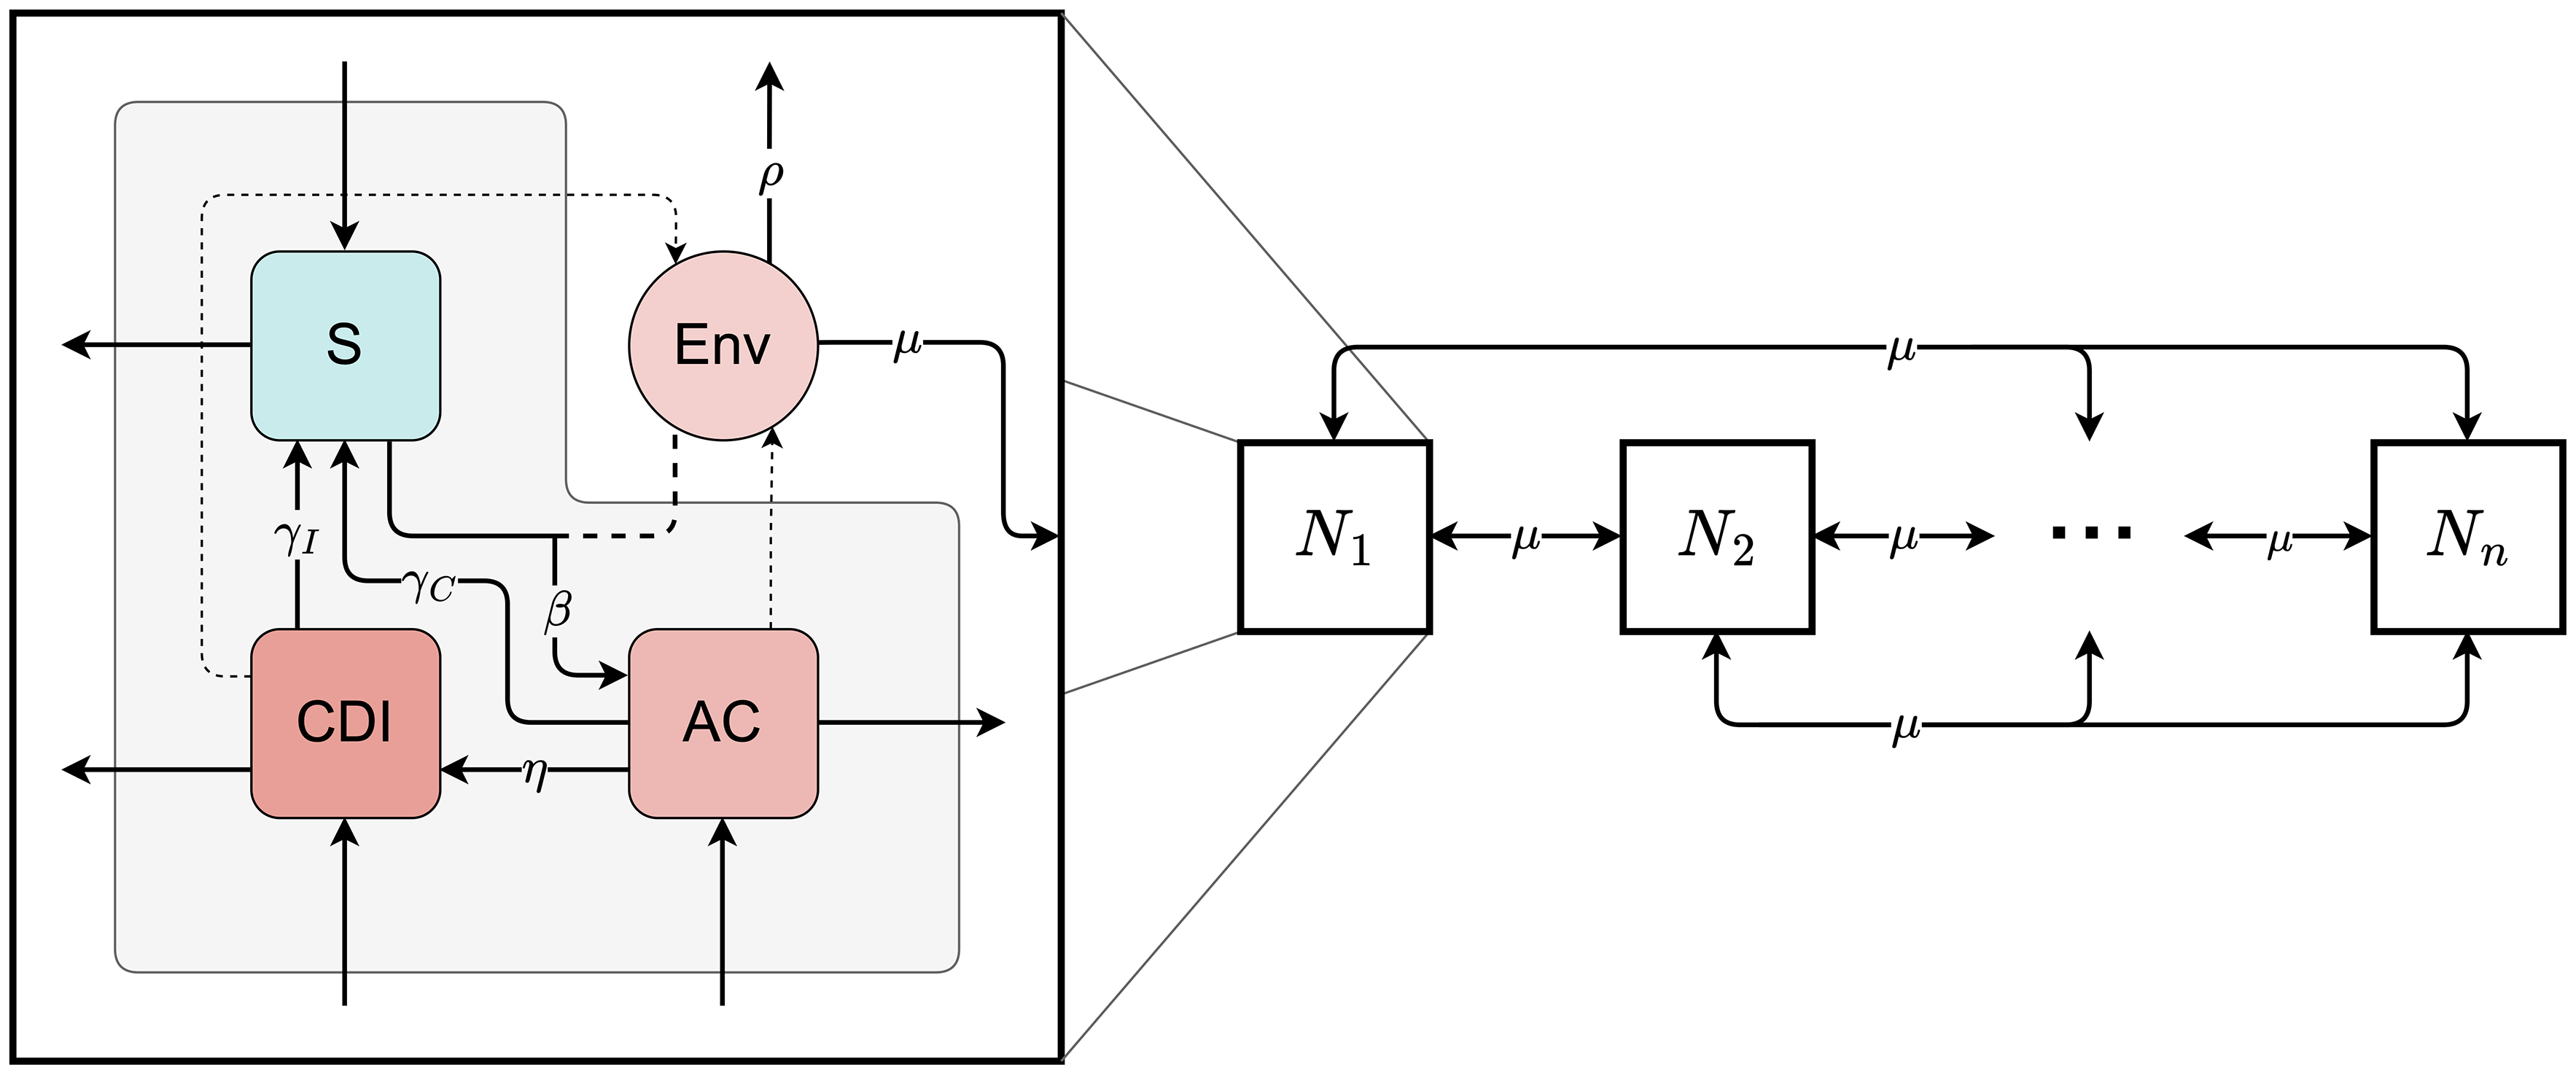
We developed a stochastic, individual-based network model to simulate C. difficile acquisition and transmission. Each patient was tracked individually over time, and the model accounted for patient infection status, environmental contamination, and HCW-mediated interactions (Figure 1). Each patient was assigned an infection status that could change dynamically among 3 categories: susceptible (S), AC, or CDI. Environmental contamination was tracked in each room and represented all C. difficile exposure sources accessible during care, including contamination associated with patient contact (eg, skin, bedding, frequently touched surfaces). AC and CDI patients were assumed to shed C. difficile at equal rates. We performed a preliminary sensitivity analysis using an alternative 30:1 shedding ratio for CDI vs AC. These shedding ratios are the most used in C. difficile transmission models. Reference Lanzas, Jara, Tucker and Curtis9 This assumption did not substantially alter model behavior (see Supplemental Material).
A visualization of the stochastic transmission network model. The right side of the figure depicts individual patient rooms (N 1) and their connections through μ, which represents the rate at which healthcare worker movement transfers contamination between rooms. The left side of the figure shows the possible patient infection states (S for susceptible, AC for asymptomatic colonized, and CDI for Clostridioides difficile infection), along with the room’s environmental contamination level. Environmental contamination encompasses all sources of C. difficile exposure accessible during patient care, including transient patient-associated contamination, such as spores on skin, bedding, or frequently touched surfaces. Within each room, several events can occur: β for colonization, η for symptom development, γ for recovery or decolonization, and ρ for cleaning or decontamination. Events that involve interactions between the patient state and the room’s environmental contamination are indicated with dashed lines.

The model was embedded in a dynamic contact network informed by HCW staffing patterns. All patient movement and occupancy were modeled at the room level. Using staff room-level assignments, we inferred connections between rooms based on shared HCWs. For each day i, we constructed a weighted adjacency matrix G i whose entry g(n,m) is the average number of HCW assigned to both room n and room m, across the shifts for which data were available on that day. The weights determine the destination of an HCW-mediated contamination event: when such an event occurs (at rate µ), an occupied and contaminated room is selected at random as the origin, and the destination room is drawn with probability proportional to the number of staff shared with the origin room. Patients transferring between rooms during their stay could further contribute to environmental spread. Contaminated rooms, in turn, posed a risk of transmission to newly admitted susceptible patients.
Each contamination event included a record of the source patient and their infection status, enabling indirect patient-to-patient transmission and linking transmission pairs. Transmission was defined as the occurrence of a new colonization event, which could occur when a susceptible patient occupied a contaminated room and became AC. When colonization occurred, the model assigned an attribution source by randomly selecting from the prior patients with contamination present in that room at that time, which could originate from a previous occupant whose contamination was not removed by terminal cleaning, from the current occupant if colonized or infected, or from transfer by an HCW shared with another contaminated room. A patient who contaminates the same room more than once is recorded only once under their most recent status, so no single patient can appear as multiple candidate sources within a room. The attributed source is then drawn uniformly from this set. The candidate set is typically small, because sources are removed whenever a cleaning event succeeds. Because an equal 1:1 shedding ratio was used, AC and CDI contamination sources were equally as likely to be selected during the random sampling to determine colonization source.
Transitions in patient status followed stochastic rules based on the duration of the incubation and infection periods. The model operates in continuous time, with transitions and events occurring probabilistically based on rate parameters. Patients could progress from S to AC, and from there develop symptoms consistent with CDI. AC and CDI patients could recover from either state. Routine daily cleaning was modeled as an imperfect decontamination process. Terminal cleaning following patient discharge was also included.
We implemented an observation model to translate predicted patient statuses into observed positive test results, accounting for testing frequency and test characteristics. The observation model incorporated the actual sample collection dates for each test and accounted for diagnostic test performance by considering both false positives and false negatives.
Model parameterization
We informed model parameters through a combination of literature review, institutional protocols, and data-driven inference. The following parameters were fixed based on existing empirical studies or clinical knowledge: the shedding ratio between CDI and AC patients, the success probability of terminal cleaning, and the probability that the observation model selects a CDI patient for EIA testing when one is present.
The timing of patient admissions, discharges, and room transfers, as well as test sample collection dates, were extracted directly from hospital records and used to define patient room-stays and testing schedules. The probabilities of being AC or CDI-positive upon admission were estimated by examining the results of all tests ordered within 48 hours of room admission.
Parameters related to EIA test sensitivity and specificity for CDI patients were drawn from published estimates. Reference Burnham and Carroll14 For AC patients, the sensitivity and specificity of NAAT and culture were estimated using the 2-sample, 2-population Hui–Walter method as implemented in the runjags package in R, Reference Hui and Walter17 with populations defined by unit and assuming independence between tests.
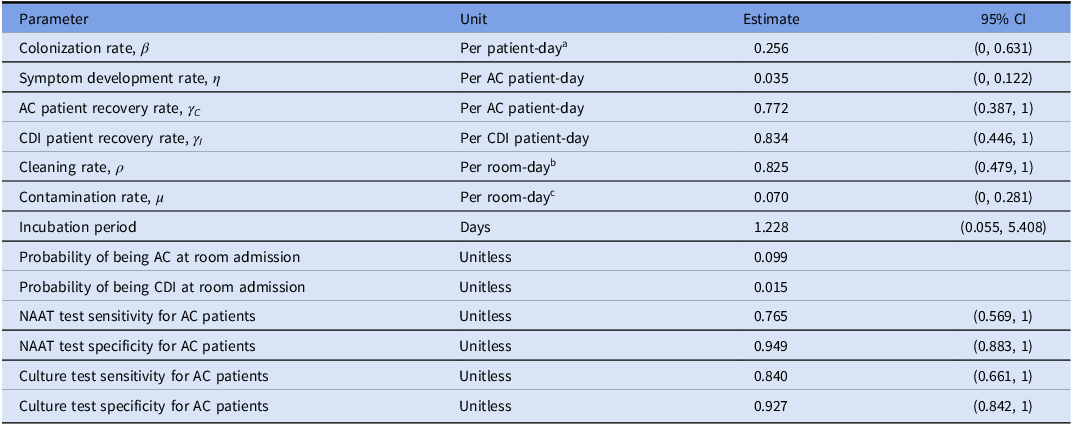
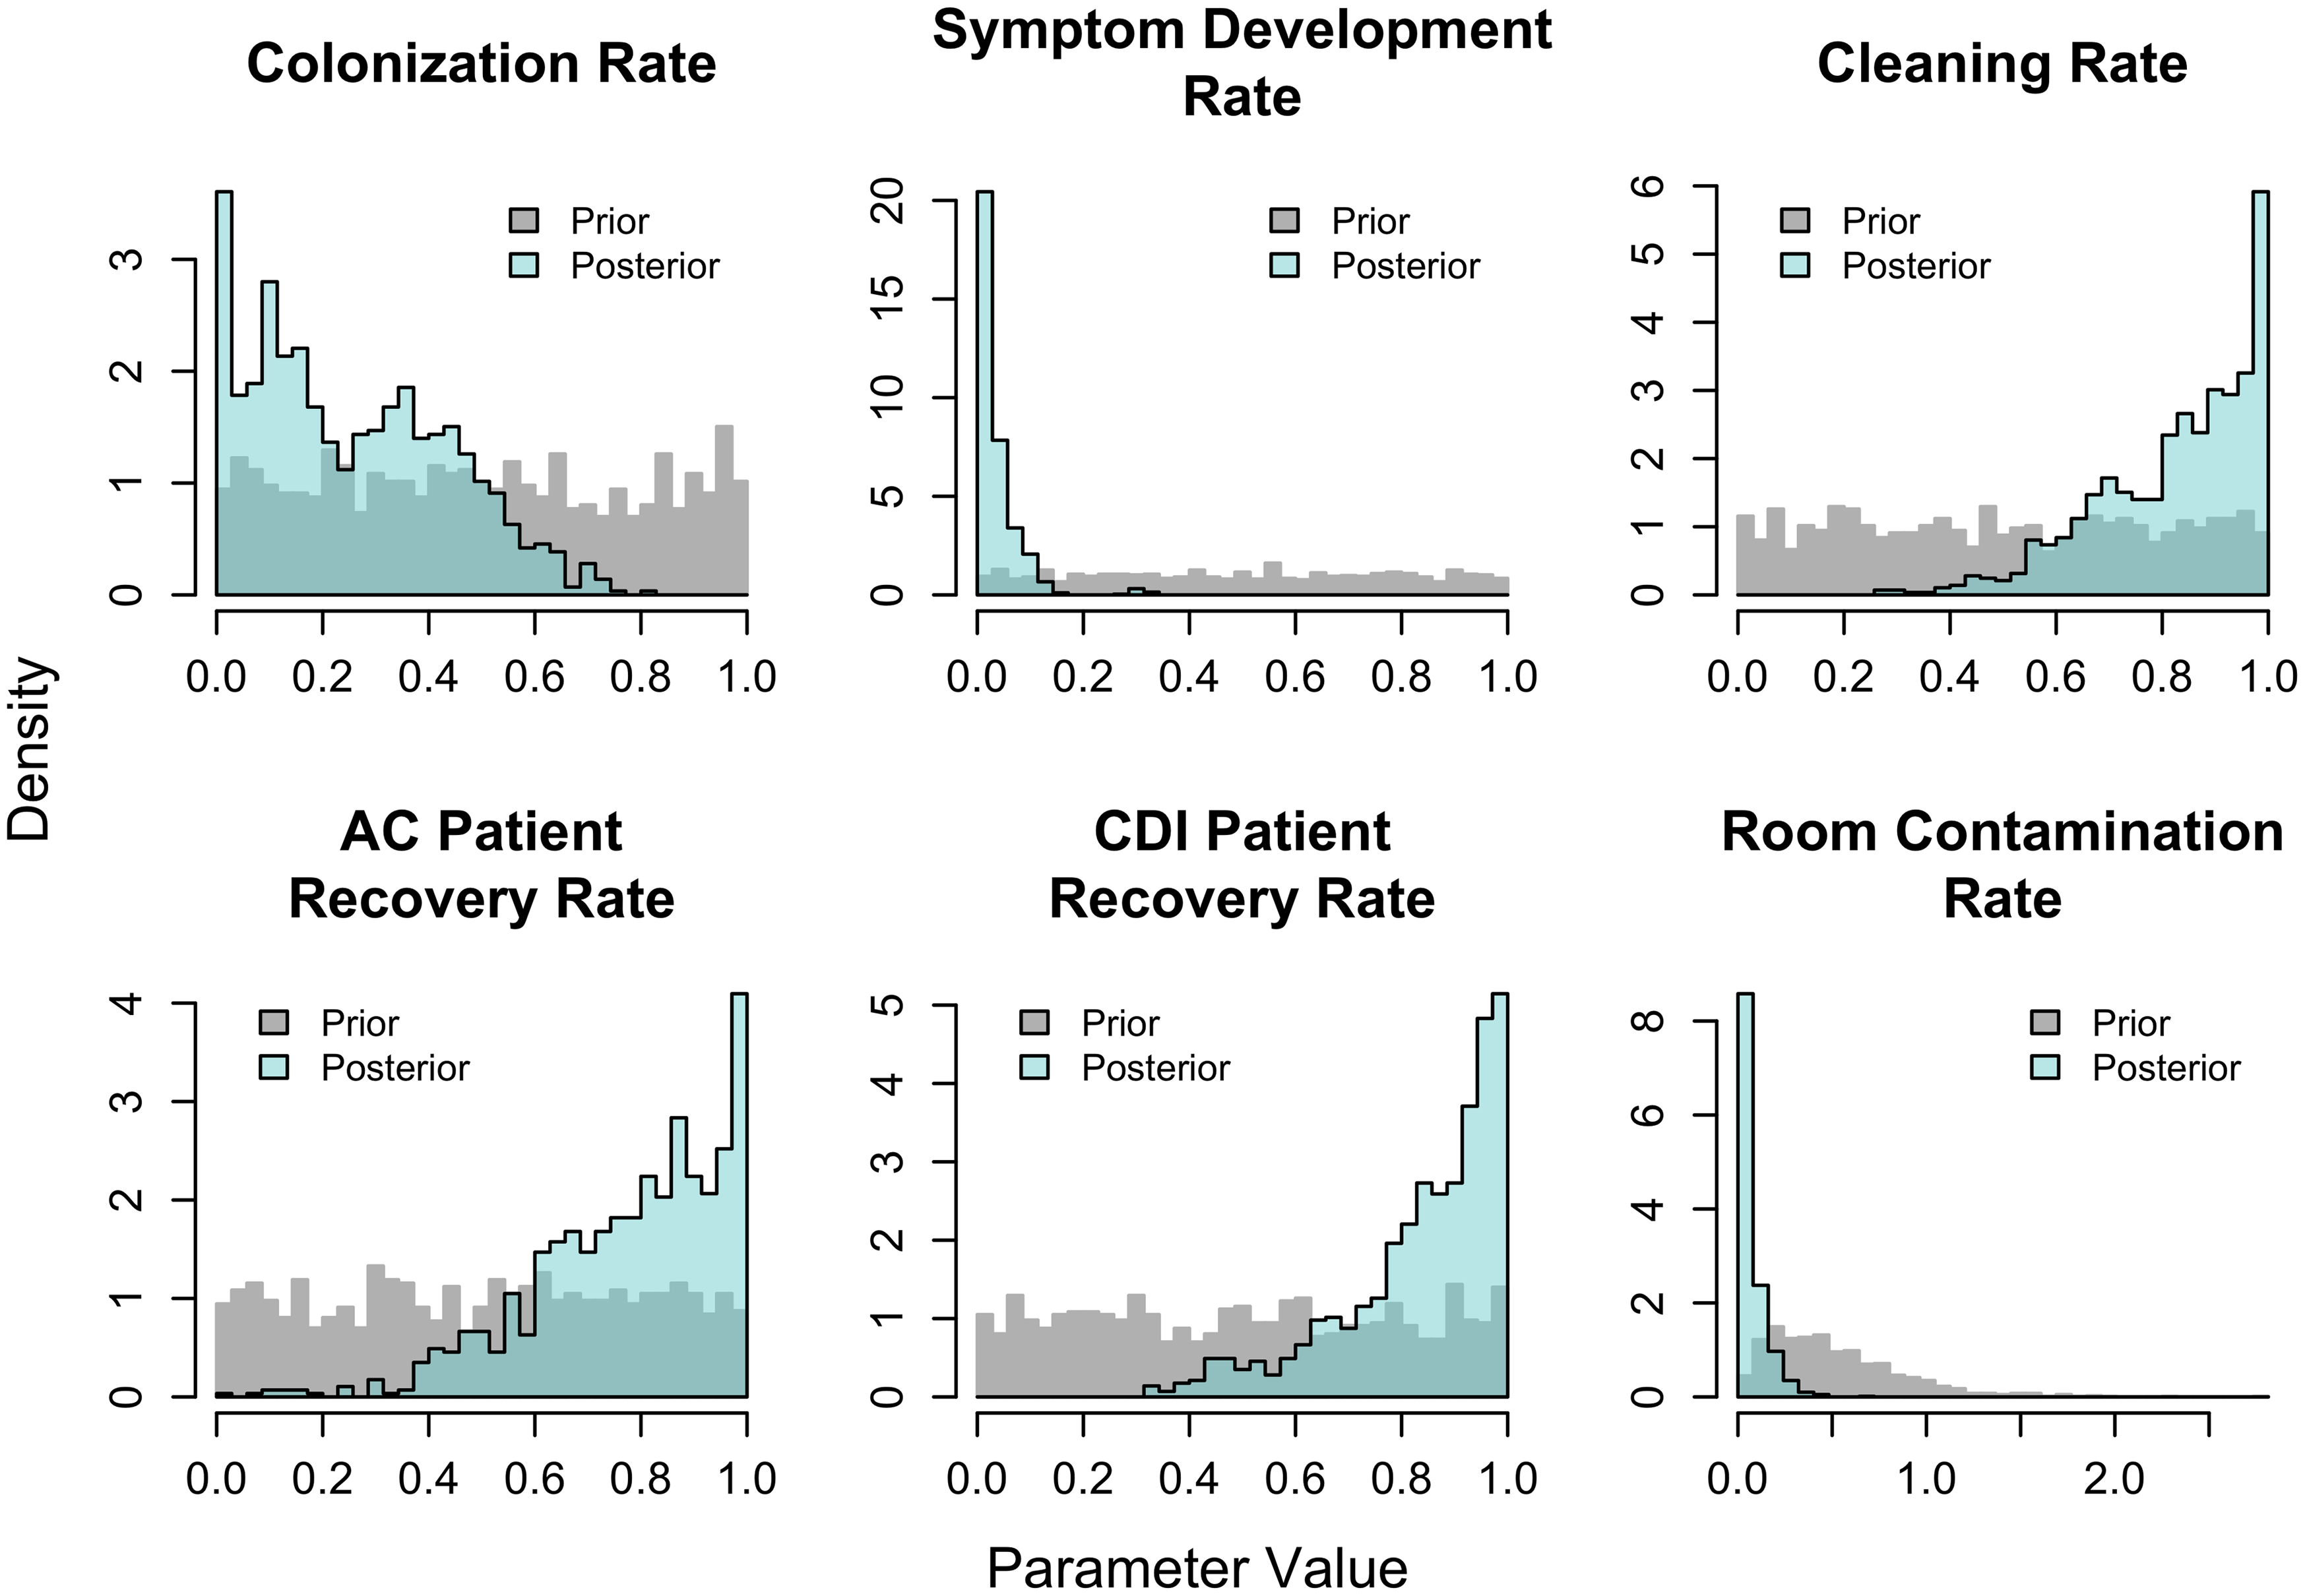
We used an augmented particle filtering approach to estimate 6 unmeasurable parameters: the rates of colonization from contaminated rooms (β), the progression from asymptomatic to CDI (η), AC and CDI shedding (γC and γI ), environmental HCW-mediated contamination (μ) and decontamination (ρ) through cleaning (Table 2). Reference Arulampalam, Maskell, Gordon and Clapp18,Reference Yang, Karspeck and Shaman19 Particle filtering was selected because it allowed the stochastic, partially observed transmission model to be calibrated directly to the sequential testing observations while simultaneously propagating uncertainty in the unobserved transmission process, without requiring the summary-statistic and tolerance choices of Approximate Bayesian Computing or the repeated high-dimensional latent-state likelihood evaluations required by conventional or particle Markov chain Monte Carlo. Reference Hartig, Calabrese, Reineking, Wiegand and Huth20 We simulated 1,000 parameter sets and compared predicted weekly counts of positive tests with observed data. At each weekly time step, parameter sets that fit the data less well were discarded, whereas those that fit it more closely were retained and resampled. Once the filtering algorithm converged, we obtained posterior distributions for the 6 estimated model rates (Figure 3). Convergence was defined as successive parameter estimates remaining within the same order of magnitude, with no more than a one-digit change in the leading significant figure, or after 3 iterations had been completed. More details on methodology are provided in the Supplementary Materials. The code is publicly available at GitHub: https://github.com/lanzaslab/cdifficile
Parameter estimates for key model parameters. The 6 model rates obtained from particle filtering are shown first, followed by parameters estimated directly from data. Point estimates from particle filtering are taken to be the posterior mean, and the 95% CI is the 95% interval. Point estimates for test sensitivity and specificity are taken to be the medians, and the 95% intervals are the corresponding prediction intervals. aThe colonization rate unit is per patient-day where the patient is susceptible and in a room exposed to C. difficile. bThe unit for the cleaning rate is per room-day where the room is occupied and contaminated. cThe unit for the contamination rate is per room-day where the room is occupied, uncontaminated, and shares at least 1 healthcare worker with an occupied room that is contaminated

Table 2. Long description
A table with 12 rows and 4 columns. The columns are labeled Parameter, Unit, Estimate, and 95% CI. The table lists various parameters related to a model, their units, point estimates, and 95% confidence intervals. Row 1: Colonization rate, Per patient-day, 0.256, (0, 0.631). Row 2: Symptom development rate, Per AC patient-day, 0.035, (0, 0.122). Row 3: AC patient recovery rate, Per AC patient-day, 0.772, (0.387, 1). Row 4: CDI patient recovery rate, Per CDI patient-day, 0.834, (0.446, 1). Row 5: Cleaning rate, Per room-day, 0.825, (0.479, 1). Row 6: Contamination rate, Per room-day, 0.070, (0, 0.281). Row 7: Incubation period, Days, 1.228, (0.055, 5.408). Row 8: Probability of being AC at room admission, Unitless, 0.099. Row 9: Probability of being CDI at room admission, Unitless, 0.015. Row 10: NAAT test sensitivity for AC patients, Unitless, 0.765, (0.569, 1). Row 11: NAAT test specificity for AC patients, Unitless, 0.949, (0.883, 1). Row 12: Culture test sensitivity for AC patients, Unitless, 0.840, (0.661, 1). Row 13: Culture test specificity for AC patients, Unitless, 0.927, (0.842, 1).
Note: AC, asymptomatic colonized; CDI, Clostridioides difficile infection; CI, confidence interval; NAAT, nucleic acid amplification testing.
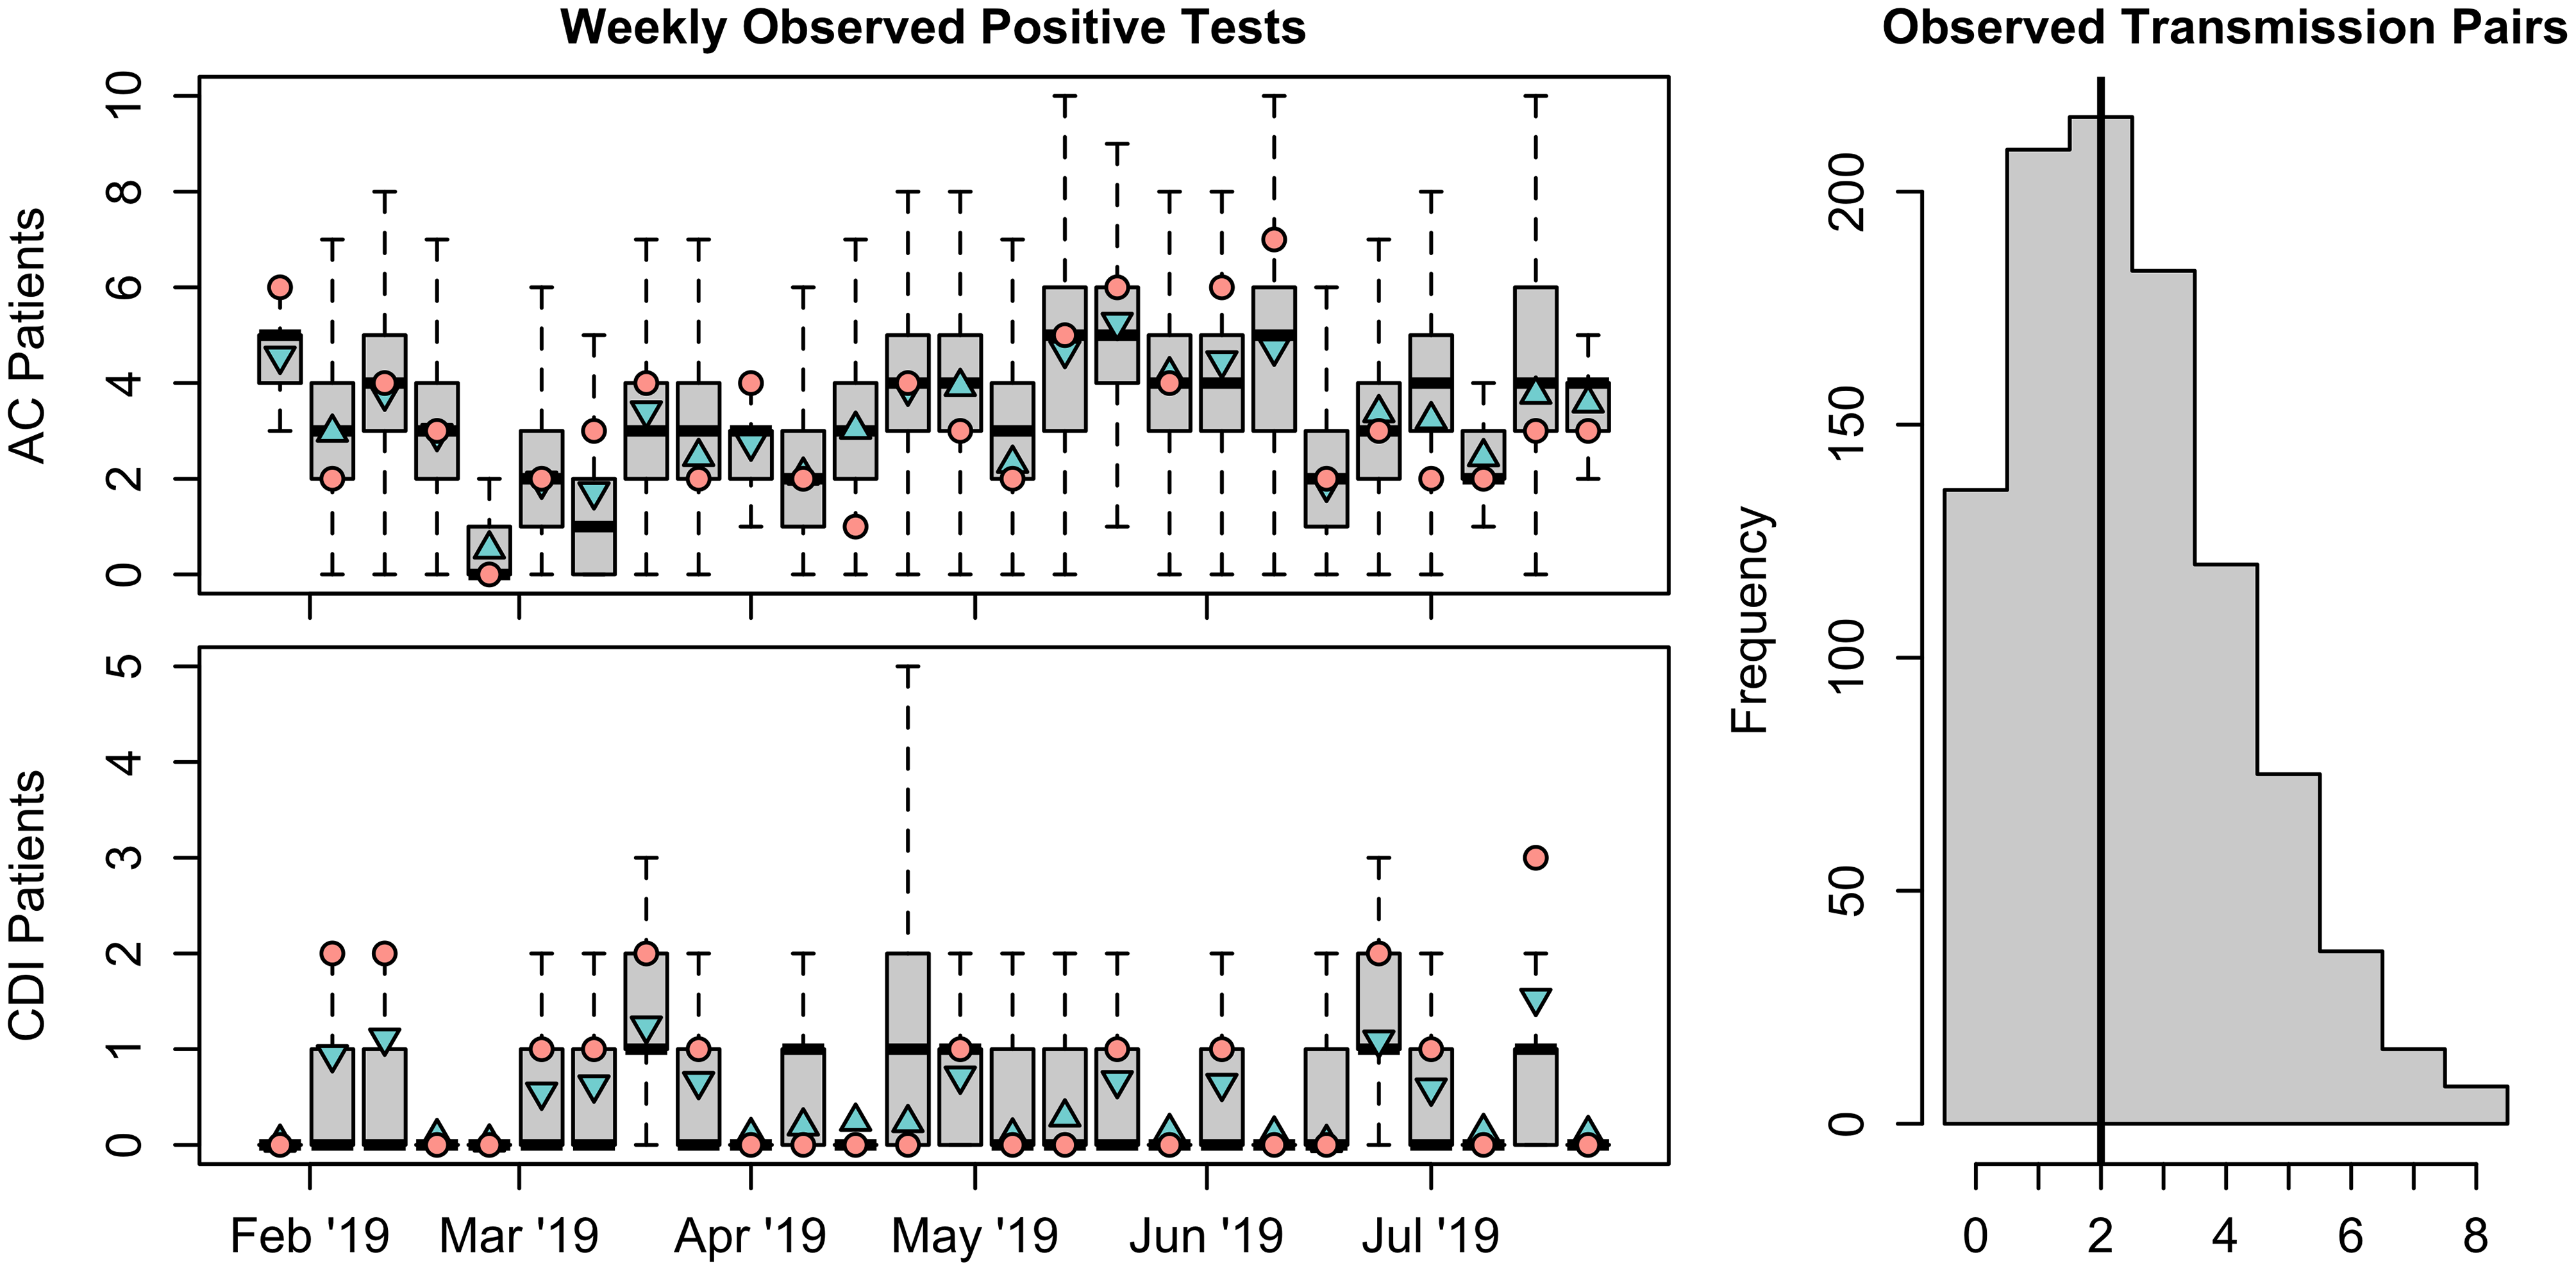
On the left, boxplots of weekly observed positive tests from asymptomatic colonized (AC) and Clostridioides difficile infection (CDI) patients for 1,000 simulations from the calibrated model are shown. The pink circles in these figures are the data. The blue triangles represent the weekly weighted means from the observation model. Upward-pointing triangles indicate that the model overestimates the number of AC or CDI patients compared to the observed data, and model underestimation is indicated with downward-pointing triangles. On the right, a histogram of observed transmission pairs generated from 1,000 simulations from the calibrated model is shown. The black vertical line corresponds to the 2 transmission pairs identified using whole-genome sequencing. Reference Newcomer, Fishbein and Zhang15

Histograms of the posterior distributions obtained for unknown model parameters after particle filtering. The prior distributions are shown in gray for comparison.

Figure 3. Long description
Panel A: A histogram shows the colonization rate with density on the vertical axis and parameter value on the horizontal axis. The prior distribution is in gray, and the posterior distribution is in light blue. Panel B: A histogram depicts the symptom development rate with density on the vertical axis and parameter value on the horizontal axis. The prior distribution is in gray, and the posterior distribution is in light blue. Panel C: A histogram illustrates the cleaning rate with density on the vertical axis and parameter value on the horizontal axis. The prior distribution is in gray, and the posterior distribution is in light blue. Panel D: A histogram presents the AC patient recovery rate with density on the vertical axis and parameter value on the horizontal axis. The prior distribution is in gray, and the posterior distribution is in light blue. Panel E: A histogram shows the CDI patient recovery rate with density on the vertical axis and parameter value on the horizontal axis. The prior distribution is in gray, and the posterior distribution is in light blue. Panel F: A histogram depicts the room contamination rate with density on the vertical axis and parameter value on the horizontal axis. The prior distribution is in gray, and the posterior distribution is in light blue.
Results
The model closely reproduced the observed weekly number of positive tests, with 19 of 26 weekly AC observations (73.1%) and 23 of 26 weekly CDI observations (88.5%) falling within the interquartile range of the particle distribution (Figure 2). All observed AC and CDI-positive test counts fell within the central 95% particle interval. We also compared the number of simulated transmission pairs with those identified through whole-genome sequencing analysis. Reference Newcomer, Fishbein and Zhang15 The model-inferred and empirically observed transmission pairs overlapped (Figure 2). The model parameters inferred from the study data, along with their mean values, are listed in Table 2. The posterior distributions for the parameters estimated using particle filtering are presented in Figure 3.
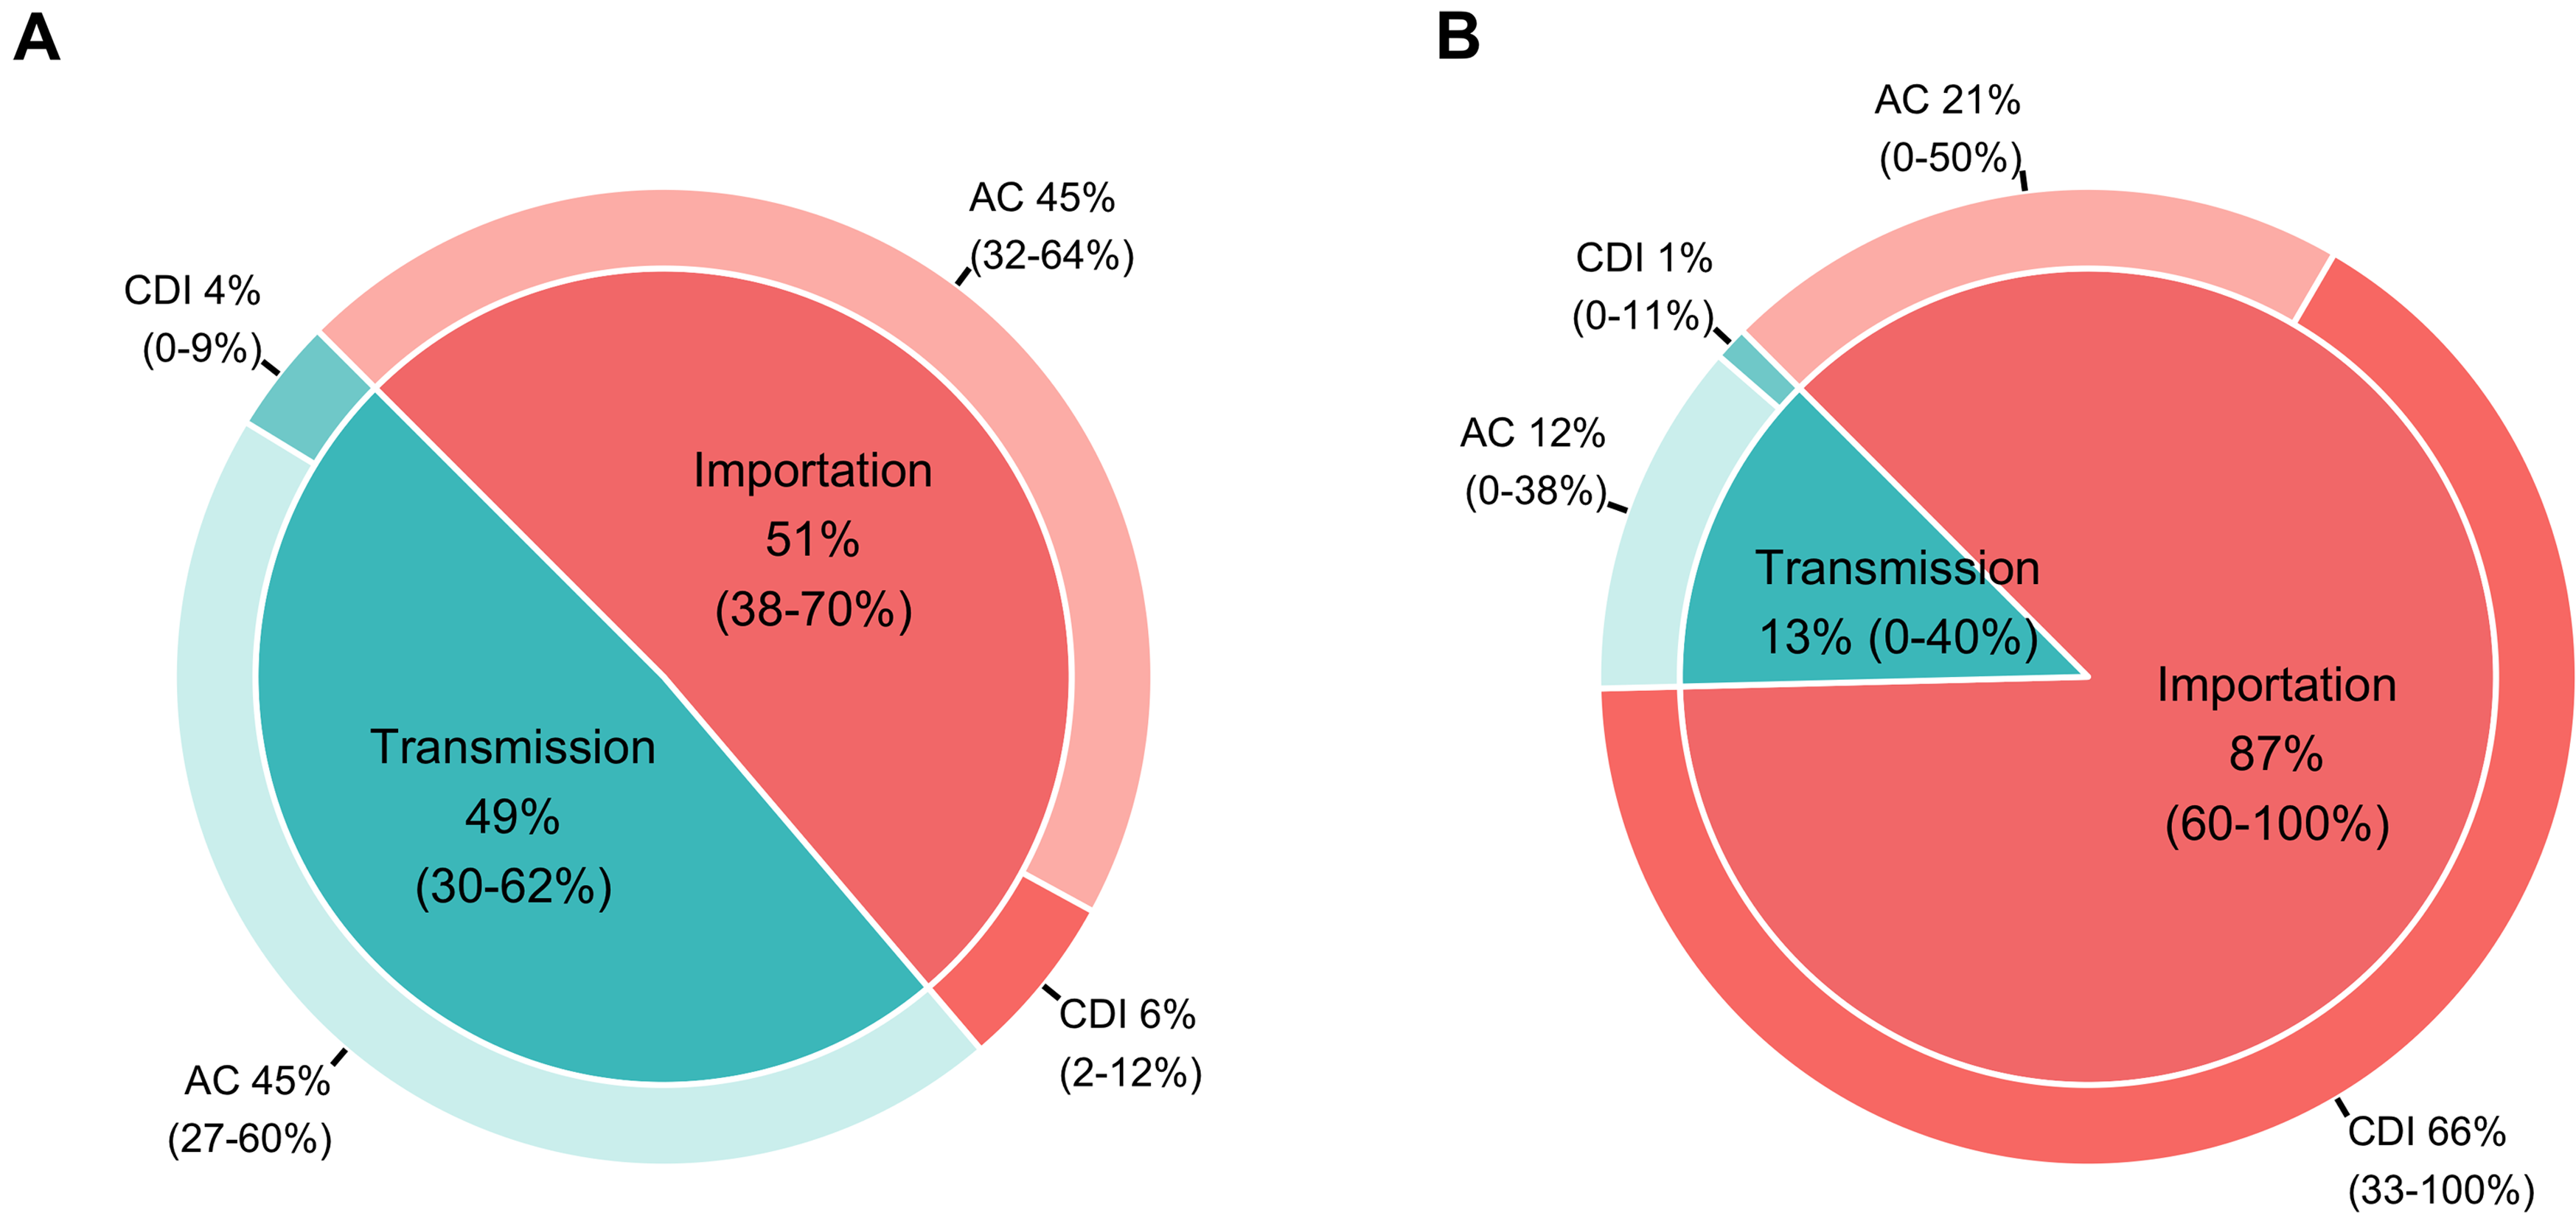
We simulated the calibrated model for 1,000 replications and averaged the source attribution for new AC and CDI cases over the 6-month study period (Figure 4). Figure 4A summarizes the attribution of all new AC and CDI. The ranges for the source attribution are large because calibration relied on testing data from only 18 CDI cases and 85 AC cases over the 6-month study period; the attribution is only weakly constrained by the available data. Approximately half were due to importation into the room as AC or CDI. AC was the source in 92% of the transmission events. When considering only new CDI, 87% (range: 33%–100%) originated from importations (Figure 4B). Within importations, 76% were admitted already as CDI patients. The rest were AC patients who transitioned to CDI while in the unit. When unit transmission was responsible for CDI cases, on average, AC patients were the source in 92 % of transmission events. To assess the robustness of these findings, we conducted a global sensitivity analysis focused on the average number of new colonizations per week across the 4 modeled acquisition pathways (see Supplementary Materials). The analysis indicated that new colonizations were most sensitive to the rates of colonization (β), environmental contamination (μ), and cleaning (ρ). Other parameters had minimal influence on source attribution outcomes.
Pie chart for the source attribution of newly identified asymptomatic colonized (AC) and Clostridioides difficile infection (CDI) to ward transmission, with an AC or CDI as the source, or importation (ie, the patient was already admitted to the room as AC or CDI). All model-predicted AC or CDI patients, both observed and unobserved, are included. Subfigure A shows the attribution proportion for all newly identified AC and CDI. Subfigure B shows only the subset of those admitted as CDI or progressing to CDI during the room stay.

Discussion
Our model closely reproduced the number of positive tests and observed transmission pairs (Figure 2), indicating that the model captures the frequency and detectability of transmission events, even under low sampling intensity. Comparing the results from the transmission model with those of the observation model showed that a large percentage of predicted AC patients and transmission pairs were not detected through testing. The transmission model estimated 3.9 new colonization events per week, whereas the observation model indicates that only 0.9 (23%) of these were observed. This highlights how acquisition events are only partially observed.
Considering only colonizations that progress to CDI yields a different picture of acquisition dynamics than including both AC and CDI patients. We found that room importation and transmission contributed similarly to new colonizations, and AC were the main contributors through both (Figure 4A). However, when only patients who progressed to CDI were considered, most CDI cases were imported, either as CDI patients at room admission or AC at room admission and subsequent progression to CDI (Figure 4B). Similar to our results, Bruminhent et al. Reference Bruminhent, Wang and Hu21 traced the CDI cases in patients undergoing HTC to patients already admitted as AC, rather than to within-unit transmission. They used EIA to screen for AC at admission rather than NAAT testing, which may have led to an underestimation of AC at admission and subsequent transmission. Reference Bruminhent, Wang and Hu21 Prior work in other types of units has also shown that within-unit transmission does not fully explain observed C. difficile cases, Reference Miles-Jay, Snitkin and Lin5,Reference Lanzas, Dubberke, Lu, Reske and Gröhn11 and thus interventions that prevent disease in AC can potentially reduce hospital-onset CDI cases. Reference Lanzas and Dubberke22
We estimated epidemiological parameters for C. difficile dynamics (Table 2 and Figure 3). Our admission probabilities for AC patients align with prior estimates for this patient population. Reference Jain, Croswell and Urday-Cornejo23,Reference Muñoz-Price, Hanson and Singh24 Overall, patients with leukemia or undergoing HCT have a higher AC prevalence than other patient populations. Reference De-la-Rosa-Martínez, Villaseñor-Echavarri, Vilar-Compte, Mosqueda-Larrauri, Zinser-Peniche and Blumberg25 The estimated colonization rate suggests an average of 4 days between a C. difficile exposure and acquisition. Once a patient is colonized, the transition rate from AC to CDI is 0.035 per AC-patient day, corresponding to a mean transition time of approximately 28 days. However, in the model simulations, most AC individuals did not transition to CDI. Considering only patients who transitioned to CDI reveals that the incubation period was typically short (<2 days). Our findings align with early work on C. difficile acquisition, which indicated that the transition from AC to CDI was infrequent but, when it occurred, it did so shortly after colonization. Reference Bruminhent, Wang and Hu21,Reference Samore, DeGirolami, Tlucko, Lichtenberg, Melvin and Karchmer26,Reference Kyne, Warny, Qamar and Kelly27 Curry et al estimated that the median incubation period was 6 days for patients with prior negative cultures within 14 days, with an interquartile range of 3 to 12 days. Reference Curry, Hecker and O’Hagan28 Our shorter incubation period estimate likely results from reduced gut microbiota diversity and pronounced gut dysbiosis, which are often present in these patients due to extensive antimicrobial exposure. Reference Peled, Gomes and Devlin29 Our estimates for the recovery rates of AC and CDI patients indicated a short duration of C. difficile shedding (<2 days), suggesting that patients transition quickly between multiple positive and negative test results, and that most C. difficile new positive tests in the unit may reflect multiple transient carriage. Reference Curry, Hecker and O’Hagan30 The rate of cleaning was 0.825 per room-day, which can be interpreted as the probability that rooms are successfully decontaminated from C. difficile during routine cleaning. The 95% central interval for this estimate was wide, indicating that our data were unlikely to be informative about this parameter. The rate of room contamination via HCW movement indicated that contaminated rooms were responsible for a subsequent contamination approximately every 14 days.
The main strength of the study is that we used both diagnosis and active surveillance data to fit the model. This study was conducted in a single healthcare facility; therefore, our parameter estimates and conclusions regarding the acquisition and transmission of C. difficile may not generalize to other settings or patient populations. Nonetheless, the modeling framework is readily adaptable to comparable datasets and can support future efforts to discern colonization, progression to symptomatic infection, and transmission pathways in other patient populations. The contact network was constructed from nurse-to-room assignments, capturing whether 2 rooms were plausibly linked by shared staff but not how often each room was entered, by whom, or for how long, which could potentially bias model results if, for example, patients with CDI were visited less often because of contact precautions or more often because of greater acuity. Another potential source of bias is not accounting for transmission from family/visitor, which could bias the models toward overpredicting importation; this bias is likely to be small given that the transmission pathways accounted for are more likely to be dominant.
In conclusion, our findings imply that infection control focused on CDI effectively reduces onward transmission from CDI, as indicated by the low contribution of CDI to new colonizations. Rooms were single-occupancy, and infection control included daily and terminal discharge cleaning with bleach for all rooms and contact precautions for patients with CDI from diagnosis until discharge. Reference Lee, Reske and Hink16 Interventions targeting AC can further reduce CDI by either reducing onward transmission from AC or by reducing the progression from AC to CDI. However, their implementation remains challenging. The low detection of AC indicates that over half of colonized patients would have been missed by a single admission specimen. Reference Lee, Reske and Hink16 Although AC are more likely to transition to CDI than individuals who test negative for C. difficile, the absolute risk of progression is lower than 20, Reference Miles-Jay, Snitkin and Lin5,Reference Curry, Hecker and O’Hagan30,Reference Turner, Grambow and Polage31 and interventions such as antibiotic prophylaxis can carry additional risks, including infections with vancomycin-resistant enterococci and further disruption of the gut microbiota. Reference Viana-Cardenas, Miranti and Tariq32
Supplementary material
The supplementary material for this article can be found at https://doi.org/10.1017/ice.2026.10557.
Acknowledgments
We would like to thank Avi Sawhney, who contributed to this work as an undergraduate researcher, for his assistance in analyzing HCW staffing data and generating the time-varying adjacency matrices used in the transmission model.
Financial support
This work was supported by the CDC BAA #200-2018-02926 (PI: Erik Dubberke), the CDC U01CK000587 (PI: Cristina Lanzas), the National Science Foundation Graduate Research Fellowship Program DGE-2137100 (PI: Savannah Curtis), and the National Institutes of Health (R35GM134934) (PI: Cristina Lanzas). Any opinions, findings, conclusions, or recommendations expressed in this material are those of the authors and do not necessarily reflect the views of the funders.
Competing interests
Olsen reports consulting fees from Pfizer and Ferring International. Burnham reports honoraria and support for meetings from American Society for Microbiology and employee of Pattern Bioscience. Dubberke reports research funding from Theriva Biologics, Pfizer, AstraZeneca, and Vedanta Bioscience, and consulting fees from GlaxoSmithKline, Pfizer, AstraZeneca, Vedanta Bioscience, and Idorsia. All other authors report no potential conflicts.
The study protocol was approved by the Washington University Human Research Protection Office (IRB #201810103).


 Open access

