


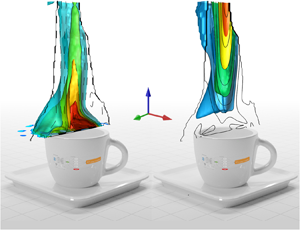

1. Introduction
Background oriented Schlieren (BOS) imaging has become an effective technique for flow visualization and quantitative fluid measurement in recent years (Raffel, Richard & Meier Reference Raffel, Richard and Meier2000; Richard & Raffel Reference Richard and Raffel2001; Raffel Reference Raffel2015). Compared to other flow visualization technologies, such as particle image velocimetry (PIV) (Raffel et al. Reference Raffel, Willert, Scarano, Kähler, Wereley and Kompenhans2018) and laser induced fluorescence (LIF) (Crimaldi Reference Crimaldi2008), BOS is less expensive and more flexible to set up in different experimental environments. Schlieren photography is generally used to visualize a flow that contains density gradients, which are caused by varying temperature, pressure or composition in species. In principle, BOS is based on the fact that an object inside a varying density medium will appear distorted due to the refraction of light rays. The distortion is then evaluated by using digital image correlation methods (Pan Reference Pan2018) for the reference image (without density gradients) and the distorted images. Alternatively, optical flow algorithms (Atcheson, Heidrich & Ihrke Reference Atcheson, Heidrich and Ihrke2009) and dot tracking methods (Rajendran, Bane & Vlachos Reference Rajendran, Bane and Vlachos2019) can also be applied to reconstruct the displacement field characterizing the distortion. In addition to the refractive index and the density, temperature field or other quantities can be further inferred by analysing the BOS images (Tokgoz et al. Reference Tokgoz, Geisler, Van Bokhoven and Wieneke2012). In the past two decades, the BOS technology has been applied to various applications in fluid mechanics (Venkatakrishnan & Meier Reference Venkatakrishnan and Meier2004; Goldhahn & Seume Reference Goldhahn and Seume2007; Nicolas et al. Reference Nicolas, Donjat, Plyer, Champagnat, Le Besnerais, Micheli, Cornic, Le Sant and Deluc2017; Grauer et al. Reference Grauer, Unterberger, Rittler, Daun, Kempf and Mohri2018). However, despite the substantial improvements of the hardware (e.g. from two-dimensional setup to tomographic setup Raffel et al. Reference Raffel, Richard and Meier2000), quantifying the entire fluid velocity and pressure fields continuously in space–time from BOS images has remained an open problem.
The existing algorithms for BOS velocimetry are mostly developed based on the cross-correlation method, which determines the displacement between two interrogation windows by searching the maximum of the correlation. For example, Bühlmann et al. (Reference Bühlmann, Meier, Ehrensperger and Rösgen2014) performed PIV analysis on two consecutive BOS speckle displacement fields and obtained a spatially resolved estimate of local convection velocities. However, the correlation-based methods are mostly optimized for PIV technology (which requires tracer particles in the flow) rather than BOS images (which usually visualize a scalar field). Raffel et al. (Reference Raffel, Hernandez-Rivera, Heine, Schröder and Mulleners2011) proposed a method called density tagging velocimetry to overcome this problem, in which the local density variation acts as a tracer particle transported by a fluid flow. These existing algorithms generally produce sparse velocity vectors as the computations are based on local patterns of the BOS images. Moreover, these methods are not able to estimate the pressure from BOS data directly. A pressure reconstruction method, such as solving the Poisson equation, is required for pressure inference, which is used routinely in PIV (Wang et al. Reference Wang, Gao, Wang, Wei and Wang2016; Zhang, Bhattacharya & Vlachos Reference Zhang, Bhattacharya and Vlachos2020). In addition, reconstructing the three-dimensional (3-D) velocity field from tomographic BOS (Tomo-BOS) is still an open area in experimental fluid mechanics.
In this paper, we develop a new method for estimating the continuous velocity and pressure fields simultaneously from Tomo-BOS data. Here, the Tomo-BOS data that we are interested are the 3-D temperature fields at different time instants. Inspired by the development of deep learning methods (LeCun, Bengio & Hinton Reference LeCun, Bengio and Hinton2015), we exploit the expressivity of deep neural networks to address this problem. Recently, deep learning techniques have become increasingly popular in both computational and experimental fluid dynamics (Duraisamy, Iaccarino & Xiao Reference Duraisamy, Iaccarino and Xiao2019; Brunton, Noack & Koumoutsakos Reference Brunton, Noack and Koumoutsakos2020). For example, Raissi, Perdikaris & Karniadakis (Reference Raissi, Perdikaris and Karniadakis2019) proposed a framework of physics-informed neural networks (PINNs) to solve forward and inverse problems of nonlinear partial differential equations (PDEs); Han, Jentzen & Weinan (Reference Han, Jentzen and Weinan2018) and Sirignano & Spiliopoulos (Reference Sirignano and Spiliopoulos2018) also proposed to use deep learning methods to handle high-dimensional PDEs. These recent advances of scientific machine learning have also inspired innovation in fluid mechanics. The PINN framework (Raissi et al. Reference Raissi, Perdikaris and Karniadakis2019) has also been applied to perform complex flow simulations (Sun et al. Reference Sun, Gao, Pan and Wang2020; Jin et al. Reference Jin, Cai, Li and Karniadakis2021). On the other hand, data-driven algorithms have also been investigated for dealing with real experimental data (Rabault, Kolaas & Jensen Reference Rabault, Kolaas and Jensen2017; Cai et al. Reference Cai, Liang, Gao, Xu and Wei2019; Jin et al. Reference Jin, Laima, Chen and Li2020). For instance, a convolutional neural network (CNN) was applied to infer a dense velocity field from PIV images by Cai et al. (Reference Cai, Liang, Gao, Xu and Wei2019). Moreover, Raissi, Yazdani & Karniadakis (Reference Raissi, Yazdani and Karniadakis2020) proposed the ‘hidden fluid mechanics’ (HFM) method based on PINNs to integrate the Navier–Stokes equations with visualization data, which enables quantification of the velocity and pressure from 3-D concentration fields. HFM, which so far has been applied only to synthetic data, is similar to data assimilation; however, the solutions of the continuous flow fields are approximated by a neural network rather than solved by computational fluid dynamics methods.
Our work is inspired by Raissi et al. (Reference Raissi, Yazdani and Karniadakis2020) as we focus on the velocity and pressure inference of buoyancy-driven flows when the temperature is determined by Tomo-BOS imaging. We present a Tomo-BOS experiment to observe the flow that takes place over an espresso cup. A sequence of five Schlieren images from one of the cameras in the experiment is illustrated in figure 1. We propose to use a PINN, which is capable of seamlessly integrating the governing equations of the natural convection problem and the reconstructed 3-D temperature data. To our knowledge, this is the first time that the HFM paradigm has been applied to real experimental imaging data.
Illustration of a sequence of temperature-induced Schlieren images from one camera observing the flow developing over an espresso cup. A video of the Schlieren images is provided in the supplementary material.

The rest of this paper is organized as follows. We introduce the methodology combining the neural network and the physical model in § 2. The results of applying the PINN algorithm to Tomo-BOS imaging are presented in § 3, where we quantify the 3-D velocity and pressure of the flow over an espresso cup based on the imaged temperature field. We also conduct a companion PIV experiment to obtain the unstable velocity field at the centre plane for validation purposes. Finally, we present our conclusions in § 4. Note that in the supplementary material available at https://doi.org/10.1017/jfm.2021.135, we also evaluate the proposed method based on synthetic data (i.e. 2-D simulated flow) and investigate the performance of the method with respect to different parameter settings, including the hyper-parameters of the neural network, the data resolution and the signal-to-noise ratio.
2. Physics-informed neural networks (PINNs)
Physics-informed neural networks (PINNs), which are also called ‘hidden fluid mechanics’ (HFM), can infer latent quantities such as the velocity and pressure fields from auxiliary data, e.g. from smoke visualizations. In this work, we extend PINNs to deal with visualized temperature data of buoyancy-driven flow from Tomo-BOS imaging experiments. We employ the Boussinesq approximation of the incompressible Navier–Stokes (NS) equations and the corresponding heat transfer equation into PINNs.
Let  $T(\boldsymbol {x},t)$,
 $\boldsymbol {u}(\boldsymbol {x},t)$ and
 $p(\boldsymbol {x},t)$ denote the temperature, velocity vector and pressure, respectively, where
 $\boldsymbol {x}\in \mathbb {R}^2$ or
 $\mathbb {R}^3$ represents the spatial coordinate and
 $t$ is the temporal coordinate. The main idea of PINNs is to approximate the spatio-temporal solutions by using a fully-connected neural network (FNN). This can be represented as
 \begin{equation} (T, \boldsymbol{u}, p) = \mathcal{F}_{NN}(\boldsymbol{x},t, \varTheta), \end{equation}
where  $(\boldsymbol {x},t)$ and
 $(T, \boldsymbol {u}, p)$ denote the inputs and outputs of the neural network, respectively, and
 $\varTheta$ denotes the trainable parameters. For the fully-connected network,
 $\varTheta$ includes the weights and biases of multiple hidden layers. For the
 $k$-th hidden layer, the relationship between the output vector
 $Y^{k}$ and the input vector
 $X^{k}$ can be simply expressed as
 \begin{equation} Y^{k} = \sigma (\boldsymbol{W}^{k}X^{k}+b^{k}), \end{equation}
where  $\boldsymbol{W}^{k}$ and
 $b^{k}$ are the weights and biases, and
 $\sigma (\cdot )$ denotes the activation function, which is used to represent the nonlinearity of the solutions. We use the hyperbolic tangent function, namely
 $\sigma (\cdot )=\tanh (\cdot )$, throughout the paper unless otherwise stated. In this context, solving the nonlinear system of the governing equations is equivalent to learning the weights and biases of the network. However, this is an extremely ill-posed problem as we assume that only the temperature data
 $T$ is given without any boundary conditions on the velocity field. In order to infer the velocity and pressure fields, an additional network with the underlying physics is encoded into PINNs. Specifically, we aim to minimize the residuals of all the governing equations in the additional networks, which can be thought of as enforcing strong constraints for the feed-forward neural network outputs. For
 $\boldsymbol {x}\in \mathbb {R}^3$, the residuals are defined as follows:
 \begin{gather} e_{1} = T_{t} + uT_{x}+vT_{y}+wT_{z} - {1}/{{Pe}} (T_{xx}+T_{yy}+T_{zz}) , \end{gather}
 \begin{gather}e_{2} = u_{t} + uu_{x}+vu_{y}+wu_{z} + p_{x} - {1}/{{Re}}(u_{xx}+u_{yy}+u_{zz}) + {Ri}T\boldsymbol{e}_{\boldsymbol{x}} , \end{gather}
 \begin{gather}e_{3} = v_{t} + uv_{x}+vv_{y}+wv_{z} + p_{y} - {1}/{{Re}}(v_{xx}+v_{yy}+v_{zz}) + {Ri}T\boldsymbol{e}_{\boldsymbol{y}} , \end{gather}
 \begin{gather}e_{4} = w_{t} + uw_{x}+vw_{y}+ww_{z} + p_{z} - {1}/{{Re}}(w_{xx}+w_{yy}+w_{zz}) + {Ri}T\boldsymbol{e}_{\boldsymbol{z}} , \end{gather}
 \begin{gather}e_{5} = u_{x}+v_{y}+w_{z}, \end{gather}
where the subscripts represent the derivatives of the corresponding quantities, and  $(\boldsymbol {e}_{\boldsymbol {x}}, \boldsymbol {e}_{\boldsymbol {y}}, \boldsymbol {e}_{\boldsymbol {z}})$ are the components of the gravity unit
 $\boldsymbol {e}_{\boldsymbol {g}}$ in
 $(x,y,z)$ directions. Here, the residuals
 $e_{1}-e_{5}$ correspond to the dimensionless heat transfer equation and the Boussinesq approximation of incompressible NS equations. For the buoyancy-driven flow, it is assumed that the density variation consists of a fixed part and another part that has a linear dependence on temperature, where the latter leads to the gravity force term in (2.3b)–(2.3d). We also note that the pressure featured in the momentum equations must be considered as the pressure correction representing the deviation from hydrostatic equilibrium, which is not constant and not negligible when solving the equations. The non-dimensional parameters, including Reynolds number, Péclet number and Richardson number, are defined as follows:
 \begin{equation} {Re} = \frac{UL}{\nu}, \quad {Pe} = \frac{UL}{\alpha}, \quad {Ri} = \frac{g\beta(T_{hot}-T_{\infty})L}{U^2}, \end{equation}
where these physical properties will be specified in the experiment.
A schematic illustration of the proposed PINN, composed of a FNN with multiple hidden layers and a residual network with the physical constraints, is shown in figure 2. In order to compute the residuals  $e_{1}-e_{5}$, the derivatives of the state variables with respect to space and time are required, which is achieved by using automatic differentiation (AD) in the deep learning code (Baydin et al. Reference Baydin, Pearlmutter, Radul and Siskind2017). The AD relies on the chain rule of derivative computation and it is well-implemented in most deep learning frameworks such as TensorFlow and PyTorch; this allows us to avoid numerical discretization while computing derivatives of all orders in space-time. Once the FNN and the residuals have been formulated, the parameters
 $\varTheta$ of the PINNs are trained by minimizing the following loss function:
 \begin{equation} \mathop{\arg\min}_{\varTheta} \,L = \lambda L_{{data}} + L_{{res}}, \end{equation}
where  $\lambda$ is a weighting coefficient and
 \begin{equation} L_{{data}} = \sum_{n=1}^{N_T} |T(\boldsymbol{x}^{n},t^{n}) - T^{n}_{{data}} |^{2}, \quad L_{{res}} = \sum_{i} \sum_{n=1}^{N_{e}} |e_{i}(\boldsymbol{x}^{n},t^{n}) |^{2}. \end{equation}
Here,  $L_{{data}}$ represents the mismatch between the temperature data and the temperature predicted by the neural network,
 $L_{{res}}$ represents the residuals, and
 $N_{T}$ and
 $N_{e}$ are the numbers of training points corresponding to the two terms. Note that the value of
 $N_{T}$ depends on the grid points (e.g. pixel or voxel) of the observed data, while the value of
 $N_{e}$ can be very large since the spatio-temporal points for residual network can be randomly selected in the domain and the mini-batch technique can be employed. The weighting coefficient
 $\lambda$ is applied to adjust the contributions of two terms in the loss function, and we choose
 $\lambda =100$ for the Tomo-BOS experiment in this paper. We note that a large weight of the data term
 $L_{{data}}$ can accelerate the convergence of training, but it may weaken the constraint of the governing equations and result in overfitting. The sensitivity of the hyperparameters in PINNs is quantitatively analysed on a synthetic dataset and is presented in supplementary material. By default, the parameters of the neural networks
 $\varTheta$ are initialized using the Xavier scheme and then optimized until convergence via an adaptive optimization algorithm Adam (Kingma & Ba Reference Kingma and Ba2014). When the minimizer of the loss function (2.5) is obtained after training, the velocity and pressure fields can be inferred simultaneously with the trained parameters by feeding the spatio-temporal coordinates to the neural network. The proposed method is summarized in the algorithm , where we would like to emphasize that the only information used in the neural network is the temperature data along with the formulation of the governing equations.
Remark 2.1 The PINN algorithm, which can be considered as a novel data assimilation method, estimates the velocity and pressure fields by regressing the visualization data in a spatio-temporal domain. It is known that the efficiency of conventional data assimilation strategies is sensitive to the choice of initial guess of the initial and boundary conditions of velocity and pressure, which are the control variables of these methods to be optimized. However, we should note that the trainable variables of the proposed PINN algorithm are the neural network parameters (which need to be initialized as well), which are totally different from those of conventional methods. Therefore, it is not necessary to provide the initial and boundary conditions of either velocity or pressure.
Schematic diagram of the physics-informed neural network for 3-D velocity and pressure estimation. The neural network is composed of a fully-connected network and a residual network. The fully-connected network is used to represent the solutions of the velocity, pressure and temperature fields, while the residual network is considered as the physical constraints (i.e. the incompressible NS equations and the heat equation) for the solutions. The parameters of the network are learned by minimizing a loss function including a data term and the residuals of the equations.

Algorithm for the PINNs for velocity and pressure inference from temperature data.

3. Inference of Tomo-BOS experiment
3.1. Experimental set-up of Tomo-BOS
The experimental set-up that was used for acquiring BOS images is illustrated in figure 3(a). Six cameras (LaVision M-lite 5M,  $2056\times 2464$ pixel) equipped with 35-mm lenses (f/16) were aligned around an espresso cup equally spaced covering a total angle of
 $150^{\circ }$ at a distance of 700 mm from the centre of the cup. The projected pixel resolution was
 $60\ {\mathrm {\mu }}\textrm {m}\ \textrm {pixel}^{-1}$. Six aluminum sandwich panels (
 $300\ \textrm {mm}\times 420\ \textrm {mm}$) with imprinted random dot-patterns were placed in the background at a distance of 500 mm from the centre of the cup. Four pulsed LEDs (LaVision High Energy LED Spotlight) were used in combination with an exposure time of
 $500\ {\mathrm {\mu }}\textrm {s}$ at a recording rate of 50 Hz to acquire 400 images.
Tomo-BOS experiment: (a) Experimental setup for Tomographic BOS measurements around an espresso cup. The espresso cup is shown as an image from one of the cameras with the Schlieren image after processing superimposed. (b) Zoomed section of a raw image showing the dots (grey) and subsets (red), where each dot occupies roughly 5 pixels and each subset contains about 25–30 dots.

The temperature in the laboratory was  $20\,^{\circ }\textrm {C}$. When the espresso cup was filled with boiling water, a thermocouple was used to measure the temperature of the water (2 cm into the water at the centre of the cup) and the gas temperature (5 mm above the liquid surface at the centre of espresso cup), which were approximately
 $80\,^{\circ }\textrm {C}$ and
 $50\,^{\circ }\textrm {C}$, respectively. The estimated uncertainty of these quantities is approximately
 ${\pm }3\,^{\circ }\textrm {C}$. The thermocouple measurements happened about 20 s before the Tomo-BOS data acquisition, while the whole experiment (including the thermocouple measurements and BOS image recording) was performed within one minute.
The image data were acquired and processed using LaVision's Tomographic BOS software (DaVis 10.1.1). As shown in the zoomed image in figure 3(b), each of the subsets contains about 25–30 dots in a window with  $31\times 31\ \textrm {pixel}^2$, where each dot occupies roughly 5 pixels. In order to determine the 2-D displacement fields, a subset-based zero-mean normalized sum of squared difference (ZNSSD) algorithm with first order shape functions (Pan Reference Pan2018) was employed, resulting in a spatial resolution of
 $600\ {\mathrm {\mu }}\textrm {m}\ \textrm {pixel}^{-1}$. Outliers were not observed in the displacement fields and therefore we did not apply any post-processing filters.
An example of the resulting Schlieren images is shown in figure 1, which demonstrates the temperature-induced Schlieren visualized as a colour map of the 2-D displacement field in pixel from one camera. In order to reconstruct the 3-D field, a calibration procedure was performed, where a spatial calibration plate was additionally recorded at different locations and at different rotation angles. Eventually, the 2-D displacement fields from all six cameras were subjected to the tomographic reconstruction algorithm proposed by Nicolas et al. (Reference Nicolas, Todoroff, Plyer, Le Besnerais, Donjat, Micheli, Champagnat, Cornic and Le Sant2016), which yielded a unique and well-behaved solution with the aids of the Tikhonov smoothness regularization and the 3-D mask. The resolved volume of the 3-D data is approximately  $[-64,62]\times [-90, 85]\times [-75,52]\ \textrm {mm}^3$ (
 $\textrm {width}\times \textrm {height}\times \textrm {depth}$). A 3-D refractive index field was obtained, having 0.9 Mvoxel on a Cartesian grid with a grid spacing of 1.5 mm. The temperature at each voxel was then calculated by neglecting pressure variation and using
 $T=T_0 \rho _0 G/(n-1)$, where
 $G$ is the Gladstone–Dale constant of air (
 $G=0.2268\ \textrm {cm}^3\ \textrm {g}^{-1}$),
 $T_0$ and
 $\rho _0$ are ambient temperature and density (
 $T_0=293.15$ K and
 $\rho _0=1.204\ \textrm {kg}\ \textrm {m}^{-3}$), respectively. We note that multiple tests were performed with the Tomo-BOS experiment. While the transient components of the flow were different between different tests (as the flow is unstable), the core features (e.g. temperature values) remained the same. In the following, the PINN method proposed in § 2 is applied to infer the temporal evolution of 3-D velocity and pressure from the temperature data of one of the Tomo-BOS experiments. For clarity, these experimental results are denoted by Tomo-BOS/PINN hereafter.
3.2. Inference results
3.2.1. Results of Tomo-BOS/PINN
We first assume that the governing equations of the problem include the Boussinesq approximation of NS equations and the heat equation, as shown in (2.3e), where the physical properties appearing in (2.4a–c) are the thermal diffusivity  $\alpha = 2.074 \times 10^{-5}\ \mbox {m}^{2}\ \mbox {s}^{-1}$, the coefficient of thermal expansion
 $\beta = 3.4 \times 10^{-3}\ \mbox {1}\ \textrm {K}^{-1}$, the kinematic viscosity of the flow
 $\nu = 1.516 \times 10^{-5}\ \textrm {m}^{2}\ \textrm {s}^{-1}$ and the gravity acceleration
 $g = 9.8\ \textrm {m}\ \textrm {s}^{-2}$. In this experiment, we define the characteristic length (which approximates the diameter of the espresso cup) and the characteristic velocity (which is an arbitrary velocity magnitude) as
 $L = 0.065\ \mbox {m}$,
 $U = 0.1\ \textrm {m}\ \textrm {s}^{-1}$. The environmental temperature is a constant
 $T_{\infty }=293.15$ K, while determining the reference hot temperature
 $T_{hot}$ is not straightforward due to the unstable and non-uniform distribution of the surface temperature above the espresso cup, as illustrated in figure 4. Herein, we use the time-averaged value of the maximum surface temperatures from all snapshots, namely
 \begin{equation} T_{hot}=1/400\sum_{k=1}^{400}\max(T^{k}), \end{equation}
which is  $T_{hot} = 338.2$ K. Then, the non-dimensional parameters, namely the Reynolds number, Péclet number and Richardson number, can be computed:
 ${Re} \approx 430$,
 ${Pe} \approx 313$,
 ${Ri} \approx 9.9$. In the PINN algorithm, we use a neural network with 10 hidden layers and 150 neurons per layer. The weighting coefficient in the loss function is 100. We train the neural network with 120 epochs until the loss reaches a plateau, which takes about 10 h on a single GPU (for processing 400 snapshots in 3-D).
Tomo-BOS/PINN results: 2-D temperature profiles of Tomo-BOS data on the surface of the espresso cup ( $y=-31$ mm) at various time steps. (Unit: K).

In a real experiment, we cannot directly compute the errors of the reconstructed velocity and pressure fields since the ground-truth fields are not available. Therefore, we first examine the regression error of the temperature data, which is an indicator of the convergence of the neural network. The iso-surfaces of the 3-D temperature fields at  $t= 2.0$ s are illustrated in figure 5. The Tomo-BOS data is shown in figure 5(a), while the difference between the data and the temperature regressed by the PINN is shown in figure 5(b). From the plots we can observe that the temperature field regressed by the PINN is almost identical with the Tomo-BOS data, as the absolute error of temperature over the whole spatial domain is less than
 $1\,^{\circ }\textrm {C}$; the corresponding relative
 $L_2$-norm error (defined by
 $\epsilon _{T}= \parallel \hat {T}_{PINN} - T_{BOS} \parallel _{2} / \parallel T_{BOS}\parallel _{2}$) is less than 1 %.
Tomo-BOS/PINN results: (a) iso-surfaces of temperature field (corresponding to values of 300, 310, 315 and 325 K) at  $t=2.0$ s extracted from Tomo-BOS data, (b) iso-surfaces of the difference between Tomo-BOS data and the temperature regressed by the PINN, namely
 $|\hat {T}_{PINN} - T_{BOS}|$. The
 $L_2$ error of temperature for the PINN is less than 1 %.

The iso-surfaces of the inferred 3-D velocity field at  $t=2.0$ s are presented in figure 6(a), corresponding to velocity magnitudes of 0.1, 0.15, 0.25 and
 $0.35\ \textrm {m}\ \textrm {s}^{-1}$. It can be seen that the velocity contours present an inverted cone shape, and the flow speed above the espresso cup increases with height. Moreover, the contours of the 3-D pressure field at
 $t=2.0$ s are illustrated in figure 6(b). As mentioned in § 2, the pressure inferred by the PINN is the one featured in the momentum equations, which should be considered as the deviation from hydrostatic equilibrium. As shown, the lowest pressure can be observed on the surface of the espresso cup, where the temperature is high and the air flow speed is nearly zero. Then, the pressure increases suddenly above the surface and decreases slightly toward the environment. Furthermore, the 2-D velocity vectors (at
 $z=-21$ mm and
 $t=2.0$ s) and the corresponding 1-D velocity profiles along various lines are presented in figure 6(c,d), from which we can see that the air flow gathers at the surface centre of the espresso cup and then flows upward with increasing speed. A similar phenomenon can be observed in our 2-D simulation data in the supplementary material. Note that the velocity field is varying both spatially and temporally. The maximum velocity (
 $v$-component) is approximately
 $0.4\ \textrm {m}\ \textrm {s}^{-1}$, while the mean value over the whole space-time domain is about
 $0.063\ \textrm {m}\ \textrm {s}^{-1}$. To further examine the velocity and pressure inferred by the PINN, we also evaluate the residuals of the governing equations, given in (2.3e). The residuals of the momentum equations are illustrated in figure 7. The values above the surface of the espresso cup are relatively higher than those away from the surface. However, the residuals are overall very small, and the average over the spatial domain is in the order of
 $10^{-4}\ \textrm {m}\ \textrm {s}^{-2}$, indicating that the velocity and pressure fields from Tomo-BOS/PINN satisfy the governing equations.
Tomo-BOS/PINN results: (a) 3-D contours of velocity magnitude, (b) 3-D contours of pressure field, (c) 2-D velocity vectors at a vertical plane  $z=-21$ mm, (d) velocity profiles along three horizontal lines and three vertical lines, which are shown in (c). The results demonstrated here are extracted at time instant
 $t=2.0\ {\rm s}$. The centre of the coffee cup is approximately located at
 $x=-3.3$ and
 $z=-21$ mm.


3.2.2. An independent PIV experiment for validation
After obtaining the inferred velocity field, we also compare it with the diaplacement determined from Schlieren-tracking. As shown in figure 1, we track distinct Schlieren-features in sequential images, where the bottom of the structure moves from the second to the fifth frame by approximately 25 mm in the  $y$-direction, corresponding to a velocity magnitude of
 $0.08\ \textrm {m}\ \textrm {s}^{-1}$. This is much smaller than the inferred velocity from the Tomo-BOS/PINN analysis. Therefore, we set up a PIV experiment to further examine the correctness of the PINN inference, especially the correctness of the maximal velocity.
In PIV experiment, the espresso cup was placed within a glass box ( $25\ \textrm {cm}\times 25\ \textrm {cm}\times 40\ \textrm {cm}$) with an open top in order to provide a calm bath of air seeded with DEHS particles around the espresso cup. Since the PIV experiment was performed independently to the Tomo-BOS experiment after a few months, the room temperature was
 $25\,^{\circ }\textrm {C}$ instead of
 $20\,^{\circ }\textrm {C}$. A dual-head Nd:YAG laser (Litron NANO L 50-50, 532 nm) was used to generate a laser sheet of 10 cm in height with an average thickness of approximately 1 mm. A camera (LaVision Imager SX 6M,
 $2752\times 2200$ pixels) equipped with a 50-mm lens acquired 400 double-frame images at 13 Hz with a
 $\textrm {d}t=1.5$ ms. The projected pixel resolution was
 $53\ {\mathrm {\mu }} \textrm {m}\ \textrm {pixel}^{-1}$, resulting in a field of view of
 $13\ \textrm {cm}\times 10 \ \textrm {cm}$. Data was processed using an interrogation window size of
 $48\times 48$ pixels with 75 % overlap, which resulted in
 $234\times 189$ velocity vectors with a spacing of
 $640\ {\mathrm {\mu }}\textrm {m}$.
The velocity vectors in a 2-D plane of the PIV and Tomo-BOS/PINN experiments are illustrated in figure 8, where three typical time instants of each experiment are shown. Overall, we can observe similar flow patterns from the two experiments, and the velocity magnitudes are consistent with each other. The main difference between the PIV and the Tomo-BOS results is that there exist more variations right over the espresso cup in the PIV case. In particular, there is a recirculation zone at  $t_{0}$ in the PIV plots, which is not clear in the Tomo-BOS/PINN results. Moreover, there are some external disturbances from the right side in the PIV experiment, which can be seen at
 $t_{2}$ in figure 8. As mentioned, the PIV and BOS experiments were performed independently, and therefore a lining up between the PIV and Tomo-BOS/PINN results is not necessary. The comparison between the two experiments is meant to qualitatively validate the velocity by some reference frames; thus the movements of the entire flow structure over the espresso cup are not relevant. The velocity profiles along a horizontal line at centre plane at various time instances are also illustrated in figure 9, in which we can observe the similarity in magnitudes and maximum velocities for all three profiles, and the similarity in width of the profiles between the two experiments. The results also show that the instability of the flow does not affect the velocity magnitude in any of the experiments. In summary, the PIV experiment validates the Tomo-BOS/PINN in terms of the velocity range. Moreover, based on the results of Tomo-BOS/PINN and PIV, we can also conclude that tracking of the randomly visible Schlieren structures in 2-D images (shown in figure 1) cannot reliably determine flow velocities at specific locations due to its line-of-sight nature and consequently the unknown location of the Schlieren structure.
Tomo-BOS/PINN and planar PIV results: 2-D velocity vectors at various time instants. The 2-D velocities at centre plane  $Z=-21$ mm are demonstrated for Tomo-BOS/PINN. The colormap represents the velocity magnitude of the vectors (unit:
 $\textrm {m}\ \textrm {s}^{-1}$). The results of Tomo-BOS/PINN shown here are at the instants
 $t=2.0$,
 $t=4.0$,
 $t=6.0$ s, while those of PIV are
 $t=1.0$,
 $t=7.0$,
 $t=16.0$ s. Movies that demonstrate the time-dependent velocity fields are given in the supplementary material.

Tomo-BOS/PINN and planar PIV results: velocity profiles along a horizontal line at various time instances. The profiles of Tomo-BOS/PINN results (b) are extracted from the centre plane  $Z=-21$ mm.

3.3. Ability to deal with sparse data
In § 3.2, the PINN is applied to analyse the whole Tomo-BOS dataset, which contains 400 snapshots with a recording rate of 50 Hz. Here, we investigate the capability of PINNs in estimating high-resolution fields from sparse temperature data.
We first perform temporal downsampling by extracting the temperature from the Tomo-BOS data with different time intervals, from which we infer the velocity and pressures fields. As shown in figure 10, the velocity fields and profiles from the different datasets are consistent, indicating that the proposed algorithm is not sensitive to data sparsity. We note  $\Delta t=0.2\ \textrm {s}$ means that a maximum displacement between two consecutive snapshots is about 0.08 m, which is larger than the characteristic length
 $L = 0.065$ m. Moreover, as we leave out some temperature frames during training, we can use them for validation. Specifically, if the training data is sampled with
 $\Delta t=0.1\ \textrm {s}$, we can compute the temperature error for those intermediate frames, as demonstrated in figure 11, which shows the 2-D temperature, pressure and velocity fields at
 $t=2.96$ s. Although this snapshot is not used in training (unseen data for PINN), the relative
 $L_2$-norm error of 3-D temperature for this testing frame is only 0.362 %.
Tomo-BOS/PINN result with temporal downsampling data: velocity fields at  $t=2.0$ s inferred by PINN for various temporal resolutions. (a) 2-D velocity vectors; (b) velocity profiles of the
 $v$-component along the centreline.
 $\Delta t$ denotes the time interval between two consecutive snapshots used for the PINN algorithm.

Tomo-BOS/PINN result with temporal downsampling data: BOS temperature, absolute error of temperature, inferred pressure at  $z=-21$ mm and
 $t=2.96$ s. The training data is sampled with time interval
 $t=0.1$ s. Although this snapshot is not used in training (unseen data for PINN), the relative
 $L_2$-norm error of temperature for this snapshot is 0.362 %.

Furthermore, we can also downsample the temperature data in space, as illustrated in figure 12. In particular, the temperature data is downsampled along each direction with a grid resolution of 3.0 mm, while that of the original Tomo-BOS data is 1.5 mm. By doing so, the training data at each frame only contains 1/8 of the Tomo-BOS data. We find from figure 12 that the PINN is able to infer the full temperature and velocity fields with good consistency. The relative  $L_2$-norm errors of temperature for the frame is 0.430 %. The assessments in this section indicate that the PINN algorithm allows us to reconstruct continuous and high-resolution velocity and pressure fields from relatively sparse data (temporally and spatially) due to the introduction of the governing equations. In addition, one can take advantage of downsampling, which can help to improve the efficiency of the training process without reducing the accuracy significantly. A systematic study to quantify the accuracy of PINNs against data resolution is performed on the 2-D simulated case, which can be found in the supplementary material.
Tomo-BOS/PINN result with spatial downsampling data: (a–c) downsampled temperature data used for PINN, temperature regressed by PINN and velocity vectors inferred by PINN at  $z=-21$ mm and
 $t=2.96$ s. The training data is downsampled along each direction, which results in a grid resolution of 3.0 mm, while that of the reconstructed fields is 1.5 mm. Although the data for PINN at each snapshot only contains 1/8 of the Tomo-BOS data, the relative
 $L_2$-norm errors of temperature for this snapshot is 0.430 %.

3.4. Discussion of the physical properties
The non-dimensional parameters defined in (2.4a–c) are  ${Re} = 430$,
 ${Pe} = 313$,
 ${Ri} = 9.9$, which are derived from the physical properties given in § 3.2.1. As the underlying physical laws are encoded in the neural network, the estimation result is generally influenced by these non-dimensional parameters. In this section, we investigate the sensitivity of Tomo-BOS/PINN to the values of Re and Ri (
 ${Pe}=0.73{Re}$). We note that these parameters, which are sensitive to the physical properties (e.g. viscosity, conductivity) as well as the reference temperatures, can be affected by one or more factors. Instead of tuning these factors one by one, we select the non-dimensional parameters from an appropriate range to cover different conditions. Specifically, we consider the Reynolds number
 ${Re}=\{100, 430\}$ and the Richardson number
 ${Ri}=\{1.0,2.5,7.5,9.9\}$. The pressure fields of different combinations are shown in figure 13. Increasing Ri, the pressure over the espresso cup also increases, with the highest pressure generally located over the cup but not right on the surface. In addition, larger Ri leads to larger velocity magnitude, which can be observed in figure 14(a). Somewhat different is the case with
 ${Re} = 100$ and
 ${Ri} = 1$, where we find an inverse pattern of the pressure field, as shown in figure 14(b), which shows the pressure profiles along the centre line for various parameters. Note that the velocity and pressure fields are inferred by integrateing the temperature data and the governing equations, where the temperature data used for different non-dimensional configurations are the same. We conclude that the inference results of PINN are relatively sensitive to the parameters used in the encoded governing equations, especially to the Richardson number for the investigated buoyancy-driven flow. For future development of the proposed method, a Bayesian framework of PINN (Yang, Meng & Karniadakis Reference Yang, Meng and Karniadakis2021) can be considered to address the issue caused by model uncertainty.
Sensitivity of physical properties used in PINN: 2-D pressure fields ( $p-\bar {p}$) inferred by using various parameters at
 $z=-21$ mm and at
 $t=2.0$ s.

Sensitivity of physical properties used in PINN: (a) velocity profiles ( $v$-component) along a horizontal line with various Richardson numbers, (b) pressure profiles (
 $p-p_{c}$) along the centre line with various parameters. The profiles are extracted from the plane
 $z=-21$ mm and time instance
 $t=2.0$ s. Note that the training data for the different conditions are the same.

4. Concluding remarks
In this paper, we propose a machine learning algorithm based on PINNs for estimating velocity and pressure fields from temperature data of Tomo-BOS experiments. The advantages of the PINN algorithm are summarized as follows. (a) The PINNs are capable of integrating the governing equations and the temperature data, which is similar to the variational data assimilation methods, while it is not necessary to solve the governing equations by using any CFD solvers. (b) The PINNs can infer the velocity and pressure simultaneously by regressing the data, without any information on initial or boundary conditions. (c) The PINNs can provide continuous solutions of the velocity and pressure, even if the experimental data are sparse and limited.
We first evaluate the proposed method by using a 2-D synthetic simulation of buoyancy-driven flow, which can be found in the supplementary material, where the temperature is generated by the CFD solver directly. The performance of PINNs against various parameter settings (including the size of neural network, the weighting coefficient in the loss function, the spatial and temporal resolutions and the data noise level) is investigated systematically. This parametric study, which helps us understand how to use the algorithm effectively, reveals that the method can provide accurate and reliable performance on extracting flow fields from temperature against sparse data. Moreover, the proposed PINN algorithm can also handle noisy data to some extent. It is also possible to extend the proposed method to a Bayesian-PINN framework (Yang et al. Reference Yang, Meng and Karniadakis2021), which can simultaneously address high noise levels and quantify the uncertainty of the inference result.
We then present a Tomo-BOS experiment to observe the flow over an espresso cup. The 3-D velocity and pressure fields are successfully inferred from the reconstructed 3-D temperature data, and are qualitatively validated by a comparison with the velocity obtained from PIV measurements. Compared to PIV, the BOS technology is capable of straightforwardly providing enormous quantities of data on the investigated fluid flows, and has become increasingly popular due to its simplicity. Here, we demonstrate that either planar or tomographic BOS data is simply available to the PINN algorithm for velocity and pressure quantification, which is novel and can open a door to BOS velocimetry for complex fluid flows. Furthermore, the flexibility of the proposed method – PINNs – allows us to extend the algorithm to different types of flows (in addition to the natural convection investigated in this paper) by simply encoding the appropriate governing equations of the fluid flows. Taken together, the results in this paper indicate that the proposed method is accurate and flexible in dealing with data of various fluid mechanics problems, and can thus become a promising direction in experimental fluid mechanics.
Supplementary material and movies
Supplementary material and movies are available at https://doi.org/10.1017/jfm.2021.135.
Funding
The authors S.C., Z.W. and G.E.K. acknowledge the support from the PhILMS grant under the grant number DE-SC0019453.
Declaration of interests
The authors report no conflict of interest.



