I. INTRODUCTION
Nowadays, with the rapid development of wireless communication and satellite systems, low dielectric loss materials with a high dielectric constant (εr) and a nearly zero temperature coefficient of resonant frequency (τf) have been more required for the production of passive microwave components such as dielectric resonator, dielectric filter, and dielectric waveguides. Reference Sebastian1–Reference Tamura, Konoike, Sakabe and Wakino3 Until now, some dielectric materials, such as (Zr,Sn)TiO4 (ZST), Ba(Zn1/3Nb2/3)O3 (BZN), and Ba(Zn1/3Ta2/3)O3 (BZT) with excellent microwave dielectric properties, have been used in manufacturing dielectric resonators for the wireless communication system. Reference Sebastian1–Reference Kawashima, Nishida, Ueda and Ouchi7 Newly, the lithium-based spinel structure ceramics have impressed scientists because of the promising dielectric properties to fabricate passive microwave components. Reference Kawai, Tabuchi, Nagata, Tukamoto and West8,Reference Taghipour Armaki, Taheri-Nassaj and Bari9 George and Sebastian Reference George and Sebastian10,Reference George and Sebastian11 reported that Li2ZnTi3O8 (LZT) cubic spinel ceramics sintered at 1075 °C for 4 h exhibited good microwave dielectric properties of εr = 25.6, Q × f = 72,000 GHz, and τf = −11.2 ppm/°C.
The LZT structure is a cubic spinel in which the octahedral sites are ordered into two sets with full occupancy by Ti4+ (12d) and Li1+ (4b), respectively, and the tetrahedral sites are occupied by a disordered mixture of Li1+ and Zn2+(8c). Reference Hernandez and Torres Martinez12 Furthermore, the ordering of Li1+ and Ti4+in the octahedral sites with the 1:3 ratio is completed, as represented by the formula (Li0.5Zn0.5)tet[Ti1.5Li0.5]octO4. Reference Hernandez and Torres Martinez12
In addition, the benefits of the LZT ceramic are its dielectric properties, cost efficiency, and low preparation temperature compared to the mentioned compounds. Meanwhile, it could be a good candidate for the production of passive microwave components if its dielectric loss decreased. Reference Taghipour Armaki, Taheri-Nassaj and Bari9 Since the properties of LZT ceramics depend on the ordering and occupancy of cations in tetrahedral (8c) and octahedral (4b and 12d) sites, the ordering of Zn2+ and Li1+ cations in the tetrahedral site (8c) plays a key role to minimize the dielectric loss of the LZT ceramic. On the other hand, both intrinsic and extrinsic factors contribute to dielectric loss. Reference Kume, Yasuoka, Omura and Watari13–Reference Santhosh Kumar, Goswami and Pamu17 The intrinsic loss is mostly due to anharmonic forces that mediate the interaction between crystal lattice and phonons. In contrast, the extrinsic loss is associated with imperfections in the crystal structure such as grain boundary, impurities, lattice defects, dislocations, and residual stresses in polycrystalline. Nevertheless, the extrinsic loss can be minimized by achieving maximum density, larger grain size, and ordered structure. Reference Kume, Yasuoka, Omura and Watari13,Reference Kume, Yasuoka, Omura and Watari14,Reference Kim and Kim18,Reference Bieringer, Moussa, Noailles, Burrows and Kiely19 A careful literature survey on the titanate-based ceramics reveals that the extrinsic losses of titanate-based ceramics can be reduced by systematic annealing of the samples. Several researchers have distinguished that the high quality factor value results from minimization of dielectric loss due to cation ordering and reducing the imperfections in the crystal structure, which can be achieved with annealing-treatment. Reference Kim and Kim18–Reference Lee, Lin, Huang, Su and Hu21 Kawashima et al. Reference Kawashima, Nishida, Ueda and Ouchi7 reported that the Q × f value of Ba(Zn1/3Ta2/3)O3 ceramics improved with increase in cation ordering but with at least 120 h of annealing to achieve a perfect hexagonal ordered structure. Then, Tamura et al. Reference Tamura, Konoike, Sakabe and Wakino3 described that minor addition of BaZrO3 dramatically reduced the annealing time required to reach a high quality factor state, obtained a high quality factor value without observation of a hexagonally ordered structure in BZT–BaZrO3 system. Additionally, Kume et al. Reference Kume, Yasuoka, Omura and Watari13,Reference Kume, Yasuoka, Omura and Watari14 reported the annealing effect on dielectric loss and microstructure of AlN ceramics. In this study, the dielectric loss of AlN ceramics annealed at 720, 970, and 1210 °C for 2 and 4 h shows very low loss between 2.6 and 6.0 × 10⁻⁴ at 28 GHz. Furthermore, Houivet et al. Reference Houivet, Lamagnere, El Fallah and Haussonne22 reported the annealing effects on microwave properties of ZST ceramics, where annealing at temperatures of 1275 and 1250 °C induces a 25% improvement of Q × f values. Hence, the annealing-treatment is one of the most important processes to go down extrinsic and intrinsic losses to enhance the quality factor of dielectric materials and use for passive microwave components. Noting that the effects of annealing time on structural and microwave dielectric characteristics were not yet understood in LZT ceramics. In the current study, the effects of annealing time on structural, microstructure, and microwave dielectric characteristics, especially quality factor, are investigated for LZT ceramics with different time durations from 4–20 h. The Raman spectroscopy is also used to explore cation ordering and occupancy, and dielectric properties through lattice vibrations.
II. EXPERIMENTAL PROCEDURE
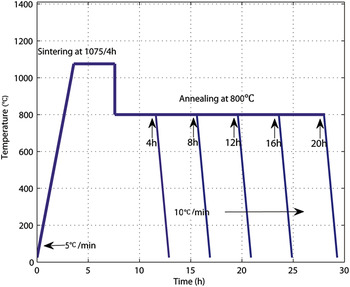
In this work, the LZT ceramic was synthesized by the conventional solid-state route with starting materials of high purity (99.9+%) oxide powders: Li2CO3, ZnO, and TiO2 (Merck Chemical Company Inc, Darmstadt, Germany). Stoichiometric amounts of the powdered samples were mixed by ball milling for 6 h using a planetary mill and zirconia balls in ethanol medium. The slurry was dried and calcined in an alumina crucible at 900 °C for 4 h. The calcined powders were then milled again for 6 h and polyvinyl alcohol (5 wt%) solution was then added to the powder and mixed. It was dried and ground well then pressed into cylindrical disks of about 10 mm diameter and 5 mm thickness by applying a pressure of about 100 MPa. These samples were muffled by a powder of the same composition and sintered at 1075 °C for 4 h. The muffling was performed to prevent the escape of volatile lithium at sintering temperatures. Then, the sintered samples were annealed at 800 °C in a time variation from 4 to 20 h with the heating and cooling rates of 5 and 10 °C/min, respectively. The heat-treatment profiles of LZT ceramic are shown in Fig. 1. The bulk densities of the LZT ceramics were measured by the Archimedes method. Also the crystal structures of the sintered and annealed samples were identified by x-ray diffraction (XRD) (X-pert Philips, Amsterdam, Netherlands). The XRD data for Rietveld refinement were collected over the range of 2θ = 10° − 90°, with a step size of 0.04° and a count time of 2 s. The Rietveld refinement was performed using the PANalytical X' pert HighScore Plus program to obtain the lattice parameter and long-range order parameter (S). The micrographs of sintered and annealed samples were studied using the scanning electron microscope (SEM, Philips XLX, Amsterdam, Netherlands). The Raman spectra were measured with a Dilor XY Raman spectrometer with a detection time of 10 s. The dielectric constant and the quality factor values at microwave frequencies (8–10 GHz) were measured by the Hakki–Coleman dielectric resonance method using a network analyzer (HP 8510). Reference Sebastian1 Temperature coefficient of resonant frequency was also measured by the same method with a changing temperature from 25 to 75 °C according to the following equation:
 $${\tau _{\rm{f}}} = {{{f_{75}} - {f_{25}}} \over {{f_{25}} \times 50}}\;{\rm{ppm}}\,^\circ {{\rm{C}}^{ - 1}}\quad .$$
Heat-treatment profiles of LZT ceramics.

III. RESULTS AND DISCUSSIONS
A. Structure characteristics
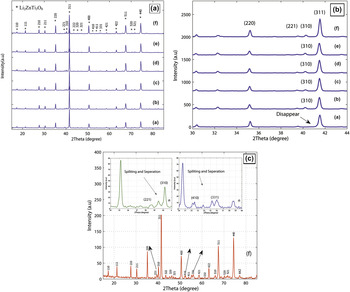
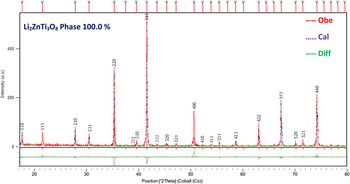
XRD patterns for the sintered and annealed LZT samples under various conditions are shown in Fig. 2(a). All reflections are indexed based on the JCPDS file number 86-1512 for LZT ceramic with cubic close-packed crystal symmetry belonging to P4332 space group. The LZT observed to crystallize in a cubic spinel without any secondary phase. As shown in Fig. 2(b), however, the (310) superlattice reflection does not appear in the LZT-sintered sample because of the short range of ordering, which is beyond the detectable limit of XRD analysis. But after annealing-treatment, the superlattice reflection of (310) was observed, and this amount went up with increase in annealing time θ. In addition, for times more than 8 h, there is a clear splitting of the (310), (410), and (331) superlattice reflections; the separation is particularly obvious for the sample annealed for 20 h, as exhibited in Fig. 2(c). These results indicated that the ordering of LZT crystal structure was enhanced via annealing-treatment at high time holding. Since the LZT tetrahedral sites (8c) are occupied by a disordered mixture of Li1+ and Zn2+, the observed results could be attributed to a significant increase in cation ordering on tetrahedral site. Reference Kawai, Tabuchi, Nagata, Tukamoto and West8,Reference Hernandez and Torres Martinez12,Reference Lee, Lin, Huang, Su and Hu21 Kawashima et al. Reference Kawashima, Nishida, Ueda and Ouchi7 described that with increase in annealing period, there was distinct splitting of the (226) and (422) peaks of Ba(Zn1/3Ta2/3)O3 ceramics, reflecting the development of B-site ordering (Zr, Ta); this was accompanied by an increase in the Q × f values. The intensity of the (310) superlattice reflections and (311) fundamental reflection was measured by using profile fitting software (X-pert high score plus Philips, Netherlands). Also, the theoretical value of the ratio of the integral intensity of superlattice reflection to the strongest reflection is calculated through the Rietveld refinement technique, by placing all the atoms in approximate ideal positions in the ordered cubic lattice. The Rietveld refined plot of the LZT sample annealed for 20 h is shown in Fig. 3. Nevertheless, the formation of ordered structure was evaluated by a long-range order parameter (S) that calculated by comparing the intensities of the (310) superlattice reflection (2θ = 39.5°) with the strongest reflection (311) from the XRD pattern, as given below. Reference Kim and Kim18,Reference Lee, Lin, Huang, Su and Hu21
 $$S = \sqrt {{{{{\left( {{{{I_{310}}} \mathord{\left/ {\vphantom {{{I_{310}}} {{I_{311}}}}} \right. \kern-\nulldelimiterspace} {{I_{311}}}}} \right)}_{{\rm{obs}}}}} \over {{{\left( {{{{I_{310}}} \mathord{\left/ {\vphantom {{{I_{310}}} {{I_{311}}}}} \right. \kern-\nulldelimiterspace} {{I_{311}}}}} \right)}_{{\rm{cal}}}}}}\quad ,}$$
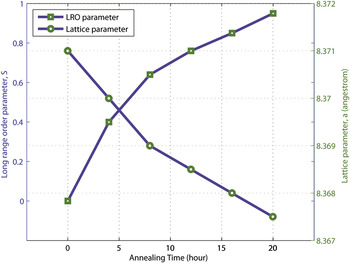
where (I 310/I 311)obs and (I 310/I 311)cal are the ratio of the observed intensity of (310) superstructure reflection to that of (311) reflection peaks and the corresponding ratio is calculated for a fully ordered structure using published structural data, respectively. Reference Hernandez and Torres Martinez12 The long-range order parameter (S) and lattice parameter (a 0) variations of the LZT samples as a function of annealing time are illustrated in Fig. 4. The long-range order parameter of sample annealed at 800 °C for 4 h was 0.40. However, it went up by increasing the annealing time to a maximum value of 0.95 for the sample with high holding time. These variations could be ascribed by the Li1+ and Zn2+ cation ordering in the tetrahedral (8c) site. By contrast, the lattice parameter is reduced with increase in holding time, as shown in Fig. 4. The lattice parameter value of the LZT-sintered sample at 1075 °C/4 h was about 8.371 Å, but it dropped down to 8.3675 Å for the sample that annealed at 800 °C for 20 h. It could be due to the reduction of vacancies at regular cationic sites. Note that the point defects such as cation vacancy at octahedral and tetrahedral sites play an important role in variations of the lattice parameter of the LZT ceramics. In general, point defects, dislocations, and residual stresses in crystal structure can be decreased by annealing-treatment. Reference George and Sebastian10,Reference Kume, Yasuoka, Omura and Watari13,Reference Kume, Yasuoka, Omura and Watari14
(a and b) XRD patterns for LZT as-sintered and annealed samples under various conditions. (a) As-sintered sample, (b) annealed at 800 °C/4 h, (c) annealed at 800 °C/8 h, (d) annealed at 800 °C/12 h, (e) annealed at 800 °C/16 h, and (f) annealed at 800 °C/20 h. (c) XRD patterns for LZT as-sintered and annealed samples at 800 °C for 20 h.

The Rietveld refined plot of LZT ceramics annealed for 20 h.

Long-range order parameter (S) and lattice parameter of LZT samples as a function of annealing time, obtained from Rietveld refinement.

B. Density and microstructure
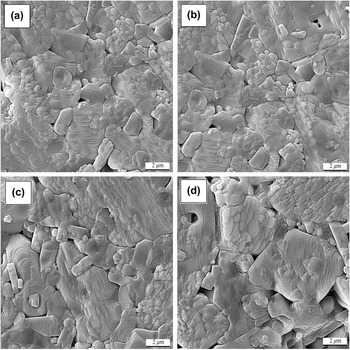
The relative densities of the samples sintered at 1075 °C for 4 h were 94.6% and also this amount remained almost stable after annealing-treatment under different conditions. The SEM micrographs of the sintered and annealed samples °C are illustrated in Figs. 5(a)–5(d). The grains are closely packed and a small amount of porosity can be observed. The majority of the grains have an average size of 6–8 μm.
SEM micrographs of sintered and annealed samples under various conditions (a) sintered sample, (b) annealed at 800 °C/4 h, (c) annealed at 800 °C/16 h, and (d) annealed at 800 °C/20 h.

C. Raman spectroscopy
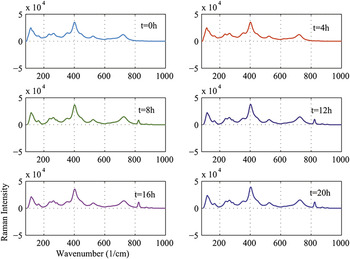
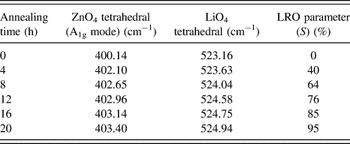
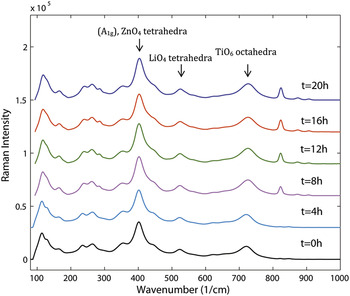
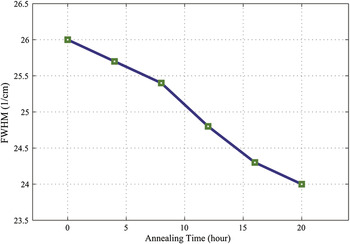
The Raman scattering technique is a more powerful tool over XRD to probe the local crystal structure, long-range order, more specifically cation occupancy sites, cation ordering, and also it provides the information that correlates the vibrational characteristics with the microwave dielectric properties. Reference Rout, Babu, Subramanian and Sivasubramanian23 Singh et al. Reference Singh, Kiran and Murthy24 indicated that Raman spectroscopy is a useful tool for probing cation occupancy at different sites in cubic spinel Li2Zn(1−x) Ni x Ti3O8 compounds. From the viewpoint of the lattice vibration, a LZT crystal with an ideal cubic spinel structure with space group P4332 symmetry in which the tetrahedral sites are randomly distributed does not show any Raman mode. By applying the group theory analysis, it was predicted that LZT has 40 fundamental Raman modes and 22 IR active modes. Reference Singh, Kiran and Murthy24 These compounds, with P4332 space group, possess inversion and according to the mutual exclusive rule, if the compound has center of symmetry, then all Raman active modes are IR inactive and vice versa. Therefore, for these compounds, all Raman modes are IR inactive. Reference Singh, Kiran and Murthy24 Figure 6 shows the room temperature Raman spectra of LZT-sintered and annealed samples °C. It can be seen from the Raman spectra of LZT-sintered (t = 0) °C and annealed (t = 4 h) samples, only 10 bands were observed whereas in samples that annealed with a holding time of 8, 12, 16, and 20 h, 12 bands were detected. The Raman bands of the LZT sample that annealed for 20 h in the region of 100–1000 cm−1 were included: 117.86, 165.44, 240.57, 262.93, 285.16, 354.66, 403.40, 524.94, 726.45, 823.80, 873.89, and 906.67 cm−1. Yang et al. reported that the band at 419 cm−1 was related to vibration Zn–O bond in ZnO4 tetrahedra. Reference Yang, Liu, Wang, Jiang, Hao, Zhan and Liu25 Thus, the band that observed at 403.40 cm−1 can be assigned to the Zn–O symmetric stretching vibrations in LZT ceramics. The bands at 726.45 and 823.80 cm−1 arise due to symmetric relaxation of TiO6 octahedra. Also, the band observed at 524.94 cm−1 can be ascribed to LiO4 tetrahedra. Reference Julien and Massot26 Moreover, the Raman shift of A1g mode of ZnO4 tetrahedra and LiO4 tetrahedra and the long-range order (S) parameter based on annealing time are summarized in Table I. It is observed that the stretch mode of the Zn-tetrahedra A1g at 400.14 shifted toward a higher wave number (cm−1) with higher annealing time (t = 20 h), which implied a stronger bonding in the LZT structure and consequently a more stable-ordered structure (as exhibited in Table I). Furthermore, it could be ascribed to increase of Zn2+ cation occupancy in tetrahedral site (8c) with the increase in annealing time, which leads to increase in the Zn–O bond strength in tetrahedral site (8c). The intensity of Raman modes for the annealed samples (t = 4, 8, 12, 16, and 20) became clearly higher, indicating the enhancement of ordering degree of LZT structure, as exhibited in Fig. 7. It was noteworthy that the intense and narrow Raman modes are usually observed for well-ordered structure. Reference Singh, Kiran and Murthy24 Lee et al. Reference Lee, Lin, Huang, Su and Hu21 reported that the intensity of Raman active modes was increased with higher sintering temperature, and with longer soaking time, which was suggested that the 1:2 ordered nanoregions grew with sintering temperature and soaking time. Since the symmetric stretching is possible in Li-octahedral, the band 403.40 cm−1 is assigned as A1g mode of ZnO4 tetrahedra. To analyze the spectra quantitatively, the Raman spectra in the range 300–600 cm−1 were fitted with three Lorentzians. Figure 8 illustrates the variations of the full-width at half-maximum (FWHM) of A1g mode in the Raman spectra under different annealing conditions (t = 4, 8, 12, 16, and 20 h). The FWHM of A1g mode dropped down with higher annealing time, which suggested less variation in the Zn–O bond length and a higher degree of ordering. It is worth mentioning that the FWHM broadness of the A1g mode is a measure of dielectric loss in dielectric material. Reference Rout, Babu, Subramanian and Sivasubramanian23,Reference Singh, Kiran and Murthy24 Hence, the dielectric loss can be decreased by decreasing in FWHM broadness of A1g mode. As shown in Table I, the wave number (cm−1) of LiO4 tetrahedra mode for the sintered sample shifted toward a higher wave number (cm−1) with higher annealing time (t = 20 h). This could be ascribed to the increase of Li1+ cation occupancy in tetrahedral site (8c). These results indicate that the (310) superlattice reflection and splitting could be due to the increase in Zn–O and Li–O bond strength and Zn2+, Li1+ cation ordering, which leads to lower dielectric loss.
Room temperature Raman spectra for as-sintered and annealed samples under various conditions (t = 0, 4, 8, 12, 16, and 20 h).

Raman shift of A1g mode of ZnO4 tetrahedra and LiO4 tetrahedra and long-range order (S) parameter variation as a function of annealing time of LZT ceramics.

The variations of Raman modes of LZT ceramics as a function of annealing time (t = 0, 4, 8, 12, 16, and 20 h).

The FWHM of A1g mode of ZnO4 tetrahedra of LZT ceramics as a function of annealing time.

D. Microwave dielectric properties
1. Quality factor (Q × f)
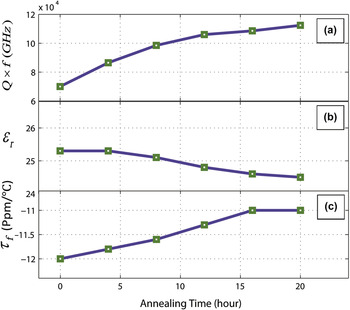
The Q × f values of LZT-sintered and annealed samples at 800 °C in a time variation from 4 to 20 h are shown in Fig. 9(a). The Q × f value of the sintered sample is 70,000 GHz, and this amount enhanced significantly with increasing annealing time to a maximum value of 112,400 GHz for the sample annealed for 20 h, which suggests the increase of cation ordering degree. It indicates that the tetrahedral site (8c) cation occupancy and ordering are one of the important factors for the enhancement of Q × f value in LZT ceramics, which leads to minimization of dielectric loss. Singh et al. Reference Singh, Kiran and Murthy24 reported that with increase in tetrahedral occupancy of Zn2+ cations, the Q × f value of cubic spinel Li2Zn(1−x)Ni x Ti3O8 compounds is enhanced. In general, the dielectric loss is affected by intrinsic and extrinsic factors. The intrinsic loss is mostly due to anharmonic forces that mediate the interaction between crystal lattice and phonons as structural characteristics, which lead to damping of optical phonons. The extrinsic loss is associated with imperfections in the crystal structure such as density, grain size, impurities, and secondary phase. Reference Freer and Azough27,Reference Penn, Alford, Templeton, Wang, Xu, Reece and Schrapel28 In these ceramics, the dielectric loss contribution is minimal due to extrinsic factors such as higher density (∼94.6%), absence of secondary phase, and almost normal grain size of all samples. Hence, the Q × f value variation in LZT samples should be due to intrinsic parameters as structural characteristics. Note that structural characteristics can be evaluated by occupancies of cations at different sites, ordering, and packing factor. Reference Singh, Kiran and Murthy24,Reference Leonidov, Leonidova, Samigullina and Patrakeev29 Furthermore, the damping factor (γ) depends mainly on the effect of anharmonic terms in the potential energy associated with a pair of atoms, and therefore, the structural characteristics (ordering) effectively control the intrinsic losses of the dielectric. The damping factor (γ) is related to loss tangent (tanδ) with the relation:
 $$\tan \delta = \left( {{\gamma \over {\mathop {{\omega _{\rm{T}}}}\nolimits^2 }}} \right)f\quad ,$$
where
 $\mathop {{\omega _{\rm{T}}}}\nolimits^2$
is the resonant frequency of the optical mode of the lattice vibration.
Reference Freer and Azough27
This relation clearly indicates that the loss tangent decreases with decreasing the damping factor. It can be said that the damping factor decreases with increase in cation ordering in LZT crystal structure, which leads to higher quality factor. Furthermore, the AC conductivity (σac) is correlated with loss tangent (tanδ) with the relation
Reference Singh, Kiran and Murthy24
:
 $$\tan \delta = {{{\sigma _{{\rm{ac}}}}} \over {{\varepsilon _{\rm{r}}}{\varepsilon _0}\omega }}\quad ,$$
where ω is the angular frequency. This relation obviously indicates that the loss tangent decreases with decrease in the conductivity of samples. It is well recognized that the AC conductivity of spinels depends on the distribution of cations at different sites. Reference Leonidov, Leonidova, Samigullina and Patrakeev29 Kawai et al. Reference Kawai, Tabuchi, Nagata, Tukamoto and West8 reported that LZT ceramic is a poor Li-ion conductor and Li-ion conduction through the 8c-12d-8c pathway was blocked significantly by Zn2+ located at the tetrahedral (8c) site. Raman spectra revealed that the Zn–O bond strength in ZnO4 tetrahedra (A1g mode) is increased with increase in annealing time, which leads to create strength block in the 8c-12d-8c pathway and cause severe decrease in Li-ion conduction. Therefore, the AC conductivity in LZT structure decreases with longer annealing time, and it could be due to increase in Zn–O bond strength in ZnO4 tetrahedra (A1g mode), which leads to lower dielectric loss (Q × f = 1/tanδ).
(a) Quality factor, (b) dielectric constant, and (c) temperature coefficient of the resonant frequency of LZT ceramics annealed at 800 °C in a time variation from 4 to 20 h.

2. Dielectric constant (εr)
The εr values of LZT-sintered and annealed samples at 800 °C in a time variation from 4 to 20 h are depicted in Fig. 9(b). An inconsiderable decrease in εr value is observed after annealing-treatment. It has been reported that the Q × f value and εr value are not independent variables based on physical argument. Reference Ma, Yi, Liu, Li and Chen30 If log10 Q × f for some commercial ceramics is plotted against εr, a straight line is obtained, and for ceramics with higher Q × f values generally exhibit lower εr value. Reference Ma, Yi, Liu, Li and Chen30 Hence, the inconsiderable reduction in the εr value in the annealed samples is reasonable.
3. Temperature coefficient of resonant frequency (τf)
The τf values of the LZT-annealed samples for different time durations from 4 to 20 h are shown in Fig. 9(c). The τf value of the sample sintered at 1075 °C for 4 h was −12 ppm/°C. It is clear that there was no difference between the τf value of sintered and annealed samples. Finally, the microwave dielectric properties of LZT ceramics that annealed at 800 °C for 20 were obtained: a Q × f value of 112,400 GHz, a εr value of 24.5, and a τf value of −11 ppm/°C.
IV. CONCLUSION
This study indicates that the annealing time plays a key role to form ordered structure, which is closely related to quality factor. The long-range order parameter in the annealed samples increased via increasing annealing time too. The most significant enhancement of quality factor is obtained in the sample annealed at 800 °C for 20 h, while the dielectric constant and temperature coefficient of resonant frequency change slightly. The quality factor of ceramics annealed for 20 h mainly enhanced the cation ordering degree, which could be related to the increase in the Zn–O bond strength in ZnO4 tetrahedra (A1g mode). Raman spectra revealed that the stretch mode of the Zn-tetrahedra A1g at 400.14 shifted toward a higher wave number (cm−1) with higher annealing time (t = 20 h), which implied a stronger bonding in the structure and consequently a more stable-ordered structure. Meanwhile, the FWHM of A1g mode decreased with higher annealing time, which suggested less variation in the Zn–O bond length and a higher degree of ordering. The best combination of microwave dielectric characteristic is obtained in the sample annealed at 800 °C for 20 h: Q × f = 112,400 GHz, εr = 24.500, and τf = −11 ppm/°C.