Fermented dairy products hold a significant place in both traditional dietary habits and the modern functional food market. Yogurt, in particular, stands out for its high nutritional value and easy digestibility. Yogurt and probiotic fermented milks contain high-quality proteins, essential fatty acids, vitamins and minerals, as well as viable lactic acid bacteria (LAB) that can support gut health and immune function (Ghosh et al., Reference Ghosh, Sarkar, Pati, Singha, Pramanik, Mondal and Mondal2019; Hadjimbei et al., Reference Hadjimbei, Botsaris and Chrysostomou2022). The associated health effects of probiotics, however, depend critically on their survival at adequate levels throughout processing and storage, and international guidelines commonly recommend at least 106–107 CFU/g at the time of consumption to achieve meaningful physiological benefits (Meybodi et al., Reference Meybodi, Mortazavian, Arab and Nematollahi2020).
Conventional yogurt is produced using Lactobacillus delbrueckii subsp. bulgaricus and Streptococcus thermophilus as starter cultures; these cultures promote acid formation and texture development, but their resistance to gastrointestinal conditions is limited (Ayivi and Ibrahim, Reference Ayivi and Ibrahim2022). To enhance its functional value, probiotic strains such as Lactobacillus acidophilus and Bifidobacterium spp. are frequently added to yogurt and fermented milk (Hadjimbei et al., Reference Hadjimbei, Botsaris and Chrysostomou2022). However, during cold storage, factors such as post-acidification, organic acid accumulation, interactions with starter cultures, oxygen exposure and cold stress can reduce probiotic viability (Meybodi et al., Reference Meybodi, Mortazavian, Arab and Nematollahi2020). This can both decrease the number of probiotics and affect important quality characteristics such as pH, titratable acidity, syneresis, texture and sensory acceptance (Nor-Khaizura et al., Reference Nor-Khaizura, Flint, McCarthy, Palmer and Golding2019). Maintaining sufficient probiotic cell numbers throughout the declared shelf life therefore remains a major technological challenge for yogurt manufacturers.
Synbiotic products offer a promising strategy for enhancing both microbial viability and overall functionality in fermented dairy products by combining probiotics with selectively fermentable prebiotic components (Markowiak and Śliżewska, Reference Markowiak and Śliżewska2017; Hadjimbei et al., Reference Hadjimbei, Botsaris and Chrysostomou2022). Prebiotics such as inulin, fructooligosaccharides, galactooligosaccharides and resistant starch can regulate the fermentation environment and provide additional substrates that support probiotic growth during storage (Gibson et al., Reference Gibson, Hutkins, Sanders, Prescott, Reimer, Salminen, Scott, Stanton, Swanson, Cani, Verbeke and Reid2017). Several studies have shown that appropriate prebiotic supplementation can increase the survival of L. acidophilus and Bifidobacterium spp. in yogurt and similar products; however, the degree of this effect depends on prebiotic species, dose and strain characteristics (Aryana and McGrew, Reference Aryana and McGrew2007). Furthermore, prebiotics can alter physicochemical properties such as viscosity, water-holding capacity and syneresis. This can also have an impact on texture and consumer acceptance.
In recent years, banana-derived components have gained increasing interest as natural prebiotic sources in synbiotic dairy products. Green or unripe banana flour, banana biomass and banana peel preparations are rich in resistant starch, non-digestible carbohydrates and phenolic compounds and are therefore considered promising functional ingredients that can be added to yogurt and fermented milk formulations (Munir et al., Reference Munir, Mukhtar, Anwar, Afzaal, Aadil and Nadeem2024). Several studies have shown that the addition of green banana flour, banana biomass or banana fibre/peel fibre to yogurt or synbiotic fermented milks can alter fermentation behaviour, improve texture (Roy et al., Reference Roy, Saha, Akter, Hosain, Khatun and Roy2015) and water-holding capacity (Abdelazez et al., Reference Abdelazez, Mohamed, Refaey and Niu2024), increase total phenolic content (TPC) (Kabir et al., Reference Kabir, Hasan, Islam, Haque and Hasan2021) and, in some cases, support the survival of probiotic strains such as Lactobacillus and Bifidobacterium spp. during cold storage (Zahid et al., Reference Zahid, Ranadheera, Fang and Ajlouni2022). However, to the best of our knowledge, the combined evolution of probiotic viability and quality attributes over shelf life has not yet been systematically characterised for yogurts specifically enriched with freeze-dried banana powder in combination with classical yogurt starters and L. acidophilus.
During cold storage, yogurt undergoes slow but significant physicochemical and microbiological changes. Post-acidification typically leads to a gradual decrease in pH and an increase in titratable acidity, while rearrangements in the casein network can alter viscosity and increase serum separation (Haque et al., Reference Haque, Richardson and Morris2001; Nor-Khaizura et al., Reference Nor-Khaizura, Flint, McCarthy, Palmer and Golding2019). These changes can either support or compromise probiotic survival, depending on product formulation and storage conditions (Meybodi et al., Reference Meybodi, Mortazavian, Arab and Nematollahi2020). Therefore, monitoring not only probiotic counts but also the concurrent changes in key physicochemical and functional parameters in synbiotic systems is critical for determining a realistic and high-quality shelf life (Hadjimbei et al., Reference Hadjimbei, Botsaris and Chrysostomou2022). Although many studies have explored probiotic viability in yogurt and the impact of different prebiotic fibres, there is still limited information on how synbiotic formulations enriched with freeze-dried banana powder influence the combined trajectory of probiotic survival, acidification, physical stability and functional properties during cold storage.
Against this background, this study investigates the impact of freeze-dried banana powder on probiotic survival and quality attributes of yogurt during cold storage, with a particular focus on structure–function relationships. While previous studies have examined various plant-based prebiotic ingredients in yogurt systems, limited information is available on the combined effects of banana-derived components on microbial viability, acidification behaviour and gel structure over shelf life. The novelty of this work lies in its integrated evaluation of microbiological, physicochemical, rheological and sensory properties to better understand how banana powder influences both probiotic performance and yogurt matrix structure under refrigerated conditions.
Materials and methods
The experimental work was organised in two consecutive stages: (i) a fermentation phase, in which yogurt batches were produced under controlled processing conditions, and (ii) a cold storage phase, during which the resulting products were monitored throughout refrigerated shelf life. The detailed methodologies for each of these stages are provided in the following subsections.
Yogurt manufacture and fermentation conditions
All yogurt samples included in the storage study were produced under the fermentation conditions previously optimised for synbiotic yogurt. In that preliminary work, the conditions that maximised L. acidophilus growth were identified as a fermentation temperature of 41.5 °C, a freeze-dried banana powder concentration of 2% (w/v), and a 1:1 inoculation ratio between the yogurt starter cultures (L. delbrueckii subsp. bulgaricus and S. thermophilus) and the probiotic strain (L. acidophilus).
For the present study, 1 L of homogenised and deaerated ultra-high-temperature cow’s milk (1.5% fat) was used for each formulation and inoculated with L. delbrueckii subsp. bulgaricus (M1) and S. thermophilus (M2) as starter cultures, with or without L. acidophilus (M3). Freeze-dried banana powder was incorporated only into the synbiotic formulation at 2% (w/v). All bacterial cultures were supplied by Chr. Hansen (Denmark). Fermentation was conducted isothermally at 41.5 °C until the pH, monitored using a calibrated pH meter (Mettler Toledo, Switzerland), reached 4.7 ± 0.2. This fermentation end-point was selected to ensure consistent gel formation among all yogurt formulations. The yogurts were then rapidly cooled to 4 °C. The fermentation time required to reach the target pH was approximately 8 h for all formulations.
Accordingly, three yogurt formulations were prepared separately for the storage study, each representing a different level of functional enrichment:
• Sample A: conventional yogurt containing only the starter cultures M1 and M2;
• Sample B: probiotic yogurt containing M1, M2 and M3; and
• Sample C: synbiotic yogurt containing M1, M2 and M3 plus 2% (w/v) freeze-dried banana powder.
Chemical and functional characterisation of freeze-dried banana powder
The chemical composition and functional properties of the freeze-dried banana powder used in the synbiotic formulation were determined prior to yogurt manufacture. Protein, moisture, ash and fat contents were analysed according to AOAC (2012) standard methods. TPC was determined using the Folin–Ciocalteu method (Wojdyło et al., Reference Wojdyło, Oszmiański and Czemerys2007). In addition, antioxidant capacity was evaluated by ABTS (Thaipong et al., Reference Thaipong, Boonprakob, Crosby, Cisneros-Zevallos and Byrne2006) and CUPRAC (Apak et al., Reference Apak, Güçlü, Özyürek and Çelik2008) assays following spectrophotometric procedures. All analyses were performed in duplicate.
Microbiological analysis
Shelf-life analyses were performed on samples collected after 1, 7, 14 and 21 days of cold storage. LAB counts during storage were determined by plating yogurt samples on MRS agar under microaerophilic conditions at 42 °C, following established standards and methodological guidelines for yogurt microorganisms (ISO 2003; Nor-Khaizura et al., Reference Nor-Khaizura, Flint, McCarthy, Palmer and Golding2019; Ge et al., Reference Ge, Yu, Zhao, Liu, Li, Mu, Zhang, Chen, Zhang, Song, Zhao and Yao2024), and results were expressed as log CFU/g.
pH measurement
The pH of the yogurt samples was measured using a calibrated pH meter (Mettler Toledo, Switzerland). Active acidity (pH) is a critical parameter influencing the shelf life, sensory properties and incubation behaviour of fermented dairy products (Nor-Khaizura et al., Reference Nor-Khaizura, Flint, McCarthy, Palmer and Golding2019).
Titratable acidity
Titratable acidity, expressed as % lactic acid, was determined by titration. Ten grams of yogurt sample were mixed with 0.5 mL of 1% phenolphthalein solution and titrated with 0.25 N NaOH until a persistent pale pink colour was observed. The results were calculated using Eq. (1) (AOAC 2012):
 \begin{equation}\% {\text{Acidity}}\;({\text{as}}\;{\text{lactic}}\;{\text{acid}}) = \frac{{V \times N \times 0.09}}{m} \times 100,\end{equation}
where V is the volume of NaOH consumed (mL), N is the normality of the NaOH solution and m is the mass of the yogurt sample (g). The constant 0.09 represents the milliequivalent of lactic acid corresponding to 1 mL of 1 N NaOH.
Protein content
Total protein content of the yogurts was determined by the Kjeldahl method according to AOAC 991.22. Approximately 1.5 g of homogenised yogurt was weighed into a Kjeldahl tube, followed by the addition of concentrated sulphuric acid (density 1.84 g/mL) and a catalyst tablet. After gentle mixing, the tubes were placed in the digestion block and heated stepwise until a clear green solution was obtained at around 400 °C. A reagent blank was prepared in the same way without sample. Following digestion and cooling to room temperature, the samples were distilled into boric acid solution with a mixed indicator, and the distillates were titrated with 0.1 N HCl until the end-point. Protein content was calculated using Eq. (2) (AOAC 2012):
 \begin{equation}{\text{Total protein }}\left( {\text{\% }} \right) = \frac{{\left( {{V_1} - {V_2}} \right) \times 0.0014 \times F}}{m} \times 100,\end{equation}
where V₁ is the volume of HCl used for the sample (mL), V₂ is the volume of HCl used for the blank (ml), F is the conversion factor for milk products (6.38) and m is the sample mass (g). The constant 0.0014 represents the grams of nitrogen corresponding to 1 mL of 0.1 N HCl.
Moisture content
Moisture content was determined using a moisture analyser (AND MX-50, Japan). Yogurt samples were weighed into the sample pan and dried according to the instrument’s standard program until a constant mass was reached. Results were expressed as percentage moisture (%).
Ash content
For ash determination, pre-weighed porcelain crucibles were dried at 200 °C in a muffle furnace until a constant weight. Approximately 5 g of yogurt sample was then placed into each crucible and ashed at 550 °C until a white ash was obtained. The crucibles were cooled in a desiccator to room temperature and weighed on an analytical balance. Ash content was calculated and expressed as a percentage of sample mass (AOAC 2012).
Serum separation (syneresis)
Serum separation was evaluated by centrifugation. Ten grams of yogurt were transferred into a centrifuge tube and centrifuged at 2500 rpm for 10 min at 4 °C using a bench-top centrifuge (Hettich Rotofix 32 A, Germany). The separated supernatant was carefully decanted and weighed. The percentage of serum separation was calculated as described by Farnsworth et al. (Reference Farnsworth, Li, Hendricks and Guo2006):
 \begin{equation}{\text{Syneresis }}\left( {\text{\% }} \right) = \frac{{Weight\,of\,supernatant\,\left( g \right)}}{{Weight\,of\,yogurt\,sample\,\left( g \right)}} \times 100\end{equation}
Total phenolic content
For the determination of TPC, 1 g of sample was extracted with 5 mL of 80% (v/v) methanol using ultrasonic treatment (15 min) and orbital shaking (10 min), followed by centrifugation (4000 rpm, 10 min) and filtration (0.45 μm) (Czaja et al., Reference Czaja, Czubaszek, Wyspiańska, Sokół-Łętowska and Kucharska2020). TPC was determined using the Folin–Ciocalteu method. For each sample, 0.5 mL of extract was mixed with 0.2 mL of 2 N Folin–Ciocalteu reagent and 2 mL of distilled water. After mixing, the tubes were kept at room temperature for 3 min, followed by the addition of 1 mL of 7.5% (w/v) Na₂CO₃ solution. The mixtures were vortexed and incubated at room temperature for 1 h in the dark. Absorbance was read at 765 nm using a UV–Vis spectrophotometer (PG Instruments Ltd. T60, UK). A calibration curve was constructed using gallic acid as the standard, and TPC was expressed as mg gallic acid equivalents (GAE) per 100 g dry matter (Wojdyło et al., Reference Wojdyło, Oszmiański and Czemerys2007).
Viscosity
Viscosity, an indicator of flow resistance and an important quality attribute in yogurt, was measured using a rotational viscometer (Anton Paar ViscoQC 100, Austria). Prior to analysis, the samples were gently stirred for 15 s to achieve a homogeneous consistency. Measurements were performed at 4 °C using spindle RH4 at 100 rpm. The apparent viscosity (mPa · s) recorded at the 60th second was taken as the final viscosity value for each sample (Akan, Reference Akan2022).
Sensory evaluation
Sensory evaluation of the yogurt samples was carried out at the Food Engineering Research Laboratory of Istanbul Aydın University. Three trained panellists evaluated the samples 1 day after production. Yogurts were assessed for appearance, texture, taste and aroma using a nine-point hedonic scale (1 = dislike extremely, 9 = like extremely) as described by Gunes-Bayir et al. (Reference Gunes-Bayir, Bilgin, Guclu, Pogda and Dadak2022). Panellists rinsed their mouths with water between samples to minimise carryover effects.
Statistical analysis
All experiments were conducted according to a completely randomised design. Data analysis was performed using Minitab Version 16.0 (Minitab Inc., PA, USA). The effects of formulation and storage time were evaluated by analysis of variance (ANOVA), followed by Tukey’s multiple range test for post hoc comparisons. A single fermentation batch was prepared for each formulation and divided into separate containers corresponding to each storage day (days 1, 7, 14 and 21). These containers remained unopened until analysis. All analytical measurements were performed in duplicate, and differences were considered statistically significant at P < 0.05. Results are presented as mean ± standard deviation. A summary of the two-way ANOVA evaluating the effects of treatment, storage and their interaction on the measured variables is provided in Supplementary Material Table S1.
Results and discussion
After completion of fermentation, all shelf-life analyses were performed on yogurt samples collected on days 1, 7, 14 and 21 of cold storage. The formulations were coded as A, B and C. Sample A represented the conventional yogurt produced with L. delbrueckii subsp. bulgaricus (M1) and S. thermophilus (M2) as starter cultures. Sample B was a probiotic yogurt containing the same starter strains plus L. acidophilus (M3). Sample C corresponded to the synbiotic yogurt, produced with M1, M2 and M3 and additionally enriched with freeze-dried banana powder as a prebiotic ingredient.
Chemical and functional characterisation of freeze-dried banana powder
The chemical composition and functional properties of the freeze-dried banana powder used in the synbiotic formulation are presented in Table 1. These results indicate that banana powder is a rich source of bioactive compounds, particularly phenolics, which may contribute to the functional properties of the synbiotic yogurt.
Chemical composition, total phenolic content (TPC, mg GAE/100 g DM) and antioxidant activity determined by ABTS assay (mg TE (Trolox Equivalent)/100 g DM) and CUPRAC assay (mg TE/100 g DM) of freeze-dried banana powder

Table 1 Long description
Freeze-dried banana powder composition and bioactive measures are reported as mean values with standard deviations. Carbohydrate is the dominant macronutrient at 74.34 percent, followed by protein at 9.31 percent and moisture at 8.16 percent. Ash is 5.90 percent and fat is 2.30 percent, making fat the smallest component listed. Total phenolic content is 29.91 mg GAE per 100 g dry matter. Antioxidant activity is higher by CUPRAC at 502.75 mg TE per 100 g dry matter than by ABTS at 238.80 mg TE per 100 g dry matter. Moisture is reported on an as-measured basis, while the other composition values and the bioactive measures are expressed relative to dry matter, so direct comparisons should keep the basis in mind.
Note: Values were given as means ± standard deviation. Chemical composition, except moisture, is based on dry matter (DM).
Microbiological analysis
Changes in LAB counts during storage are presented in Table 2. The effects of formulation, storage time and their interaction on LAB counts are summarised in Supplementary Material Table S1. LAB populations serve as key indicators of the yogurt's microbiological quality, reflecting fermentation performance and, for probiotic and synbiotic formulations, their functional potential. Therefore, monitoring LAB viability during storage is essential for evaluating shelf life and microbiological quality. Sample A, produced solely with traditional yogurt starters, showed an increase in LAB counts from day 1 to day 7, followed by a plateau, with no significant differences between days 7, 14 and 21 (P > 0.05). This pattern suggests that fermentation activity continued during the early storage period and then reached a steady state. In sample B, which included additional probiotic cultures, LAB counts peaked at day 7 and subsequently declined, with significantly lower values on days 14 and 21 compared with day 1. The decrease in LAB numbers at later storage times may be associated with nutrient depletion, accumulation of organic acids and exposure to cold stress, all of which can reduce cell viability. Sample C, representing the synbiotic yogurt containing probiotic cultures and banana powder, also exhibited maximum LAB counts at day 7, followed by a moderate decline. Importantly, LAB levels on day 21 remained higher than those recorded on day 1, indicating better maintenance of bacterial viability over time. This suggests that the prebiotic component may have provided an additional substrate supply, supporting LAB survival during storage. The enhanced LAB survival in sample C may be supported by the freeze-dried banana powder, whose chemical composition and functional properties are presented in Table 1. When formulations were compared, sample B generally showed the highest LAB counts at the early stages of storage. In the synbiotic formulation (C), LAB counts at day 14 were similar to those of B (P > 0.05), but were slightly lower by day 21. This pattern suggests that prebiotic addition enhances bacterial survival, although its protective effect declines slightly by the end of the storage. These trends are consistent with literature reports. Akın and Akın (Reference Akın and Akın2016) observed increased L. delbrueckii subsp. bulgaricus counts in yogurts fortified with apple fibre, with bacterial populations rising as fibre level increased, followed by a gradual decline during extended storage. Overall, storage time significantly influenced LAB viability, and the magnitude of these changes varied among formulations, as indicated by the significant formulation × storage interaction (Supplementary Material Table S1). Probiotic and synbiotic formulations supported higher LAB counts, while the synbiotic yogurt (C) maintained LAB viability during storage. This behaviour suggests that the presence of banana-derived carbohydrates may have provided a sustained substrate supply, supporting bacterial metabolism and improving survival under cold storage stress conditions.
Lactic acid bacteria (LAB) concentration (log CFU/g) values of yogurt samples during storage

Table 2 Long description
Lactic acid bacteria concentration in yogurt is reported in log CFU per gram for three formulations (A, B, C) measured on storage days 1, 7, 14, and 21, with values given as mean plus or minus standard deviation. Sample B is highest at every time point, starting at 7.98 on day 1 and peaking at 8.45 on day 7, then dropping to 7.74 on day 14 and 7.79 on day 21. Sample A increases throughout storage from 6.42 on day 1 to 7.47 on day 7, 7.56 on day 14, and 7.59 on day 21. Sample C rises from 6.72 on day 1 to 7.94 on day 7, then decreases to 7.71 on day 14 and 7.32 on day 21. Across samples, day 7 is the highest point for B and C, while A continues a gradual increase through day 21. Letter codes attached to the means indicate statistically significant differences among formulations and among storage days, so comparisons should follow those groupings rather than relying only on small numeric gaps.
Note: Values are expressed as mean ± standard deviation. Different uppercase letters indicate significant differences among treatments (P < 0.05), while different lowercase letters indicate significant differences among storage days (P < 0.05). A: (M1 + M2); B: (M1 + M2) + M3; C: (M1 + M2) + M3 + banana powder.
pH
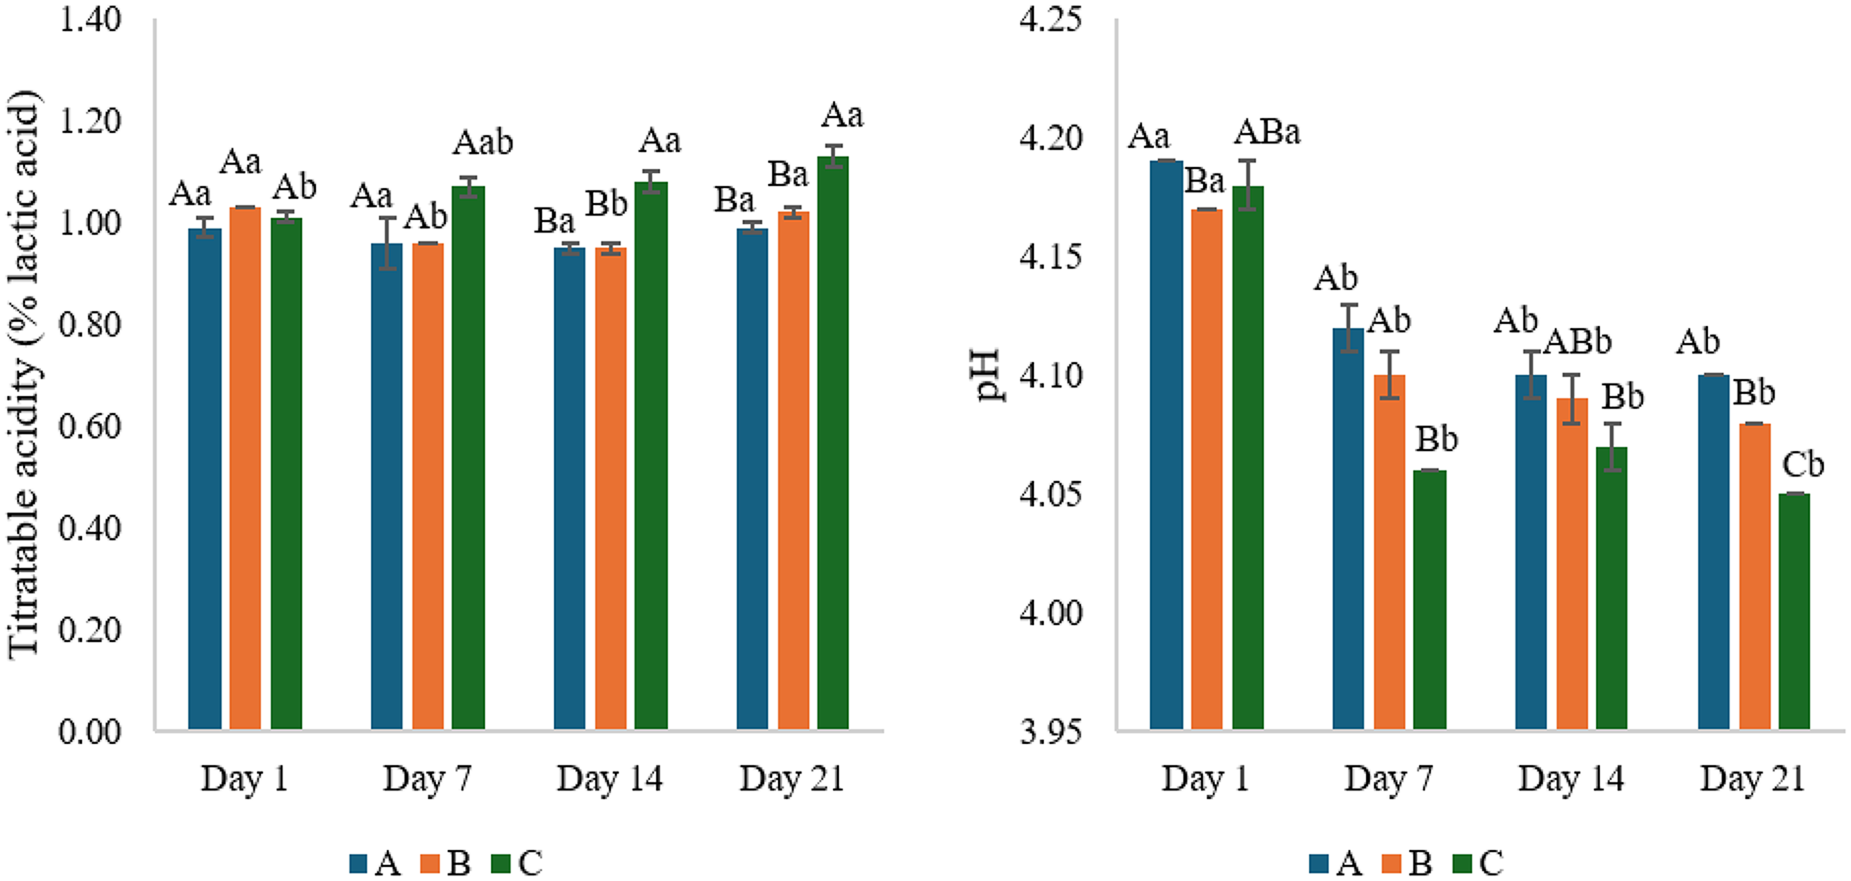
Changes in pH of the yogurt samples during storage are presented in Fig. 1. The effects of formulation, storage time and their interaction on pH changes are summarised in Supplementary Material Table S1. In all yogurt formulations, pH decreased progressively over time. This decline results from the continuation of slow fermentation at low temperature, during which LAB metabolise residual lactose and produce lactic acid. The fermentable sugars in the freeze-dried banana powder (Table 1) may have contributed to the slightly lower pH observed in sample C by providing additional substrate for LAB metabolism. The accumulation of organic acids increases hydrogen ion concentration and leads to a reduction in pH. A gradual pH decrease during cold storage has been frequently reported in yogurt studies. Izadi et al. (Reference Izadi, Nasirpour, Garoosi and Tamjidi2015), for example, noted that microbial activity in yogurt does not cease completely under refrigeration, and that residual fermentation contributes to a measurable drop in pH over time. When the three formulations were compared, yogurts containing banana powder as a prebiotic component exhibited lower pH values at the end of storage than the other samples (P < 0.05). This effect may be related to the presence of fermentable sugars and fibres in banana powder, which can serve as additional carbon sources and thereby stimulate lactic acid production. As a result, acidification is enhanced, and the pH decrease becomes more pronounced. Previous work with plant fibres and fruit powders supports this observation. García‐Pérez et al. (Reference García‐Pérez, Lario, Fernández‐López, Sayas, Pérez‐Alvarez and Sendra2005) reported lower pH values in yogurts containing orange fibre compared with controls, and attributed this effect to the water-binding capacity and fermentation-supporting properties of dietary fibre. Likewise, Marchiani et al. (Reference Marchiani, Bertolino, Belviso, Giordano, Ghirardello, Torri, Piochi and Zeppa2016) found that grape skin powder addition led to lower pH during storage, consistent with increased acid development. Taken together, the present results indicate that the observed pH decrease during storage reflects both the continuation of natural post-acidification and the influence of added ingredients on microbial activity. In particular, the more marked drop in pH in the banana-enriched yogurts suggests that prebiotic components may stimulate the metabolic activity of yogurt cultures during cold storage. The significant formulation × storage interaction indicates that the extent of pH reduction during storage depended on the yogurt formulation (Supplementary Material Table S1). This indicates that additional fermentable components from banana powder enhanced microbial metabolic activity, resulting in increased organic acid production and a more pronounced decrease in pH.
Changes in titratable acidity (% lactic acid) and pH values of conventional (A), probiotic (B) and synbiotic (C) yogurt samples during refrigerated storage (4 ± 1 °C) for 21 days. Measurements were performed on days 1, 7, 14 and 21. Values are expressed as mean ± standard deviation. Different uppercase letters (A–C) indicate significant differences among treatments within the same storage day (P < 0.05), while different lowercase letters (a and b) indicate significant differences among storage days within the same treatment (P < 0.05). A: M1 + M2; B: (M1 + M2) + M3; C: (M1 + M2) + M3 + banana powder.

Figure 1 Long description
Chart 1 (Titratable acidity). Vertical axis label: Titratable acidity (percent lactic acid). Range: 0.00 to 1.40. Horizontal axis labels: Day 1, Day 7, Day 14, Day 21. Legend labels: A, B, C. Day 1: A 1.00 with label Aa; B 1.00 with label Aa; C 1.00 with label Ab. Day 7: A 0.95 with label Aa; B 1.05 with label Ab; C 1.00 with label Ba. Day 14: A 0.95 with label Aa; B 1.05 with label Bb; C 1.00 with label Ba. Day 21: A 0.95 with label Aa; B 1.05 with label Bb; C 1.10 with label Aa. Trend notes: A stays at 1.00 on Day 1 then 0.95 on Day 7, Day 14 and Day 21. B is 1.00 on Day 1 and 1.05 on Day 7, Day 14 and Day 21. C is 1.00 on Day 1, Day 7 and Day 14, then 1.10 on Day 21. Chart 2 (pH). Vertical axis label: pH. Range: 3.95 to 4.25. Horizontal axis labels: Day 1, Day 7, Day 14, Day 21. Legend labels: A, B, C. Day 1: A 4.20 with label Aa; B 4.20 with label Ba; C 4.18 with label ABa. Day 7: A 4.10 with label Ab; B 4.10 with label Ab; C 4.06 with label Bb. Day 14: A 4.10 with label Ab; B 4.08 with label ABB; C 4.07 with label Bb. Day 21: A 4.10 with label Ab; B 4.08 with label Ab; C 4.05 with label Bb. Trend notes: A drops from 4.20 on Day 1 to 4.10 on Day 7 and stays at 4.10 on Day 14 and Day 21. B drops from 4.20 on Day 1 to 4.10 on Day 7, then is 4.08 on Day 14 and Day 21. C drops from 4.18 on Day 1 to 4.06 on Day 7, then is 4.07 on Day 14 and 4.05 on Day 21. Relationship between charts: Across Day 1 to Day 21, Chart 1 values stay near 1.00 with small increases for B and C by Day 21, while Chart 2 values decrease from Day 1 to later days.
Titratable acidity (% lactic acid)
Changes in titratable acidity of the yogurt samples during storage are presented in Fig. 1. The effects of formulation, storage time and their interaction on titratable acidity are summarised in Supplementary Material Table S1. According to the Turkish Food Codex for Fermented Milk Products (Turkish Food Codex 2022), the titratable acidity of yogurt must remain between 0.6% and 1.5% lactic acid. The presence of fermentable sugars in the freeze-dried banana powder (Table 1) may have slightly enhanced lactic acid production in sample C, explaining the more pronounced increase in titratable acidity. Throughout the 21-day storage period, all formulations remained within this legal range, indicating that the samples complied with the regulatory requirements. No significant differences in titratable acidity among samples A, B and C were detected on days 1 and 7 (P > 0.05). As storage progressed, acidity values of samples A and B did not differ significantly from each other on days 14 and 21 (P > 0.05), whereas sample C exhibited significantly higher titratable acidity than the other two formulations at these later time points (P < 0.05). Within sample C, titratable acidity increased markedly over storage, reflecting continued lactic acid production by yogurt starter bacteria such as L. delbrueckii subsp. bulgaricus and S. thermophilus during refrigeration. Continued lactose fermentation leads to additional lactic acid formation, thereby raising the acidity and contributing to a gradual decrease in pH. Similar observations have been reported in the literature, where added ingredients can modulate acid development in yogurt. Özcan and Yıldız (Reference Özcan and Yıldız2016) found little change in titratable acidity in yogurt supplemented with vegetable purees, whereas Akın and Akın (Reference Akın and Akın2016) observed increased acidity during storage in yogurts fortified with apple fibre, suggesting that certain plant-derived components may support microbial metabolism and acidification. Overall, the present findings show that all products met Codex limits for acidity throughout storage, and that the synbiotic formulation (sample C) displayed a more pronounced increase in titratable acidity, likely due to the synergistic effects of the incorporated prebiotic and the active LAB. The significant formulation × storage interaction indicates that the increase in titratable acidity during storage was dependent on yogurt formulation (Supplementary Material Table S1). The higher acidity in the synbiotic formulation can therefore be linked to enhanced substrate availability, which promotes continued fermentation and organic acid accumulation during storage.
Protein content
Protein contents of the yogurt samples during storage are presented in Table 3. According to the Turkish Food Codex for Fermented Milk Products (Turkish Food Codex 2022), the minimum protein content of yogurt should be 2.7% (w/w) milk protein. The minor protein contribution from the freeze-dried banana powder (Table 1) may have slightly influenced the initial protein content of sample C. In this study, all samples met or exceeded this requirement on every sampling day, confirming compliance with the regulatory standard. No statistically significant changes in protein content were detected over storage within any formulation (P > 0.05), indicating that cold storage did not appreciably affect the protein fraction. This stability suggests that yogurt proteins did not undergo substantial degradation or loss during storage and that the protein integrity of the product was preserved. Similarly, no significant differences in protein content were observed among the three formulations (A, B and C) at the same storage time (P > 0.05). Although the synbiotic formulation with banana powder had slightly higher initial protein values, these differences were not statistically significant, suggesting that the protein contribution of the banana powder was minor compared to milk proteins. These findings are in line with previous studies reporting that storage has little impact on the protein content of yogurt, regardless of formulation. Akın and Akın (Reference Akın and Akın2016) and Özcan and Yıldız (Reference Özcan and Yıldız2016) likewise observed only minor fluctuations in protein levels during storage in yogurts containing different added ingredients. In summary, the protein content of the yogurts remained essentially stable across formulations and storage times, and all products consistently exceeded the minimum level specified in the Turkish Food Codex, supporting their nutritional adequacy. This stability suggests that protein degradation was minimal and that the structural protein matrix remained largely unaffected by storage and formulation differences.
Protein (%), moisture (%) and ash (%) values of yogurt samples during storage

Table 3 Long description
Yogurt samples A, B, and C are compared across storage days 1, 7, 14, and 21 for protein, moisture, and ash, reported as mean with standard deviation. Protein remains relatively stable for all samples, ranging from 3.57 to 4.23 percent; sample C starts highest at day 1 (4.23) and sample B is lowest at days 7 and 21 (3.57). Moisture also changes little overall, spanning 88.31 to 90.88 percent; sample B is highest at day 1 (90.88) and sample C is lowest at day 21 (88.31). Ash shows the clearest upward pattern with storage time in every sample: A increases from 0.53 at day 1 to 1.03 at day 14, B rises from 0.69 at day 1 to 1.03 at day 21, and C rises from 0.47 at day 1 to 1.06 at day 21. By day 14 to 21, ash values converge near about 1.0 percent across all samples. Letter codes attached to the means indicate statistically significant differences among formulations and among storage days, so small numeric differences may not represent meaningful change.
Note: Values are expressed as mean ± standard deviation. Different uppercase letters indicate significant differences among treatments (P < 0.05), while different lowercase letters indicate significant differences among storage days (P < 0.05). A: (M1 + M2); B: (M1 + M2) + M3; C: (M1 + M2) + M3 +banana powder.
Moisture content
Moisture contents of the yogurt samples during storage are presented in Table 3. Statistical analysis showed that storage time had no significant effect on moisture levels in any of the formulations (P > 0.05), indicating that water content remained relatively constant over the 21-day period. The low moisture content of the freeze-dried banana powder (Table 1) likely contributed to the stability of water content in sample C. Comparisons among formulations also showed no significant differences in moisture content at the same storage time (P > 0.05). Thus, the inclusion of probiotic cultures and/or banana powder did not significantly alter the overall water content or water-holding behaviour of the products. Across all treatments, moisture values ranged between approximately 88.31% and 90.23%, corresponding to total solids contents of about 9.77–11.69%. These results confirm that yogurt is a high-moisture product and that the applied processing conditions yielded formulations with comparable total solids, regardless of the added components. Yogurt moisture can be affected by factors such as heat treatment, fermentation conditions, straining, additive type and storage conditions. In this study, the controlled manufacturing and storage parameters appear to have contributed to the observed stability in moisture content. Similar moisture ranges and trends have been reported in commercial yogurts, where storage time generally has little effect on overall water content (Eren-Karahan, Reference Eren-Karahan2016). Overall, the moisture and total solids contents of the yogurts were stable over storage and were not significantly affected by formulation, supporting the physicochemical stability of the products. These results indicate that the overall water balance of the system was not significantly altered, suggesting limited impact of added components on bulk water retention.
Ash content
Ash contents of the yogurt samples during storage are presented in Table 3. Ash represents the total mineral content of a food and is a key indicator of its mineral contribution to the diet. The mineral content of the banana powder, detailed in Table 1, may have slightly influenced the ash levels in sample C. Although some fluctuations in ash content were observed among formulations and storage days, these changes did not follow a clear trend and were not statistically meaningful. The small variations are likely due to analytical and sampling variability rather than to true changes in mineral composition, as well as slight concentration effects associated with moisture redistribution during storage. Thus, cold storage did not significantly affect the ash content of the yogurts. Minor differences among formulations may be attributed to the inherent mineral content of added ingredients such as banana powder or other prebiotic components. However, the overall similarity of ash levels suggests that these contributions were limited and did not substantially alter the total mineral content. These observations agree with previous reports indicating that ash content in yogurt remains largely unchanged throughout storage. Arslaner et al. (Reference Arslaner, Salik and Bakirci2021), for example, found that ash levels in yogurts produced with different formulations were relatively stable over time, reflecting the chemical robustness of mineral constituents in dairy matrices. In summary, the ash content of the samples was maintained during cold storage, and formulation differences had only minor effects, indicating that the mineral profile of the yogurts remained stable. This confirms that mineral composition remained stable, as inorganic components are generally unaffected by microbial and physicochemical changes during storage.
Serum separation (syneresis)
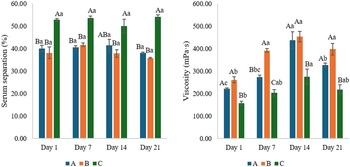
Serum separation values of the yogurt samples over storage are presented in Fig. 2. Syneresis is defined as the appearance of free whey on the surface or within the container and is a critical indicator of the physical stability and structural integrity of set-type yogurt. It reflects the ability of the gel network to retain water; increased syneresis is generally regarded as undesirable from a quality perspective (Özcan and Yıldız, Reference Özcan and Yıldız2016). Over the 21-day storage period, no statistically significant changes in serum separation were observed within any of the formulations (P > 0.05), suggesting that storage time per se did not markedly affect the physical stability of the gel structure. The yogurt gel network remained fairly stable under the applied conditions. However, clear differences emerged among formulations. No significant difference in serum separation was found between samples A and B (P > 0.05), whereas sample C exhibited significantly higher syneresis values than both A and B on all storage days (P < 0.05). The increased serum separation in sample C is likely related to the presence of banana powder in the formulation. Although banana powder is rich in fibre, its interaction with milk proteins may not fully strengthen the gel matrix and may instead slightly disturb the protein network, reducing water-binding capacity and promoting whey expulsion. In addition, plant-derived ingredients can influence pH and ionic strength, thereby indirectly affecting gel structure and stability. Similar findings have been reported in studies where plant-based ingredients increased syneresis relative to control yogurts, depending on their structural and hydration properties (Özcan and Yıldız, Reference Özcan and Yıldız2016). Overall, the present results indicate that cold storage did not significantly influence serum separation, but that the synbiotic formulation containing banana powder (sample C) showed greater syneresis, suggesting some weakening of the gel structure compared with the conventional and probiotic formulations. This behaviour may be attributed to disruptions in the casein network caused by protein–polysaccharide interactions, leading to reduced water-holding capacity and increased whey separation.
Changes in serum separation (%) and viscosity (mPa · s) of conventional (A), probiotic (B) and synbiotic (C) yogurt samples during refrigerated storage (4 ± 1 °C) for 21 days. Measurements were conducted on days 1, 7, 14 and 21. Values are expressed as mean ± standard deviation. Different uppercase letters (A–C) indicate significant differences among treatments within the same storage day (P < 0.05), while different lowercase letters (a–c) indicate significant differences among storage days within the same treatment (P < 0.05). A: M1 + M2; B: (M1 + M2) + M3; C: (M1 + M2) + M3 + banana powder.

Figure 2 Long description
Bar chart with y-axis label Serum separation (percent) and x-axis categories Day 1, Day 7, Day 14, Day 21. The y-axis range is 0.00 to 60.00. Each day has three bars labeled A, B and C, with letter annotations above each bar. Day 1: A 38.00 with annotation Ba; B 36.00 with annotation Ba; C 50.00 with annotation Aa. Day 7: A 40.00 with annotation Ba; B 41.00 with annotation Ba; C 50.00 with annotation Aa. Day 14: A 39.00 with annotation ABa; B 37.00 with annotation Ba; C 50.00 with annotation Aa. Day 21: A 38.00 with annotation Ba; B 35.00 with annotation Ba; C 50.00 with annotation Aa. Bar chart with y-axis label Viscosity (mPa dot s) and x-axis categories Day 1, Day 7, Day 14, Day 21. The y-axis range is 0.00 to 600.00. Each day has three bars labeled A, B and C, with letter annotations above each bar. Day 1: A 250.00 with annotation Ab; B 200.00 with annotation Bb; C 150.00 with annotation Cc. Day 7: A 400.00 with annotation Aa; B 200.00 with annotation Cab; C 250.00 with annotation Bbc. Day 14: A 500.00 with annotation Aa; B 450.00 with annotation Aa; C 280.00 with annotation Ba. Day 21: A 450.00 with annotation Aa; B 350.00 with annotation Ab; C 220.00 with annotation Bab.
Total phenolic content
TPC values of the yogurt samples over storage are presented in Table 4. Phenolic compounds contribute significantly to the antioxidant capacity of fermented dairy products and can originate from both the milk matrix and added plant-based ingredients, such as fruit powders or dietary fibres. The higher TPC and the associated antioxidant activity in sample C can be attributed to the freeze-dried banana powder, whose TPC and antioxidant capacity measured by ABTS and CUPRAC assays are detailed in Table 1. The addition of banana powder resulted in higher TPC values in sample C compared to A and B; however, temporal variations were observed during storage. This finding reflects the inherently high phenolic content of banana-derived materials and their capacity to increase the pool of polyphenols in the yogurt matrix. In samples without banana powder (A and B), TPC values were lower and more variable over time, whereas sample C exhibited markedly higher TPC, particularly at earlier storage times (days 1 and 7). The higher phenolic content in C suggests not only a direct contribution from the banana powder but also that interactions between the plant matrix and the dairy system may facilitate the release or solubilisation of phenolic compounds. These findings indicate that freeze-dried banana powder contributes to higher overall phenolic content in yogurt, although temporal fluctuations were observed during storage. This increase reflects the direct contribution of banana-derived phenolic compounds, which may also interact with milk proteins and influence the functional properties of the system.
Total phenolic content (mg GAE/100 g DM) of yogurt samples during storage

Table 4 Long description
Total phenolic content is reported for yogurt samples A, B, and C across storage days 1, 7, 14, and 21, in mg GAE per 100 g dry matter. Sample A stays low overall, rising from 10.03 on day 1 to 19.15 on day 14, then falling to 11.83 on day 21. Sample B starts higher at 29.51 on day 1, peaks at 38.61 on day 7, then drops to about 10 on days 14 and 21. Sample C is highest at every time point, increasing from 41.53 on day 1 to a maximum of 83.25 on day 7, remaining high at 73.12 on day 14, then decreasing to 18.42 on day 21. Across samples, day 7 shows the strongest separation, with C much higher than B and A. Values include variability and letter codes indicating statistically significant differences among formulations and among storage days, so comparisons should follow those significance groupings rather than small numeric gaps.
Note: Values are expressed as mean ± standard deviation. Different uppercase letters indicate significant differences among treatments (P < 0.05), while different lowercase letters indicate significant differences among storage days (P < 0.05). A: (M1 + M2); B: (M1 + M2) + M3; C: (M1 + M2) + M3 + banana powder.
Viscosity
Viscosity values of the yogurt samples during storage are presented in Fig. 2. Viscosity reflects the resistance to flow and is a key physical parameter influencing texture, mouthfeel and consumer acceptance of yogurt. Across all storage times, the synbiotic formulation (sample C) consistently exhibited lower viscosity values than samples A and B (P < 0.05). This suggests that the presence of banana powder in sample C weakened the gel network or altered protein–polysaccharide interactions in a way that reduced overall consistency. In contrast, no consistent significant differences were observed between samples A and B, although the probiotic formulation (B) reached the highest viscosity at day 7. With respect to storage time, viscosity generally increased until day 14 in all samples and then showed a slight decrease by day 21. The final reduction was statistically significant in sample A (P < 0.05), but not in samples B and C (P > 0.05). The initial increase in viscosity during storage can be attributed to microstructural rearrangements within the yogurt gel. Continued slow acidification at low temperature promotes further aggregation of casein micelles and strengthens the acid gel network, leading to a firmer structure and higher viscosity (Akın and Akın, Reference Akın and Akın2016). At later stages, partial syneresis or relaxation of the gel matrix may account for the modest decrease in viscosity observed at day 21. These trends are consistent with previous studies showing that added plant ingredients can either increase or decrease yogurt viscosity depending on their composition, water-binding capacity and interaction with milk proteins. Özcan and Yıldız (Reference Özcan and Yıldız2016) reported that carrot puree increased, whereas zucchini puree decreased viscosity, highlighting the ingredient-dependent nature of texture modifications. In the present study, the lower viscosity of the banana-fortified synbiotic yogurt suggests a different mode of interaction with the protein network compared with the other formulations. Nevertheless, the viscosity values of all samples remained within a range considered acceptable for yogurt, indicating that textural quality was maintained throughout storage despite formulation differences. The lower viscosity observed in the synbiotic samples may be explained by a weakened gel network structure, resulting from altered protein–polysaccharide interactions and reduced structural cohesion.
Sensory evaluation
Samples were evaluated for appearance, texture, taste and aroma using a nine-point hedonic scale. For appearance, sample A received a score of 7, sample B scored 8 and sample C scored 6, with formulation B receiving the highest appearance score. A similar pattern was observed for texture, where A and B were rated 7 and 8, respectively, while C scored 6, with formulation B receiving the highest texture score. In terms of taste, samples A and B both received scores of 7, whereas sample C obtained a slightly lower score of 6. The slightly lower taste score for C may be due to the influence of banana powder on the characteristic sour flavour of yogurt. For aroma, A and B again achieved higher scores (8), while C received 6, suggesting that the added banana powder altered the characteristic yogurt aroma to some extent. Overall, all formulations were rated as acceptable and suitable for consumption. However, samples A and particularly B received higher sensory scores than sample C for appearance, texture, taste and aroma. The lower scores for sample C indicate that banana powder addition, while contributing functional and compositional benefits, also introduced subtle changes in colour and flavour that some panellists evaluated less favourably. Nonetheless, its sensory scores remained within an acceptable range, indicating that synbiotic yogurt containing banana powder can still be considered organoleptically acceptable. It should be noted that the sensory evaluation was performed with a small, trained panel, which provides indicative trends. However, it may not fully reflect consumer-level variability. These sensory data should therefore be interpreted as indicative trends rather than definitive consumer preferences. These sensory differences can be linked to the combined effects of increased acidity and structural modifications, which influence both flavour perception and textural attributes.
Integrated mechanistic interpretation
The observed changes in microbial viability and quality attributes can be interpreted through interconnected molecular and physicochemical mechanisms governing structure–function relationships in yogurt systems. In the synbiotic formulation, the presence of freeze-dried banana powder introduces banana-derived carbohydrates and phenolic compounds, which may contribute to microbial metabolism and the functional properties of the yogurt system. These components may support bacterial metabolism during cold storage and contribute to the maintenance of LAB viability under environmental stress conditions such as low temperature and increasing acidity (Gibson et al., Reference Gibson, Hutkins, Sanders, Prescott, Reimer, Salminen, Scott, Stanton, Swanson, Cani, Verbeke and Reid2017; Markowiak and Śliżewska, Reference Markowiak and Śliżewska2017).
At the same time, the continued metabolism of both lactose and banana-derived carbohydrates enhances organic acid production, leading to a greater extent of post-acidification. The resulting decrease in pH alters the physicochemical environment of the yogurt matrix by reducing electrostatic repulsion between casein micelles and promoting protein aggregation. These changes directly influence the microstructure of the gel network (Haque et al., Reference Haque, Richardson and Morris2001; Lucey, Reference Lucey2004).
From a structural perspective, the incorporation of banana-derived components modifies the protein–polysaccharide interactions within the yogurt matrix. Although dietary fibres are generally associated with improved water retention, their compatibility with the casein network is critical. In this context, plant-derived fibres may interfere with gel continuity, weakening the three-dimensional structure and reducing water-holding capacity, which leads to increased syneresis and decreased viscosity (Lucey, Reference Lucey2004; Aryana and Olson, Reference Aryana and Olson2017).
These structural and physicochemical changes are directly reflected in the functional and sensory properties of the product. Increased acidity and altered microstructure contribute to changes in texture, mouthfeel and flavour perception, which explains the slightly lower sensory scores of the synbiotic yogurt despite its functional profile. Furthermore, phenolic compounds from banana powder may interact with milk proteins through hydrogen bonding and hydrophobic interactions, affecting both antioxidant activity and structural properties (Jakobek, Reference Jakobek2015).
Overall, these findings highlight the importance of ingredient interactions and structure–function relationships in determining the final quality of synbiotic yogurt. While the addition of banana powder supports LAB viability and contributes to the functional properties, it simultaneously induces microstructural changes that affect rheological behaviour and sensory acceptance, underscoring the need for formulation optimisation. The statistical significance of the effects of formulation, storage duration and their interaction across the evaluated quality attributes is summarised in Supplementary Material Table S1. A limitation of this study is that it was conducted at laboratory scale using a single milk source and a limited sample size, which may restrict the generalisability of the findings.
Conclusion
The present study demonstrates that synbiotic formulation influences both LAB viability and the structural and physicochemical properties of yogurt during cold storage. Changes in LAB viability in the synbiotic formulation may be associated with the availability of fermentable substrates from freeze-dried banana powder, which could support microbial activity under refrigerated conditions. At the same time, enhanced metabolic activity led to increased post-acidification, which in turn modified the casein network and affected gel structure. These structural changes were associated with increased syneresis and reduced viscosity, indicating a weakening of the protein matrix. The interplay between ingredient composition, microbial activity and gel microstructure highlights the importance of structure–function relationships in determining final product quality. Although the synbiotic yogurt exhibited functional properties, particularly in terms of phenolic content and LAB viability, these benefits were accompanied by moderate declines in textural and sensory attributes. Therefore, future studies should focus on optimising formulation parameters to improve compatibility between plant-based prebiotics and dairy protein networks, thereby achieving a better balance between functional enhancement and physical stability.
Supplementary material
The supplementary material for this article can be found at https://doi.org/10.1017/S0022029926102623.
Acknowledgements
The authors gratefully acknowledge the financial support provided by the Scientific and Technological Research Council of Türkiye (TÜBİTAK) under the project number 124O676.