Introduction
Depression is one of the most significant mental disorders associated with later life. In Korea, approximately one-third of elderly individuals suffer from depressive symptoms (Korea Labor Institute, 2009), much more frequent compared to the longitudinal studies using similar survey methods. The prevalence of depressive symptoms were found to be 14.6% in the Health and Retirement Study (HRS), 17.6% in the English Longitudinal Study of Ageing (ELSA) (Zivin et al., Reference Zivin2010), and 10% in the Irish Longitudinal Study of Ageing (TILDA) (Barrett et al., Reference Barrett2011). Depression has a negative effect on physical health and may even result in suicide in extreme cases. The association between depression and suicide is well documented. Several meta-analyses have found that various depressive disorders, including major depressive disorders, depressive symptoms, and depressive episodes, are strongly associated with the risk of suicide (Harris and Barraclough, Reference Harris and Barraclough1997; Yoshimasu et al., Reference Yoshimasu, Kiyohara and Miyashita2008). A recent Organisation for Economic Co-operation and Development (OECD) report described that the age-standardized suicide rate among the elderly in South Korea was 72 per 100,000 population, which was more than three times higher than the OECD average of 22 (OECD, 2011). Thus, the prevention of depression, a major risk factor of suicide, is important to remove the stigma associated with the “Republic of Suicide.”
Depression in the elderly is often accompanied by cognitive impairments, such as dementia, and this may be referred to as pseudo-dementia (Kiloh, Reference Kiloh1961). Pseudo-dementia describes the clinical manifestation of cognitive issues that are similar to, but are not true, dementia and is primarily associated with geriatric depression (Kiloh, Reference Kiloh1961; Kang et al., Reference Kang2014). Additionally, meta-analytic research has identified a positive correlation between depression and dementia such that depression is a risk factor of dementia (Diniz et al., Reference Diniz, Butters, Albert, Dew and Reynolds2013). Therefore, the screening for and treatment of depression can lead to significant reductions in the socioeconomic costs related to dementia. In this regard, depression is not only a matter of mental health but of the overall health of individuals because it has a significant effect on physical health. Owing to the rapid aging of South Korean society, the proportion of elderly in this country will continue to increase. This phenomenon may result in greater social problems if not dealt with adequately. Therefore, identifying factors that affect depression in the elderly is crucial for the development of appropriate interventions.
The gender differences in the incidence and severity of depressive symptoms are well documented. For example, one study clearly concluded that women are more likely to be depressed than men (Nolen-Hoeksema et al., Reference Nolen–Hoeksema, Larson and Grayson1999). However, the factors that determine this difference vary from study to study and from population to population. For example, elderly South Korean women are unable to live independent lives against the historical background in which the patriarchal ideology of a patrilineal society prevails (Kang and Han, Reference Kang and Han2002). As a result, they do not have a high priority in the allocation of limited family resources in times of war and poverty (Kang and Han, Reference Kang and Han2002; Lee, Reference Lee2006). Because the effects of contemporary and cultural backgrounds impact the elderly differently according to gender, it is important to identify the factors that affect depression in accordance with gender.
Longitudinal studies are conducted to determine changes in phenomena over time. This type of study design can be used to empirically demonstrate a causal association. Despite the strengths of this design, there are difficulties associated with establishing appropriate criteria for the categorization of meaningful subgroups in terms of patterns of change. Group-based trajectory modeling (GBTM) could be a useful solution to this problem. This model determines inclusion in a subgroup by classifying individuals based on similar patterns of change in interesting variables among the target population (Nagin, Reference Nagin2005). A trajectory analysis exploratively determines the changing patterns of health status that actually exist. In this regard, it reflects the reality of health status in the elderly more accurately than other methods. Thus, the present study examined the various patterns in the trajectories of depressive symptoms that reflected personal characteristics using GBTM and aimed to identify the factors that influence these patterns according to gender.
Subjects and methods
Data
All data evaluated in the present study were obtained from the baseline (2006) through fourth wave (2012) surveys of the Korean Longitudinal Study of Ageing (KLoSA).This survey was designed to produce basic data needed to develop and implement effective social and economic policies that reflect the aging trends in South Korea. The basic survey was conducted biennially following the baseline survey (2006). The KLoSA population was composed of South Korean adults aged 45 years and older living in households that were selected using stratified multi-stage sampling in order to ensure national representativeness. The baseline survey (2006) included a total of 10,254 individuals who were interviewed using Computer-Assisted Personal Interviewing (CAPI). The second wave survey (2008) followed up 8,875 subjects (retention rate of the original population: 86.6%), the third wave survey (2010) followed up 8,229 subjects (retention rate of the original population: 80.3%), and the fourth wave survey (2012) followed up 7,813 subjects (retention rate of the original population: 76.2%).
Based on the research purposes of the present study, the subjects assessed here were limited to an older population; thus, subjects under the age of 60 (n = 4,706) who completed the baseline survey were excluded. Additionally, subjects who did not complete the interviews until the fourth wave due to loss to follow-up or death (n = 736), those who had taken antidepressants at least once (n = 93), and those with incomplete information related to depressive symptoms from at least one wave of the surveys (n = 1,052) were excluded from the analyses. In particular, the subjects using antidepressant skipped the question of Center for Epidemiological Studies Depression Scale (CES-D) according to the survey protocol of KLoSA. Thus, 3,667 individuals (1,566 men and 2,101 women) were ultimately included in the present analyses. This study was approved by the Institutional Review Board of Seoul National University (IRB No. E1608/003-007).
Variables
Depressive symptoms
Depressive symptoms were measured with the Korean version of the 10-item CES-D, a briefer version of the CES-D used worldwide. The CES-D was developed for epidemiological studies investigating depressive symptoms among the general population (Radloff, Reference Radloff1977). The CES-D 10 consists of 10 questions included in the original version: “I was bothered by things that usually don't bother me,” “I had trouble keeping my mind on what I was doing,” “I felt depressed,” “I felt that everything I did was an effort,” “I felt pretty good,” “I felt fearful,” “My sleep was restless,” “I was generally satisfied,” “I felt lonely,” and “I could not get going” (Irwin et al., Reference Irwin, Artin and Oxman1999). Each item was measured using a 4-point scale that reflects the severity of depressive symptoms in accordance with the frequency of each symptom during the past week: 0 (less than 1 day), 1 (1–2 days), 2 (3–4 days), and 3 (5–7 days).
In the present study, the responses were recoded as 0 (less than 1 day) and 1 (1 or more days); scores for positive questions such as “I felt pretty good” and “I was generally satisfied” were recorded in the reverse manner. The total sum of the 10 items was used as a dependent variable and higher scores indicated more severe depressive symptoms. The Cronbach's α coefficients for the CES-D 10 in each survey year were 0.80 (2006), 0.80 (2008), 0.82 (2010), and 0.85 (2012), which revealed similar or higher levels of internal consistency compared with a preceding study (0.80) (Irwin et al., Reference Irwin, Artin and Oxman1999).
Explanatory variables at baseline
To determine the variables that influenced the types of the trajectories of depressive symptoms, possible explanatory variables such as age, education, economic activity, household income, marital status, chronic diseases, pain, social activity, alumni meetings, self-rated health (SRH), disability, and quality of life (QoL) were assessed; these variables were identified in a previous meta-analysis (Kim and Sohn, Reference Kim and Sohn2005). Age was included as a continuous variable. The level of education was divided into two groups: middle school or lower and high school or higher. The subjects were also classified as employed or unemployed according to their current employment status. Annual household income during the past year was determined using an open-ended question and then categorized into quartiles, and marital status was categorized as married or single.
The subjects were also asked whether they had been diagnosed with a major chronic disease such as hypertension, diabetes, cancer, chronic pulmonary disease, liver disease, cardiac disease, cerebrovascular disease, and/or arthritis (degenerative or rheumatoid arthritis); people with one or more chronic diseases were classed as chronic disease patients. The subjects were asked whether they had pain in various parts of their body including the head, shoulders, arms, wrists, fingers, chest, abdomen, waist, hips, legs, knees, ankles, and/or toes; individuals with pain in one or more parts were included in the pain group. The subjects answered “Yes” (1) or “No” (0) to the questions about their social participation in various communities including social gatherings and school, hometown, or family reunions. SRH was measured on a 5-point scale (very bad, bad, fair, good, and very good) and the subjects were grouped into three categories: poor (1), fair (2), and good (3). Disability questions were only answered if the subject had been diagnosed with a disability by a doctor. QoL was assessed by asking the subjects whether they were satisfied with their overall QoL compared to others of the same age using a scale from 0 to 100; the scores were divided into deciles.
Statistical analysis
Non-weighted frequencies, means, and standard deviations (SDs) were calculated for the explanatory variables according to gender to examine the general characteristics of the study population. There were significant differences in the distributions of almost all of the variables according to gender and thus, the population was analyzed according to gender.
Various subsamples were analyzed using the GBTM, which was developed to cluster subjects who share similar trajectories over time in terms of the outcome variables (Nagin, Reference Nagin2005). From the perspective of the GBTM, the study population is a mixture of basic trajectory groups. This model can only be applied to longitudinal studies that repeatedly measure an individual at several time points; subsequently, the model can be used to calculate the probability that an individual belongs to a specific group (Nagin, Reference Nagin2005). In the GBTM, the model selection depends on the type of outcome variables used in the analysis and each individual is assigned to the trajectory group that shows the highest probability of membership. In the present study, the censored normal model was selected because it was considered more adequate for an ordinal psychometric scale (Jones et al., Reference Jones, Nagin and Roeder2001).
The PROC TRAJ procedure, an add-in module in the SAS program, was used to analyze the depressive symptoms in the subjects. The Bayesian information criteria (BIC) value was calculated and then compared to determine the optimal number of groups with the principle of parsimony (Nagin, Reference Nagin2005). After the optimal numbers were determined for men (4) and women (5), the weighted proportions, means, and SDs of the covariates were computed according to the trajectories of depressive symptoms to compare the differences among the trajectories. Finally, a multinomial analysis was conducted to investigate the associations between explanatory variables at baseline and the trajectories of depressive symptoms for both genders. All analyses were performed using SAS statistical software, version 9.4 (SAS Institute, Inc.; Cary, NC).
Results
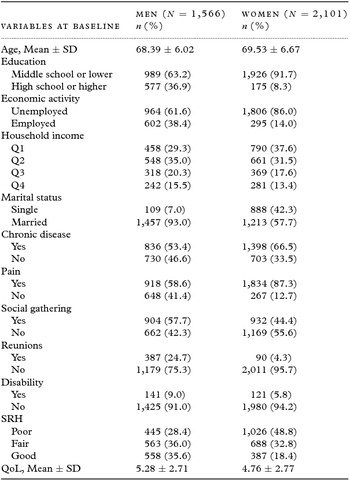
Table 1 presents the descriptive statistics of the study population according to gender; there were considerable differences based on gender for most variables. The mean age was higher in women (69.5 years) than in men (68.4 years). Women were more likely to have a lower level of education than men, such that the majority of women had a middle school education or lower. Approximately 75% of women were unemployed, whereas approximately 40% of men were employed. In addition, more than 90% of men retained a married status, while approximately 42% of women were single. Women also suffered more from pain than men, and 87% of women had one or more types of pain. Men appeared to be more active in terms of social participation, such as attending social gatherings and school/hometown/family reunions. The percentage of women with poor SRH was much higher than that of men, and, in particular, approximately 50% of women had poor SRH. Additionally, the average QoL appeared to be higher in men.
General characteristics of study populations (N = 3,667)

SD: Standard deviation, SRH: Self-rated Health, QoL: Quality of Life.
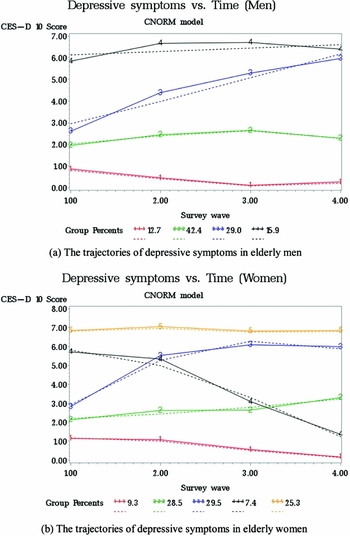
The different trajectories of depressive symptoms according to gender are presented in Figure 1; the scaled time represents the survey wave (1 = 2006, 2 = 2008, 3 = 2010, and 4 = 2012). Figure 1(a) illustrates the various trajectories of depressive symptoms in men, who were divided into four groups: normal (1), mild depressed (2), worsening (3), and depressed (4). Women exhibited the same pattern as men except that a distinctive group showed improvements in depressive symptoms; thus, the women were partitioned into five groups: normal (1), mild depressed (2), worsening (3), improving (4), and depressed (5; Figure 1(b)).
Trajplots indicate the changes of CES-D 10 score as index of depressive symptoms in both genders; (a) men and (b) women. The scaled time represents the survey wave (1 = 2006, 2 = 2008, 3 = 2010, and 4 = 2012).

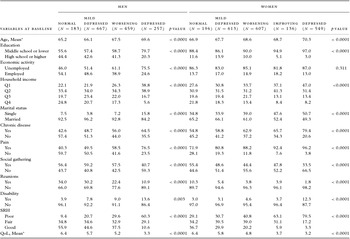
Table 2 details the statistically significant differences in almost every explanatory variable according to the trajectories of depressive symptoms. The characteristics according to the trajectory groups were similar in both genders. The depressed group was the oldest, had the highest percentage of a lower level of education, had a lower household incomes, and had a lower marriage rate than the other groups. The normal group had lower percentages of chronic disease, pain, and disability, higher percentages of social participation at social gatherings and reunions, and a higher proportion of subjects with good SRH. Conversely, the proportion of subjects with poor SRH was high in the depressed group.
Weighted proportions and mean of explanatory variables to the trajectories of depressive symptoms according to gender by χ2 test and GLM

SRH: Self-rated Health, QoL: Quality of Life.
* Weighted mean was analyzed by GLM.
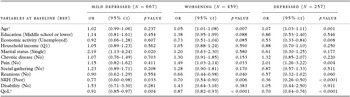
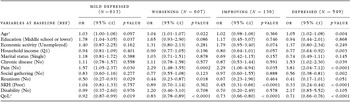
Tables 3 and 4 provide the odds ratios (OR) used to determine differences in the explanatory variables across trajectories according to gender. Elderly men who were unmarried (OR = 2.19), had poor SRH (OR = 0.77), and/or had lower QoL (OR = 0.91) were more likely to be in the mild depressed group than in the normal group. Men in the worsening group were more likely to be older (OR = 1.05), suffer from pain (OR = 1.49), be absent from various reunions (OR = 0.66), had poor SRH (OR = 0.70), and/or had lower QoL (OR = 0.87) than men in the normal group. A comparison of the normal and depressed groups revealed that older age (OR = 1.07), unemployment (OR = 0.53), pain (OR = 2.01), poor SRH (OR = 0.36), and/or lower QoL (OR = 0.70) increased the likelihood of elderly men being in the depressed group (Table 3).
Weighted odds ratios of explanatory variables to the trajectories of depressive symptoms in the elderly men by multinomial logistic regression

OR: Odds ratio, CI: Confidence interval, REF: Reference group, SRH: Self-rated Health, QoL: Quality of life.
* Age and QoL were included as continuous variable.
Weighted odds ratios of explanatory variables to the trajectories of depressive symptoms in the elderly women by multinomial logistic regression

OR: Odds ratio, CI: Confidence interval, REF: Reference group, SRH: Self-rated Health, QoL: Quality of Life.
* Age and QoL were included as continuous variable.
Elderly women with a higher level of education (OR = 1.78), pain (OR = 1.57), non-attendance at reunions (OR = 0.50), and/or lower QoL (OR = 0.92) were more likely to be included in the mild depressed group than in the normal group. Women in the worsening group were more likely to be older (OR = 1.04), have pain (OR = 2.29), be absent from reunions (OR = 0.44), and/or have lower QoL (OR = 0.83) than women in the normal group. A comparison of the normal group and the improving group revealed that pain (OR = 2.29), poor SRH (OR = 0.45), and/or lower QoL (OR = 0.73) were related to inclusion in the improving group. In the comparison between the normal and the depressed groups, older age (OR = 1.05), lower household income (OR = 0.77), chronic diseases (OR = 1.53), pain (OR = 3.81), non-attendance at social gatherings (OR = 0.56), poor SRH (OR = 0.33), and/or lower QoL (OR = 0.71) increased the likelihood of being in the depressed group (Table 4). Furthermore, compared to the improving and depressed groups, physical health without chronic disease (OR = 0.57), disability (OR = 0.32), and/or attendance at social gatherings (OR = 1.73) were related to improvements in symptoms (Table SA).
Discussion
The primary purposes of the present study were to investigate various changes in the trajectories of depressive symptoms over time and to determine the factors related to these changes. A GBTM was employed to achieve these purposes and the different trajectories were assessed according to gender. In the case of the elderly men, four types of trajectories were identified and were relatively constant or gradually increased. In contrast, five types of trajectories were identified in women with an additional improved group. After confirming the trajectories of depressive symptoms, the relevant factors that influenced membership in each trajectory were determined. For men, the common risk factors of having depressive symptoms were poor SRH, lower QoL, and pain. Additionally, economic activity had a preventive effect when compared to the normal and depressed groups. In the case of elderly women, physical pain, and lower QoL were the common risk factors related to depressive symptoms while chronic diseases, poor SRH, and a lower economic status were associated with depressive symptoms for some groups. Moreover, social participation, such as attending social gatherings or reunions, had a preventive effect against depressive symptoms in women.
Previous studies have shown that physical health status is associated with mental health problems such as depressive symptoms, and that chronic diseases and functional limitations increase the risk of depressive symptoms (Berkman et al., Reference Berkman1986; Kennedy et al., Reference Kennedy, Kelman and Thomas1990). Although the specific variables related to physical health status identified in the present study were not identical to those observed in preceding studies, the present results corresponded well with those of previous studies (Berkman et al., Reference Berkman1986; Kennedy et al., Reference Kennedy, Kelman and Thomas1990). SRH status (perceived health status) has been associated with depressive symptoms such that a poor SRH aggravates depressive symptoms and, in this respect, the present findings were consistent with those of previous studies (Beekman et al., Reference Beekman, Deeg, van Tilburg, Smit, Hooijer and van Tilburg1995; Minicuci et al., Reference Minicuci, Maggi, Pavan, Enzi and Crepaldi2002). In the present study, individuals with pain were more likely to be depressed as observed in earlier studies which indicated that pain was a prominent risk factor of depressive symptoms (Arola et al., Reference Arola, Nicholls, Mallen and Thomas2010; Novick et al., Reference Novick, Montgomery, Bertsch, Peng, Brugnoli and Haro2015). Based on these findings, it is possible that the management of chronic somatic diseases is an important factor in the prevention of depressive symptoms. This is important because later life is a period associated with the multi-morbidity of chronic somatic diseases and prevention is more cost-effective than treatment regarding chronic diseases.
In the present study, QoL was assessed as a variable of life satisfaction and was significantly associated with depressive symptoms in almost every group, which is consistent with the findings of a previous study (Goldney et al., Reference Goldney, Fisher, Wilson and Cheok2000). Even though the present results suggested a causal relationship between QoL at baseline and subsequent worsening of depressive symptoms, depression was also a risk factor for lower QoL, and depressed patients tended to underestimate their own QoL (Pyne et al., Reference Pyne, Patterson, Kaplan and Ho1997). Therefore, it is important to break the vicious cycle that exists between lower QoL and depressive symptoms. This will likely require comprehensive care because QoL encompasses the physical, mental, and socioeconomic statuses of individuals.
Gender differences were identified in the shapes of the trajectories of depressive symptoms and in the associations between depressive symptoms and related factors in the present study. The group improved in depressive symptoms was included only in the elderly women. The variables that were protective against depressive symptoms differed according to gender in the normal and depressed groups, more specifically, employment for men and social participation for women. The finding that employment in men was protective against depressive symptoms agrees with a previous study (Blay et al., Reference Blay, Andreoli, Fillenbaum and Gastal2007), but contrasts with the findings of several previous studies that did not find any relationship between employment and depressive symptoms (Lorant et al., Reference Lorant, Croux, Weich, Deliège, Mackenbach and Ansseau2007; Barcelos-Ferreira et al., Reference Barcelos-Ferreira, Pinto, Nakano, Steffens, Litvoc and Bottino2009). Only a few studies have investigated the relationship between employment and depressive symptoms among the elderly. It may be inappropriate to use employment as a socioeconomic variable when investigating elderly populations because it is more likely that these individuals are retired as they have reached a later stage of life. Nonetheless, it is important to focus on the effects of employment in South Korea. The employment rate among the elderly in South Korea has reached 30% (Statistics Korea, 2016) and the number of older workers will likely further increase in the near future due to the rapid aging of the population. However, employment itself, while increasing household income, may be a factor related to decreases in physical health because most jobs available to elderly individuals require manual labor. Therefore, employment policies that reflect the characteristics of the elderly in terms of health promotion, including the improvement of depressive symptoms, are needed because employment can mitigate the adverse effects of a lower socioeconomic status in terms of health.
The present study also showed that social participation, such as participating in social gatherings and reunions, had a beneficial effect on depressive symptoms in women. In the comparison of the improving and depressed groups in which the CES-D 10 scores were high at baseline, similar results were observed; these findings are in close agreement with those of a previous study (Chiao et al., Reference Chiao, Weng and Botticello2011). It is presumed that a lower employment rate means fewer opportunities to meet someone new and, therefore, social gatherings or reunions may be the only way that elderly women can interact with others. Regardless of gender, several longitudinal studies had demonstrated the beneficial effects of social participation on depression according to a systematic review (Schwarzbach et al., Reference Schwarzbach, Luppa, Forstmeier, König and Riedel‐Heller2014). For example, a greater degree of social participation is more likely to result in social support and/or more access to social ties, which can improve depressive symptoms. Therefore, there may be a need for more facilities at which elderly individuals can meet and communicate with others.
The present study differed from previous studies in terms of study design and analytical methods. Most prospective studies investigating the risk factors of depression in the elderly have been conducted in Western developed countries such as the US, UK, and the Netherlands (Cole and Dendukuri, Reference Cole and Dendukuri2003). The present study observed a causal relationship between depressive symptoms and their risk factors using longitudinal data relevant to the social and cultural contexts of South Korea. The study subjects were typically divided into normal and depressed groups using a cut-off value of the CES-D score in recent studies (Richard et al., Reference Richard2013; Olvera et al., Reference Olvera, Fisher–Hoch, Williamson, Vatcheva and McCormick2016). However, understanding the changing patterns of individual depressive symptoms in greater detail can provide important information beyond classifying individuals into two groups, normal or depressed.
The present findings have several policy implications; the different trajectories related to depressive symptoms may require different interventions to improve the symptoms. First, there was a distinct group among women that initially had a high CES-D score but exhibited a gradual improvement in symptoms. This group was characterized by greater degrees of physical health and social participation relative to the depressed group, which had a similar starting score. Therefore, it will be important to provide a place for the elderly to communicate with one another and the health promotion policy to reduce depressive symptoms. Second, the elderly population can be divided into normal and depressed groups at any given time. Each group, however, may consist of a mixture of various trajectory groups. Because each group is heterogeneous, personalized interventions that reflect individual characteristics may be more effective. Finally, economic stability is important to mitigate depressive symptoms but different approaches are needed according to gender. These policy implications constitute the greatest advantage of using this trajectory analysis.
Despite the significance of the present study, there are several limitations that should be considered. First, the follow-up period was slightly shorter than those of studies conducted in Western countries because the KLoSA panel surveys only began recently. However, meaningful results were found in the existing data and the findings are expected to become more relevant as more data are accumulated. Second, participants who died or failed to complete the survey were excluded from the present analyses and these individuals may have been more depressed than the living participants. Furthermore, a certain trajectory group might have been formed on the basis of the specific profile of the deceased participants and the exclusion of these participants may have caused this group to disappear. However, this possibility is considered to be unlikely and it is more feasible that the deceased participants were distributed to each group. In this case, the percentage of each trajectory group may change due to the exclusion of the deceased participants but it is expected that there will not be a significant impact on the overall patterns. Additionally, the purposes of the present study include determining the degree of healthcare burden caused by depressive symptoms and providing policy suggestions to improve this burden by identifying the trajectories and risk factors of depressive symptoms. For these reasons, living participants are a target population that more closely match this purpose of the present study. Third, although the Geriatric Depression Scale (GDS) is more frequently used for elderly populations, the CES-D 10 was used to measure depressive symptoms among the elderly in the present study. The use of this measure is supported by previous findings showing that the CES-D can be applied to the elderly because it is not influenced by age (Radloff and Teri, Reference Radloff and Teri1986). Even though only elderly participants aged 60 years or older were included in the present study, the KLoSA assessed adults over 45 years of age. Therefore, it was preferable to use a general method like the CES-D 10.
In conclusion, the present study demonstrated that there are gender differences in the trajectory of depressive symptoms and its associated risk factors. More specifically, the maintenance of a healthy body was important to reduce the risk of depressive symptoms in both genders, employment was a critical factor to improve depressive symptoms in older men, and social participation was protective against depressive symptoms in older women. The findings of the present study also indicated that job creation reflecting the physical and mental conditions of the elderly is needed and that policies to promote social participation of the elderly is important. Therefore, the elderly should be provided with comprehensive services that protect their mental health.
Conflict of interest declaration
None.
Description of authors’ roles
J. Lee conceived of the study concept, performed data analysis, and wrote the paper. S. Cho supervised the data analysis and writing the paper, and revised the paper for submission. S. Jang contributed to writing and revising the paper.
Supplementary material
To view supplementary material for this article, please visit http://doi.org/10.1017/S1041610217000709
Acknowledgments
This work was supported by the National Research Foundation of Korea Grant funded by the Korean Government (No. 21B20151213037).