I. Introduction
As many investors in the United States use financial advisers for their investment decisions (Gurun, Stoffman, and Yonker (Reference Gurun, Stoffman and Yonker2021)), the financial advisory industry manages $145 trillion in assets (Investment Adviser Association (2025)). The clients of this industry are sensitive to shocks in trust (Gurun, Stoffman, and Yonker (Reference Gurun, Stoffman and Yonker2018)), making the adviser’s reputation especially important. However, instances of misconduct among financial advisers, several of which receive considerable media attention, challenge their reputation. While the literature focuses extensively on the factors that influence adviser misconduct,Footnote 1 90% of financial advisers have no history of any disciplinary events. In this article, we establish that honest advisers with no history of misconduct are more likely to leave a firm following a rise in its misconduct occurrences, leading to consequential market implications on the matching dynamics between firms and advisers based on tolerance for misconduct.
The financial advisory industry includes firms that tolerate misconduct, which employ a relatively high percentage of advisers with a history of such behavior. Egan et al. (Reference Egan, Matvos and Seru2019) attribute this misconduct specialization to demand-side factors in the labor market, arguing that these firms maximize profitability by targeting financially unsophisticated investors. However, advisers themselves hold substantial market power because a significant portion of managed assets follows them when they switch firms (Gurun et al. (Reference Gurun, Stoffman and Yonker2021)). Therefore, to better understand the matching between firms and advisers in the presence of misconduct, it is necessary to consider advisers’ decisions in the advisory labor market. We examine this question in this article.
We find that honest advisers are more likely to leave the firm following a rise in misconduct cases and transition to firms that are less tolerant of misconduct. As reputation and trust are central in this industry, honest advisers seek to maintain their clean records and protect future cash flows; thus, they prefer to distance themselves from misbehaviors caused by others. These individual decisions aggregate at the market level, shaping the matching dynamics between firms and advisers based on tolerance for misconduct. Honest advisers exhibit a stronger preference for firms that are less tolerant of misconduct, leaving more tolerant firms with a smaller pool of honest advisers. This mechanism helps explain why some firms have a higher proportion of employees with a history of misconduct, beyond the demand-side explanation introduced by Egan et al. (Reference Egan, Matvos and Seru2019).
To study the impact of within-firm misconduct occurrences on honest advisers and the market implications, we analyze the U.S. financial advisers market between 2004 and 2019. We find that an honest adviser has a 14.6% higher probability of leaving a firm following a 1-standard-deviation rise in the share of within-firm misconduct instances in the previous year, compared to a dishonest one (relative to the sample mean). Additionally, more severe instances of misconduct increase the likelihood that honest advisers will leave their firms.
Unlike dishonest advisers, who are mostly hired by firms that tolerate misbehavior (Egan et al. (Reference Egan, Matvos and Seru2019)), honest advisers are not constrained to a specific firm type and have much greater freedom of choice. This enables us to observe individuals’ choices and gain deeper insights into the factors that influence their decision-making when selecting a firm to join. We find that honest advisers transition to firms with statistically and economically lower level of misconduct than their prior employers. Relative to other firm characteristics, a firm’s tolerance for misconduct is the primary determinant of firm choice following departure from high-misconduct firms.
The honest adviser’s choice aggregates to the market level, with important implications for the matching dynamics between firms and advisers based on tolerance for misconduct. A 1-standard-deviation increase in the share of honest advisers leaving following within-firm misconduct in a county is associated with a 6.9% increase in the share of dishonest advisers hired by tolerant firms out of the total number of advisers operating in that county (relative to the sample mean). The effect also holds in counties with more unsophisticated clients, who are more vulnerable to misconduct, suggesting broader welfare consequences.
Reputation, as it reflects public perception, is inherently difficult to measure. To establish this mechanism, we provide evidence that increases in firm misconduct frequency heighten reputational concerns, thereby increasing the likelihood that advisers leave the firm. First, client awareness of the misconduct is essential to our story. Otherwise, reputational concerns may be muted. To estimate the degree of awareness of the misconduct, we examine the effect of misconduct occurring within the firm-county. Closer misconduct instances are more likely to be spread in the local community and amplify the adviser’s reputational concerns. We find that an honest adviser has a 21.5% higher propensity of leaving a firm following a 1-standard-deviation rise in the misconduct rate in the firm-county, compared to a dishonest one (relative to the sample mean). The effect is about 50% larger than that of the firm-level misconduct rate. We also find that proximity matters: within-firm misconduct cases that are closer geographically increase adviser departures, with a 1-standard-deviation decrease in geographic distance (measured in miles) associated with a 5.1% higher likelihood that honest advisers leave the firm. Additionally, we show that honest advisers are more likely to leave their firms following a larger share of within-firm misconduct cases involving senior employees or cases covered by the media.
Next, the sensitivity to misbehavior serves as an additional layer affecting honest advisers’ reputational concerns. Greater local sensitivity amplifies the reputational cost of staying with a tainted firm, thereby increasing the likelihood that advisers will leave the firm. To examine this dimension, we show that advisers serving more sophisticated clients, who are more sensitive to firm misconduct, are more likely to leave, as they face higher reputational risk. Additionally, we utilize Broker Protocol adoption to analyze the effect of reputational threats on future cash flows, as roughly 40% of client assets follow the adviser (Gurun et al. (Reference Gurun, Stoffman and Yonker2021)). Broker Protocol facilitates adviser mobility and client retention across firms without fear of litigation. We find that once a firm joins the Protocol, honest advisers are 6.3% more likely to leave following a 1-standard-deviation rise in firm-county misconduct frequency, relative to the mean.
Our findings may raise the concern that observed adviser departures reflect firm-initiated responses to misconduct rather than reputational concerns. For example, instances of misconduct may be symptomatic of broader organizational issues that prompt the firm to restructure, revise internal policies, or conduct layoffs, any of which could drive adviser turnover. Alternatively, adviser departures may be influenced by time-varying, firm-county specific factors such as local economic or demographic shifts, regulatory changes, or fluctuations in enforcement intensity, each of which can be particularly salient in a heavily regulated industry like financial advising. Another possibility is that adviser mobility is externally initiated: firms with stronger compliance cultures may proactively recruit honest advisers from firms experiencing reputational issues. While these alternative explanations are plausible, we show that they are unlikely to be the main drivers of the results.
Finally, various unobservable factors, such as changes in personal circumstances (e.g., family-related decisions) or the fact that advisers were already seeking new employment opportunities, could also influence the decision and timing to switch firms. As such factors are inherently difficult to measure, we strengthen the causal interpretation of our findings by verifying that the results hold in a Difference-in-Differences analysis.
Our article contributes to several strands of literature. First, we extend the work of Egan et al. (Reference Egan, Matvos and Seru2019) by introducing an additional dimension to the understanding of misconduct in the financial advisory labor market. We show that honest advisers respond to misconduct within their firms by taking actions to protect their reputations. These reputational spillovers help explain why some firms employ significantly higher proportions of honest advisers than others, highlighting the role of adviser self-selection in shaping firm composition over time.
Our article also contributes to the literature on adviser misconduct by focusing on the largest segment of the adviser population, the honest ones. While most existing research has concentrated on identifying the drivers of misconduct (see footnote 1 for the main literature), we examine how misconduct affects those who have not engaged in it. Specifically, we show that instances of firm-level misconduct can prompt honest advisers to leave their current firms and relocate to firms with fewer reported misconduct cases. This broadens the understanding of misconduct’s organizational consequences, highlighting reputational spillover effects even among those not directly involved.
Further, this article contributes to the labor finance literature by identifying a novel driver of employee-firm separation. The matching between firms and workers is shaped by a variety of factors, including wages (Abowd, Kramarz, and Margolis (Reference Abowd, Kramarz and Margolis1999)), labor market frictions and imperfect competition (Lamadon, Mogstad, and Setzler (Reference Lamadon, Mogstad and Setzler2022)), and firm-level financial conditions such as leverage (Matsa (Reference Matsa2018)) or financial distress (Baghai, Silva, Thell, and Vig (Reference Baghai, Silva, Thell and Vig2021)). We add to this literature by isolating a previously unexamined reason for employees’ decisions to transition to another firm: the desire of honest employees to protect their reputations by distancing themselves from firms tainted by internal misconduct. To our knowledge, this reputational avoidance mechanism has not been documented before. Our findings are relevant not only in financial advising but also in professions where reputational capital matters, such as medicine and academia.
This article proceeds as follows: Section II outlines our data and main variables. In Section III, we examine the influence of the firm’s misconduct incidents on the adviser’s propensity to leave the firm. Section IV describes the reputational concerns as the mechanism that drives honest advisers to leave. Section V analyzes the firms that honest advisers move to and the resulting implications for the matching dynamics between firms and advisers based on their tolerance for misconduct. Section VI addresses alternative explanations, and Section VII presents the main conclusions.
II. Data and Main Variables
A. Sample Construction and Main Variables
Our data set contains a panel of individual U.S. financial advisers from 2004 to 2019. It is constructed from publicly available data from FINRA’s BrokerCheck website for brokers and the SEC’s Investment Adviser Public Disclosure (IAPD®) website for investment advisers.Footnote 2 The data set includes detailed annual information on each financial adviser’s employment history in the industry and the disclosure history of any disciplinary events. It covers over 35,000 firms with more than 11 million adviser-year observations.
To classify individual advisers’ misconduct, disclosed by financial advisory firms as required by FINRA, we follow the methodology of Egan et al. (Reference Egan, Matvos and Seru2019). For each adviser, we construct a dummy variable equal to 1 if the adviser has a disciplinary record in a given year.Footnote 3 Another dummy variable indicates whether the adviser was reprimanded for misconduct as of that year. Misconduct is defined as having a record in at least one of the following six categories: Customer Dispute–Settled, Regulatory–Final, Employment Separation After Allegations, Customer Dispute–Award/Judgment, Criminal–Final Disposition, and Civil–Final.
Our main explanatory variable is the interaction term between the firm’s misconduct frequency, estimated as the share of the annual misconduct occurrences out of the number of advisers employed in the firm that year, and the honest adviser indicator, set to 1 if the adviser has no history of misconduct as of that year. The firm’s misconduct frequency measure is designed to capture reputational damage by scaling the number of misconduct incidents by the firm’s workforce size.
B. Summary Statistics
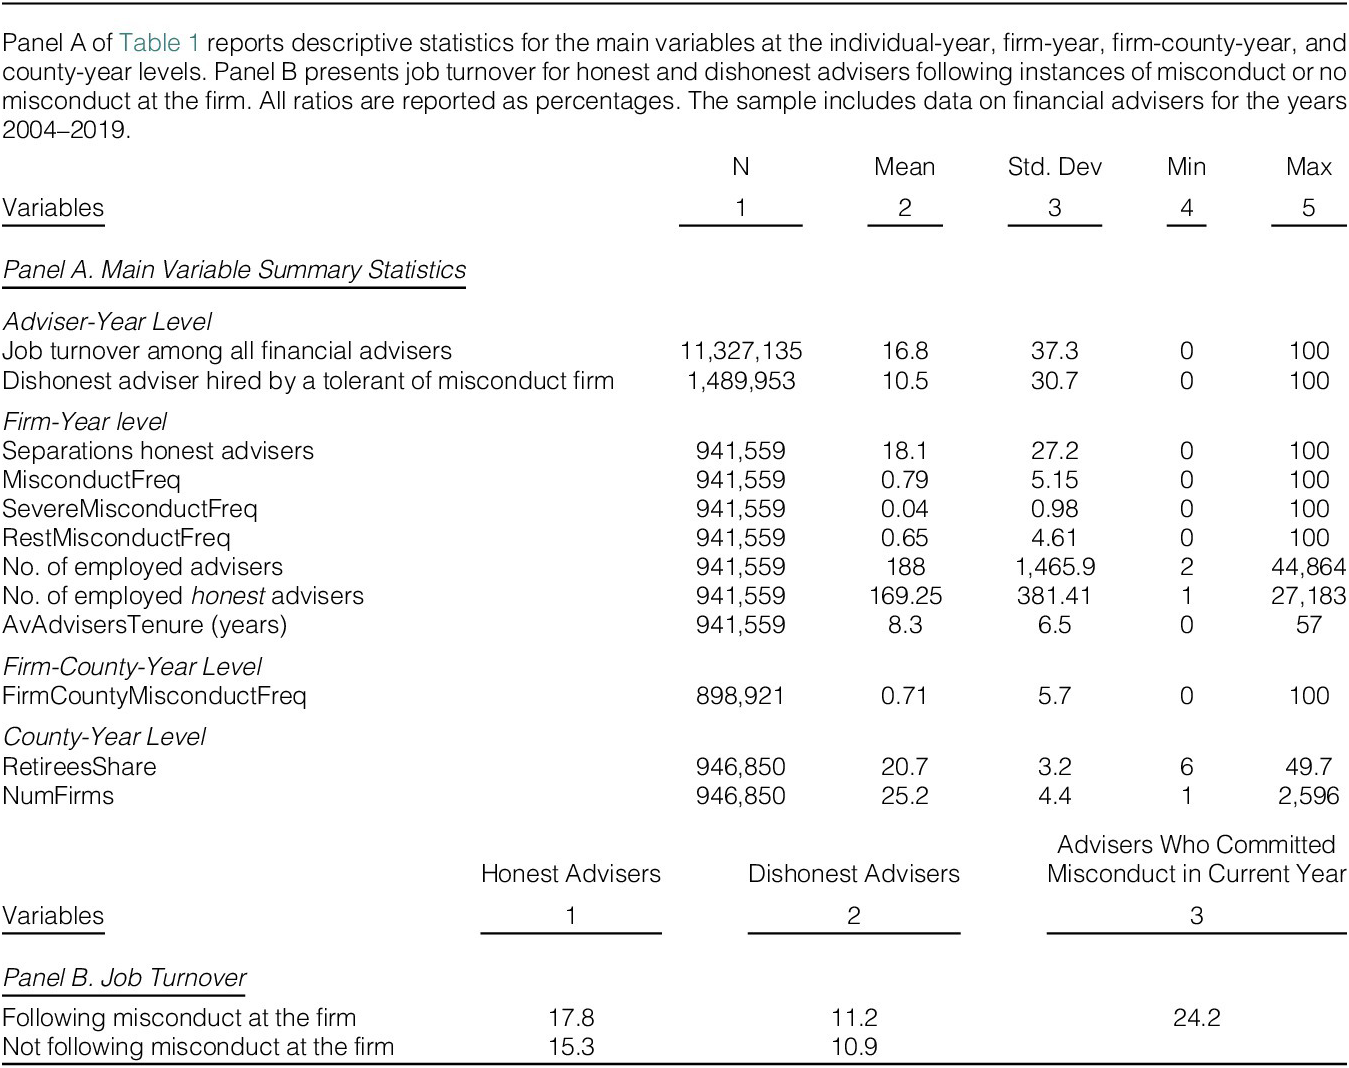
Panel A of Table 1 presents the summary statistics of our main variables. All ratios are presented as percentages. Almost 17% of the sample’s advisers leave firms each year. Delving deeper, Panel B presents the job turnover for honest and dishonest advisers following instances of misconduct at the firm. Table 1 shows that honest advisers leave firms more often following misconduct. Honest advisers are 16.3% more likely (0.178–0.153) to leave after misconduct, while dishonest advisers barely respond to misconduct instances. These turnover figures are significantly lower relative to advisers who committed misconduct in year t, as dishonest advisers are more likely to be fired after committing misconduct (consistent with Egan et al. (Reference Egan, Matvos and Seru2019)). Overall, honest advisers have higher turnover than their counterparts who have engaged in misconduct because unlike dishonest advisers, who are mostly hired by firms that tolerate misbehavior (Egan et al. (Reference Egan, Matvos and Seru2019)), honest advisers are not constrained to a specific firm type and have much greater freedom of choice in the firm they work for.

TABLE 1 Long description
Panel A: Descriptive Statistics.
* Adviser-year level: Job turnover among all financial advisers (N = 11,327,135, Mean = 16.8, Std. Dev = 37.3). Dishonest adviser hired by a tolerant of misconduct firm (N = 1,489,953, Mean = 10.5, Std. Dev = 30.7).
* Firm-year level (N = 941,559): Separations honest advisers (Mean = 18.1, Std. Dev = 27.2). Misconduct Freq (Mean = 0.79, Std. Dev = 5.15). Severe Misconduct Freq (Mean = 0.04, Std. Dev = 0.98). Rest Misconduct Freq (Mean = 0.65, Std. Dev = 4.61). No. of employed advisers (Mean = 188, Std. Dev = 1,465.9). No. of employed honest advisers (Mean = 169.25, Std. Dev = 381.41). Av Advisers Tenure in years (Mean = 8.3, Std. Dev = 6.5).
* Firm-county-year level: Firm County Misconduct Freq (N = 898,921, Mean = 0.71, Std. Dev = 5.7).
* County-year level (N = 946,850): Retirees Share (Mean = 20.7, Std. Dev = 3.2). Num Firms (Mean = 25.2, Std. Dev = 4.4).
Panel B: Job Turnover (Mean percentages).
* Following misconduct at the firm: Honest Advisers = 17.8, Dishonest Advisers = 11.2, Advisers Who Committed Misconduct in Current Year = 24.2.
* Not following misconduct at the firm: Honest Advisers = 15.3, Dishonest Advisers = 10.9.
Analyzing misconduct frequency at the firm level, the annual share is 0.8% with a high inter-firm heterogeneity. Following Egan et al. (Reference Egan, Matvos and Seru2019), we split the misconduct instances into more and less severe groups, with criminal or civil misconduct classified as the more severe category. The frequency of severe misconduct occurrences is about 5% of the total misconduct instances at the firm level, while the other four categories account for the rest of the cases. It should be noted that all six are already fairly strict definitions of misconduct, while other instances of misbehavior are not included in our analysis. At the firm-county level, the annual misconduct frequency is 0.71% with large variation across counties.
The definitions of the variables used in our analysis are reported in the Appendix.
III. The Effect of Misconduct on the Propensity of Honest Advisers to Leave
The analysis begins by investigating the influence of the firm’s misconduct occurrences on the adviser’s propensity to leave the firm using the following adviser-level empirical specification:

where:
Leavei,f,c,t = 1 if adviser i leaves firm f, in county c, in year t, and 0 otherwise.
MisconductFreq f,t – 1 = number of misconduct occurrences at firm f in year t – 1 scaled by the number of advisers employed by firm f in year t – 1.
Honesti,t – 1 = 1 if adviser i has no prior disciplinary events as of year t – 1, and 0 otherwise.
NumFirmsc,t – 1 = number of firms operating in county c in year t – 1.
αi, αf, αc, and αt are adviser, firm, county, and year fixed effects, respectively.
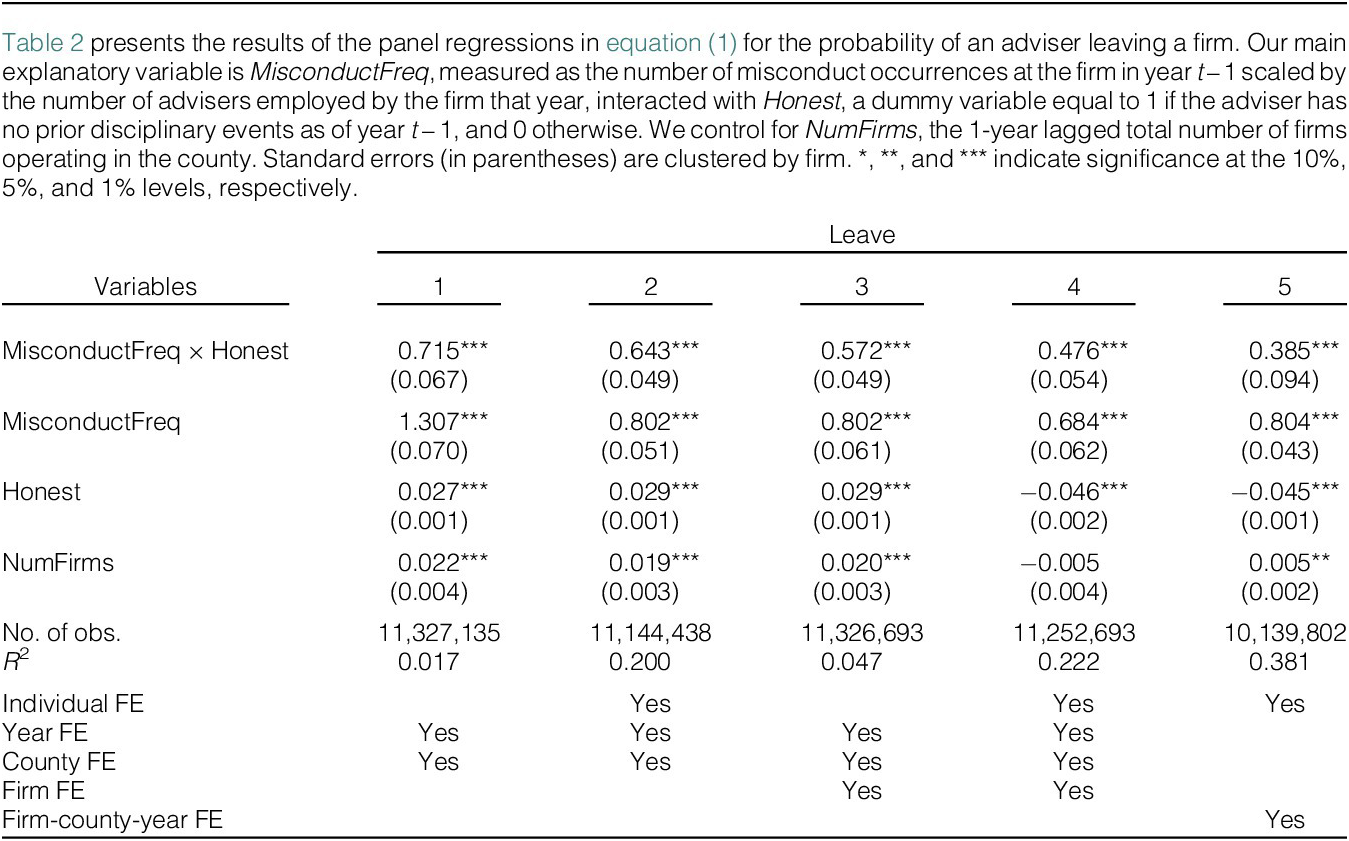
To address our research question of whether honest advisers leave their firms following an increase in within-firm misconduct occurrences, the primary source of variation in our setting is the firm’s misconduct cases. The extensive set of fixed effects aimed at identifying the effect while controlling for time-invariant characteristics related to the adviser, firm, county, and year.Footnote 4 Table 2 presents the results of this specification. Column 1 includes only time and county fixed effects. In column 2, we add adviser fixed effects, in column 3, we add firm fixed effects, and in column 4, we add both adviser and firm fixed effects. In column 5, we include a more rigorous set of fixed effects—adviser and firm-county-time fixed effects—to capture the influence of within-firm misconduct on the honest adviser’s decision to leave beyond local or time-variant variation. This variation could stem from changes in specific local economic or demographic conditions, changes in the firm (related or unrelated to misconduct), or regulation and enforcement changes, each of which can be particularly relevant in a heavily regulated industry like financial advising.

TABLE 2 Long description
A table with five columns representing different regression models for the dependent variable Leave.
Variables and coefficients (standard errors in parentheses):
* MisconductFreq times Honest: Values range from 0.715 (0.067) in Model 1 to 0.385 (0.094) in Model 5. All are significant at the 1 percent level.
* MisconductFreq: Values range from 1.307 (0.070) in Model 1 to 0.804 (0.043) in Model 5. All are significant at the 1 percent level.
* Honest: Values are 0.027 (0.001) in Model 1, 0.029 (0.001) in Models 2 and 3, minus 0.046 (0.002) in Model 4, and minus 0.045 (0.001) in Model 5. All are significant at the 1 percent level.
* NumFirms: Values range from 0.022 (0.004) in Model 1 to 0.005 (0.002) in Model 5. Model 4 is not significant.
Summary Statistics:
* Number of observations: Approximately 11.3 million for Models 1 through 4, and 10.1 million for Model 5.
* R-squared: Increases from 0.017 in Model 1 to 0.381 in Model 5.
Fixed Effects (F E):
* Individual F E: Included in Models 2, 4, and 5.
* Year F E: Included in Models 1, 2, 3, and 4.
* County F E: Included in Models 1, 2, 3, and 4.
* Firm F E: Included in Models 3 and 4.
* Firm-county-year F E: Included only in Model 5.
In all columns, we find a positive, statistically significant coefficient for our main explanatory variable (the interaction term between the firm’s misconduct occurrences and the honest adviser indicator). The magnitudes are also similar across the different specifications, indicating that the results are not driven by a specific set of fixed effects. Columns 4 and 5 show that an honest adviser has a 11.8%–14.6% higher probability of leaving a firm following a 1-standard-deviation rise in within-firm misconduct frequency in the previous year, compared to a dishonest one (relative to the sample mean).Footnote 5 In Appendix A2 of the Supplementary Material, we demonstrate that decisions at the individual level have meaningful aggregate effects at the firm level. The results show that in firms with at least one misconduct occurrence, the share of honest adviser departures increases by 6% relative to the sample mean.
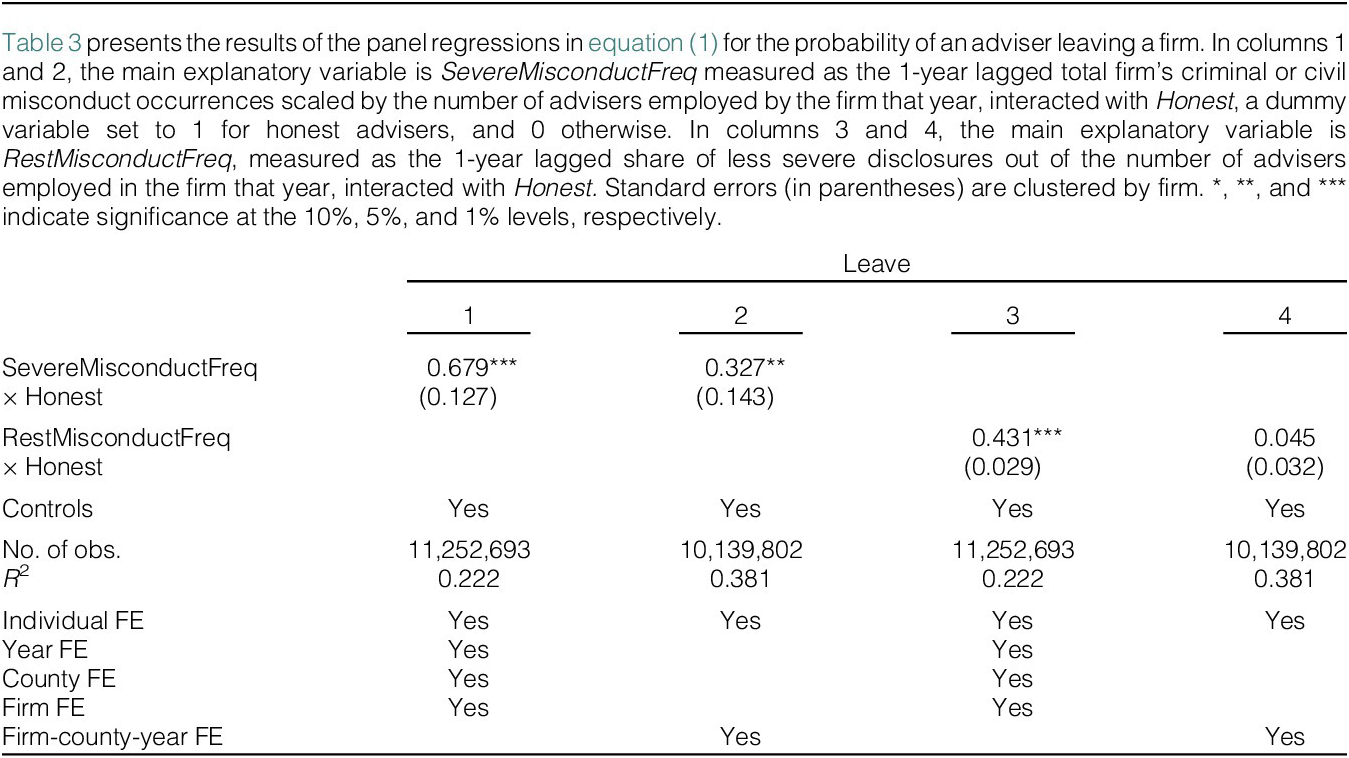
Next, we expand the analysis to examine how the severity of misbehavior affects the honest adviser’s decision to leave. To do so, we rerun the specification from equation (1), as in columns 4 and 5 of Table 2, replacing the firm misconduct measure with the share of only the more severe cases, as classified in Section II.A. As previously, we interact this variable with the Honest indicator. We find positive, statistically significant coefficients in columns 1 and 2 of Table 3 for the frequency of severe instances per employee in the firm that year. The normalized magnitudes are larger than those in the specifications in columns 4 and 5 of Table 2. This shows that the severity of misconduct meaningfully affects the honest adviser’s decision to leave the firm, with more severe instances resulting in greater turnovers. In this context, we also replace our explanatory variable for firm misconduct with the share of less severe disclosures (as defined in Section II.A) out of the number of advisers employed in the firm that year. Columns 3 and 4 in Table 3 present the results of this specification, in which we interact this variable with the Honest indicator. The normalized magnitudes here are lower than the ones in the baseline specification in columns 4 and 5 of Table 2. These results provide additional support for the idea that more severe cases have a stronger effect on the likelihood that honest advisers leave their firms.

TABLE 3 Long description
The table contains four columns of panel regression results for the dependent variable Leave.
Column 1 and 2 focus on Severe Misconduct Freq multiplied by Honest.
- Column 1: Coefficient 0.679 triple asterisk, standard error 0.127.
- Column 2: Coefficient 0.327 double asterisk, standard error 0.143.
Column 3 and 4 focus on Rest Misconduct Freq multiplied by Honest.
- Column 3: Coefficient 0.431 triple asterisk, standard error 0.029.
- Column 4: Coefficient 0.045, standard error 0.032.
Summary statistics and controls for all columns:
- Controls: Yes for all.
- Number of observations: 11,252,693 for columns 1 and 3; 10,139,802 for columns 2 and 4.
- R-squared: 0.222 for columns 1 and 3; 0.381 for columns 2 and 4.
- Individual F E: Yes for all.
- Year F E, County F E, and Firm F E: Yes for columns 1 and 3; blank for columns 2 and 4.
- Firm-county-year F E: Blank for columns 1 and 3; Yes for columns 2 and 4.
IV. Reputational Concerns of Honest Advisers
Section III shows that firm misconduct increases honest advisers’ likelihood of leaving their firms. We attribute this behavior to reputational concerns. Because reputation reflects others’ perceptions and is difficult to measure directly, we provide evidence consistent with this mechanism. First, our explanation requires that clients are aware of the misconduct; otherwise, reputational concerns should be muted. Accordingly, we show that misconduct cases with greater information flow, likely increasing client awareness, raise the likelihood that honest advisers leave their firms. Second, we show that the propensity to leave increases with the severity of reputational damage, particularly when sensitivity to misbehavior is high.
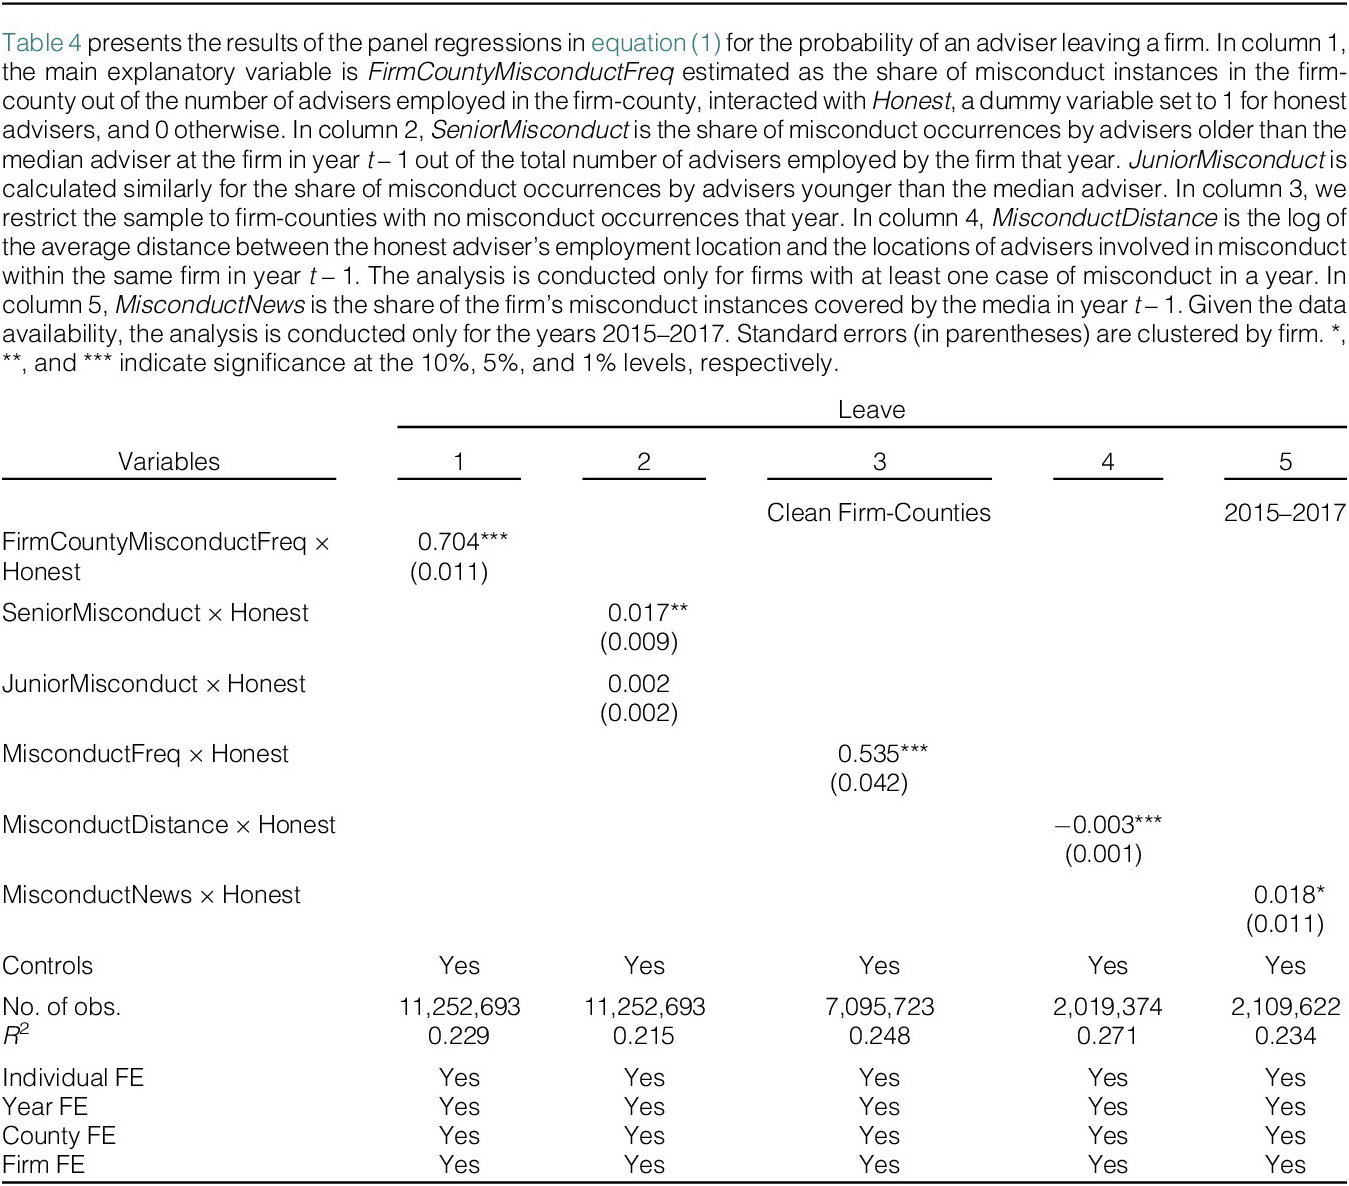
We begin by analyzing the effect of misconduct awareness. Information flow is measured using several approaches. First, we examine misconduct occurrences within the honest adviser’s firm-county. Thus, in column 1 of Table 4, we perform the baseline specification in equation (1) as in column 4 of Table 2, changing the main explanatory variable to the interaction term between the Honest indicator and FirmCountyMisconductFreq, estimated as the share of misconduct instances in the firm-county out of the number of advisers employed in that firm-county. We find that the coefficients of the interaction term are positive and statistically significant. An honest adviser has 21.5% higher propensity of leaving a firm following a 1-standard-deviation rise in firm-county misconduct frequency in the previous year, compared to a dishonest one (relative to the sample mean). The magnitude is about 50% larger than at the firm level, supporting our argument that instances of misconduct, of which awareness is higher, result in more honest advisers leaving their firms.

TABLE 4 Long description
The table presents panel regressions for the dependent variable Leave. It consists of five columns representing different models.
Column 1: Firm County Misconduct Freq times Honest has a coefficient of 0.704 with a standard error of 0.011, significant at the 1 percent level.
Column 2: Senior Misconduct times Honest has a coefficient of 0.017 with a standard error of 0.009, significant at the 5 percent level. Junior Misconduct times Honest has a coefficient of 0.002 with a standard error of 0.002.
Column 3: Restricted to Clean Firm-Counties. Misconduct Freq times Honest has a coefficient of 0.535 with a standard error of 0.042, significant at the 1 percent level.
Column 4: Misconduct Distance times Honest has a coefficient of minus 0.003 with a standard error of 0.001, significant at the 1 percent level.
Column 5: Data for 2015 to 2017. Misconduct News times Honest has a coefficient of 0.018 with a standard error of 0.011, significant at the 10 percent level.
All models include Controls, Individual F E, Year F E, County F E, and Firm F E.
Number of observations: Column 1 and 2 have 11,252,693; Column 3 has 7,095,723; Column 4 has 2,019,374; Column 5 has 2,109,622.
R-squared values range from 0.215 to 0.271.
Next, misconduct committed by more senior advisers is expected to increase the propensity of honest advisers to leave. Employees with longer tenure are more likely to hold higher-ranking positions within their firms. They are also more closely identified with the firm and tend to have more clients; therefore, more people are expected to be aware of misconduct instances compared to misconduct by less tenured employees. This might lead to a more damaging effect on reputation than misconduct of advisers with shorter tenures. To test this, we conduct the baseline specification in equation (1), modifying the employee misconduct rate (MisconductFreq) to SeniorMisconduct and JuniorMisconduct. SeniorMisconduct is the share of misconduct occurrences by advisers older than the median adviser at the firm in year t –1 out of the total number of advisers employed by the firm that year. JuniorMisconduct is calculated similarly for the share of misconduct occurrences by advisers younger than the median adviser. These two variables are also interacted with the Honest indicator. Column 2 in Table 4 presents the results, showing that the coefficient of the interaction term of SeniorMisconduct with Honest is positive and statistically significant, while the interaction of JuniorMisconduct with Honest is also positive but statistically insignificant, with a lower magnitude. This indicates that misconduct conducted by more tenured advisers leads to more departures of honest advisers.
Further, the news regarding misconduct occurring in firm-counties that have not recently experienced such cases is more likely to spread. To test this, in column 3 of Table 4, we restrict the sample to honest advisers working in clean firm-counties, defined as those with no misconduct occurrences that year. We perform the specification in equation (1) and obtain a larger magnitude relative to the analysis presented in column 4 of Table 2 for the whole sample. The clean firm-county analysis also helps us verify that the results are not driven by potential co-worker effects (Dimmock et al. (Reference Dimmock, Gerken and Graham2018)), as honest advisers might leave due to negative peer effects, a worsening work environment, lower moral stringency within the firm, or increased temptation into misconduct.
Additionally, awareness of misconduct is likely to decrease with greater geographical distance. We capture this by calculating the average distance between the honest adviser’s employment location and the locations of advisers involved in misconduct within the same firm during that year. Using the specification in equation (1), we employ the log of this average distance as the main explanatory variable. The analysis is conducted only for firms with at least one misconduct case in a year. Column 4 in Table 4 shows that more distant misconduct occurrences indeed have a weaker influence on an honest adviser’s propensity to leave a firm. A 1-standard-deviation decrease in geographic distance (measured in miles) of misconduct instance in the firm increases the probability of the honest adviser leaving the firm by 5.1% relative to the mean departures. This is consistent with the result in column 1 of Table 4, which shows that honest advisers are more likely to leave following misconduct in their firm-county than following misconduct elsewhere in the firm.
Finally, media coverage is likely to accelerate and broaden the spread of information. To this end, we manually gathered data on all instances of misconduct by financial advisers reported in the weekly magazine InvestmentNews for 2015–2017. This website is the leading news source, analysis, and insights for financial advisers and wealth management professionals. Then, for this subsample of misconduct occurrences, we estimate the specification in equation (1), modifying the employee misconduct rate (MisconductFreq) to MisconductNews, defined as the share of the firm’s misconduct instances covered by the media. Column 5 in Table 4 presents the results. Honest advisers have a 27.2% higher probability of leaving their firms following a 1-standard-deviation increase in the share of misconduct cases covered by the media, relative to the sample mean.
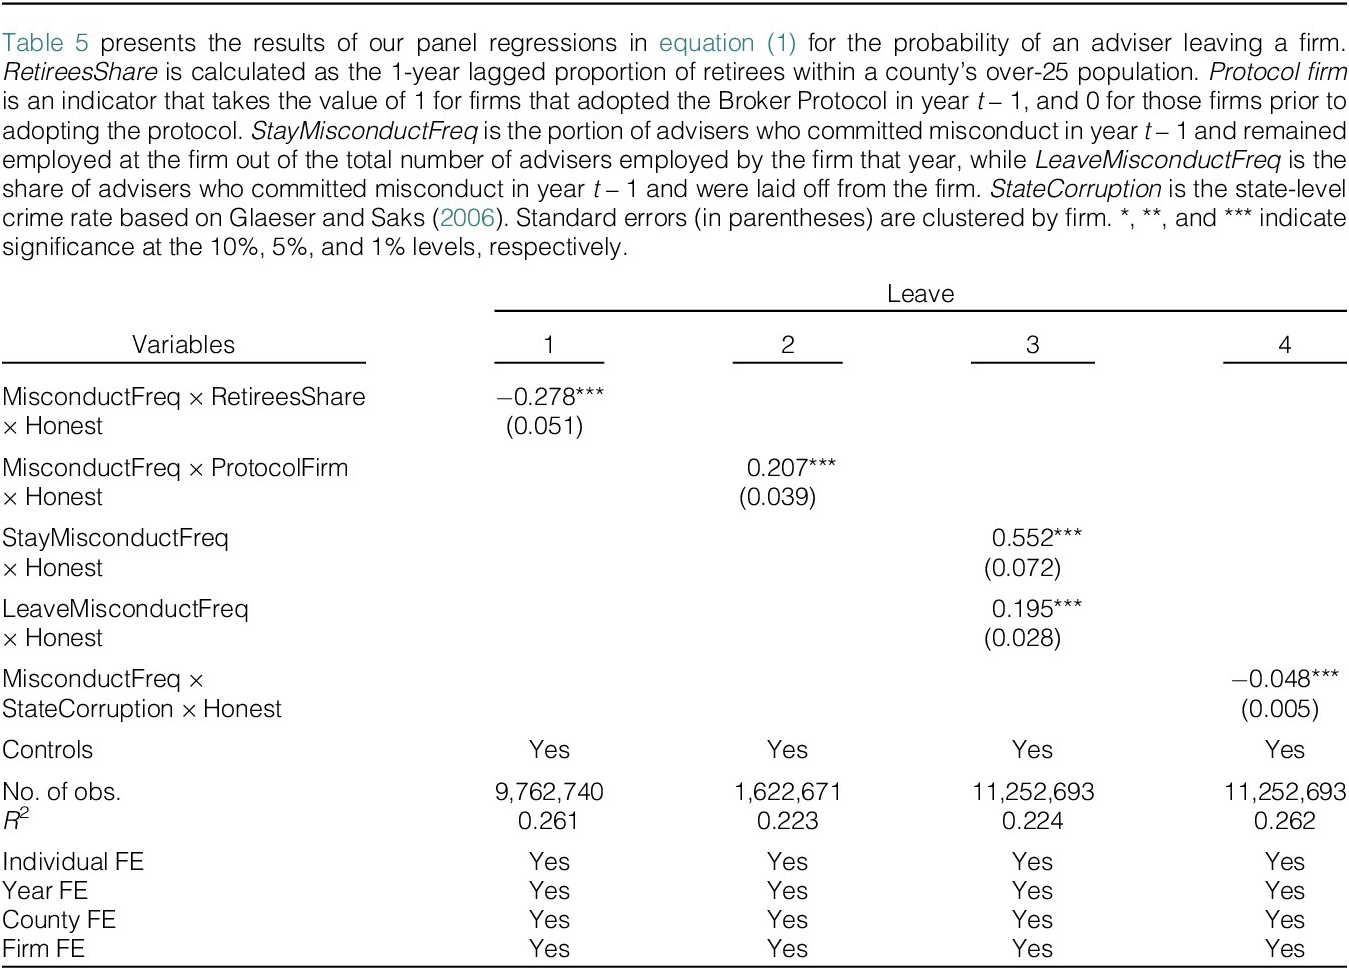
We now turn to the analysis of sensitivity to misconduct. Greater local sensitivity heightens the reputational cost of remaining at a tainted firm, thereby increasing the likelihood that honest advisers will depart. We examine this dimension through several analyses. First, financially sophisticated clients are more sensitive to firm misconduct, increasing the reputational risk for the honest advisers. Following Egan et al. (Reference Egan, Matvos and Seru2019), we use the 1-year lagged proportion of retirees within a county’s over-25 population as a proxy for the local client base’s lack of financial sophistication. We add to the specification in equation (1) a triple interaction between the main interaction term (MisconductFreq × Honest) and this variable (RetireesShare), as well as the other interactions of RetireesShare. Column 1 of Table 5 shows that honest advisers are less likely to leave the firm following misconduct in counties with less sophisticated populations.

TABLE 5 Long description
The table consists of four columns labeled 1 through 4, with the dependent variable being Leave.
Model 1: MisconductFreq times RetireesShare times Honest has a coefficient of minus 0.278 with a standard error of 0.051, significant at the 1 percent level. Number of observations is 9,762,740 with an R-squared of 0.261.
Model 2: MisconductFreq times ProtocolFirm times Honest has a coefficient of 0.207 with a standard error of 0.039, significant at the 1 percent level. Number of observations is 1,622,671 with an R-squared of 0.223.
Model 3: StayMisconductFreq times Honest has a coefficient of 0.552 with a standard error of 0.072. LeaveMisconductFreq times Honest has a coefficient of 0.195 with a standard error of 0.028. Both are significant at the 1 percent level. Number of observations is 11,252,693 with an R-squared of 0.224.
Model 4: MisconductFreq times StateCorruption times Honest has a coefficient of minus 0.048 with a standard error of 0.005, significant at the 1 percent level. Number of observations is 11,252,693 with an R-squared of 0.262.
All models include Controls, Individual F E, Year F E, County F E, and Firm F E.
Next, Gurun et al. (Reference Gurun, Stoffman and Yonker2021) examined firm-level variation in the adoption of the Broker Protocol. It facilitates adviser mobility and client retention across firms without fear of litigation. Protocol adoption provides an empirical setting to analyze more directly the effect of reputational threats on future cash flows, as roughly 40% of client assets follow the adviser. Following Gurun et al. (Reference Gurun, Stoffman and Yonker2021), we collect entry and exit dates to the Broker Protocol from the website maintained by the law firm Carlile, Patchen, and Murphy LLP. These firms are matched to FINRA’s unique firm-level CRD identifiers by aligning the legal names of entities across the SEC and FINRA databases. We restrict the sample to firms that adopted the Broker Protocol and add to the specification from equation (1) a triple interaction between an indicator for protocol adoption and MisconductFreq × Honest, as well as the other interactions of protocol adoption indicator. We show in column 2 in Table 5 that once a firm joins the Protocol, honest advisers are more likely to leave following within-firm misconduct.
Further, we analyze managerial responses to misconduct by considering whether the firm fired the offending adviser. When a firm handles misconduct seriously, it signals to its advisers and clients its intolerance of such behavior. However, when the adviser who committed misconduct remains employed, even if they face other forms of punishment, it may be more difficult for other advisers to explain the situation to clients or justify the firm’s decision. We replace the main explanatory variable of firm misconduct in equation (1) with StayMisconductFreq and LeaveMisconductFreq. StayMisconductFreq is the portion of advisers who committed misconduct in year t – 1 and remained employed at the firm out of the total number of advisers employed by the firm that year, while LeaveMisconductFreq is the share of advisers who committed misconduct in year t – 1 and were laid off from the firm. Column 3 in Table 5 shows that the coefficients of both variables with the Honest indicator are positive, but the magnitude is significantly larger in cases where the dishonest adviser stays in the firm. This indicates that less strict punishments increase the probability of honest advisers leaving the firm.
Finally, we examine advisers’ sensitivity to misconduct using variation in state-level crime and corruption rates. Glaeser and Saks (Reference Glaeser and Saks2006) show the heterogeneity in state crime rates, noting that different types of crime tend to be concentrated in specific states. Additionally, Liu, Moldogaziev, and Mikesell (Reference Liu, Moldogaziev and Mikesell2017) demonstrate that corruption levels vary significantly across states. Meier and Holbrook (Reference Meier and Holbrook1992) further argue that differences in corruption between states stem from cultural and historical factors, meaning that some states are more tolerant of crime than others. In areas where people are more accustomed to crime, we expect advisers to be less sensitive to misconduct. This, in turn, would reduce their propensity to leave a firm following an increase in misconduct occurrences. To test this, we modify the specification in equation (1) to include a triple interaction between the state corruption rate (Glaeser and Saks (Reference Glaeser and Saks2006)), a firm’s total instances of misconduct, and the indicator of whether the adviser is honest. We also include the other relevant interactions of the state corruption rate. The result in column 4 of Table 5 shows that the effect of misconduct on adviser departures is stronger in states with lower corruption rates, where sensitivity to crime is higher.
V. To Which Firms Do Honest Advisers Move?
In Sections III and IV, we showed that an honest adviser is more likely to leave the firm following misconduct, driven by reputational concerns. This section provides evidence that misconduct is a key factor in honest advisers’ departure decisions by analyzing the characteristics of their new firms relative to their previous ones. Unlike dishonest advisers, who are mostly hired by firms that tolerate misbehavior (Egan et al. (Reference Egan, Matvos and Seru2019)), honest advisers are not constrained to a specific firm type and have much greater freedom of choice. This enables us to observe individuals’ choices and gain deeper insights into the factors that influence their decision-making when selecting a firm to join.
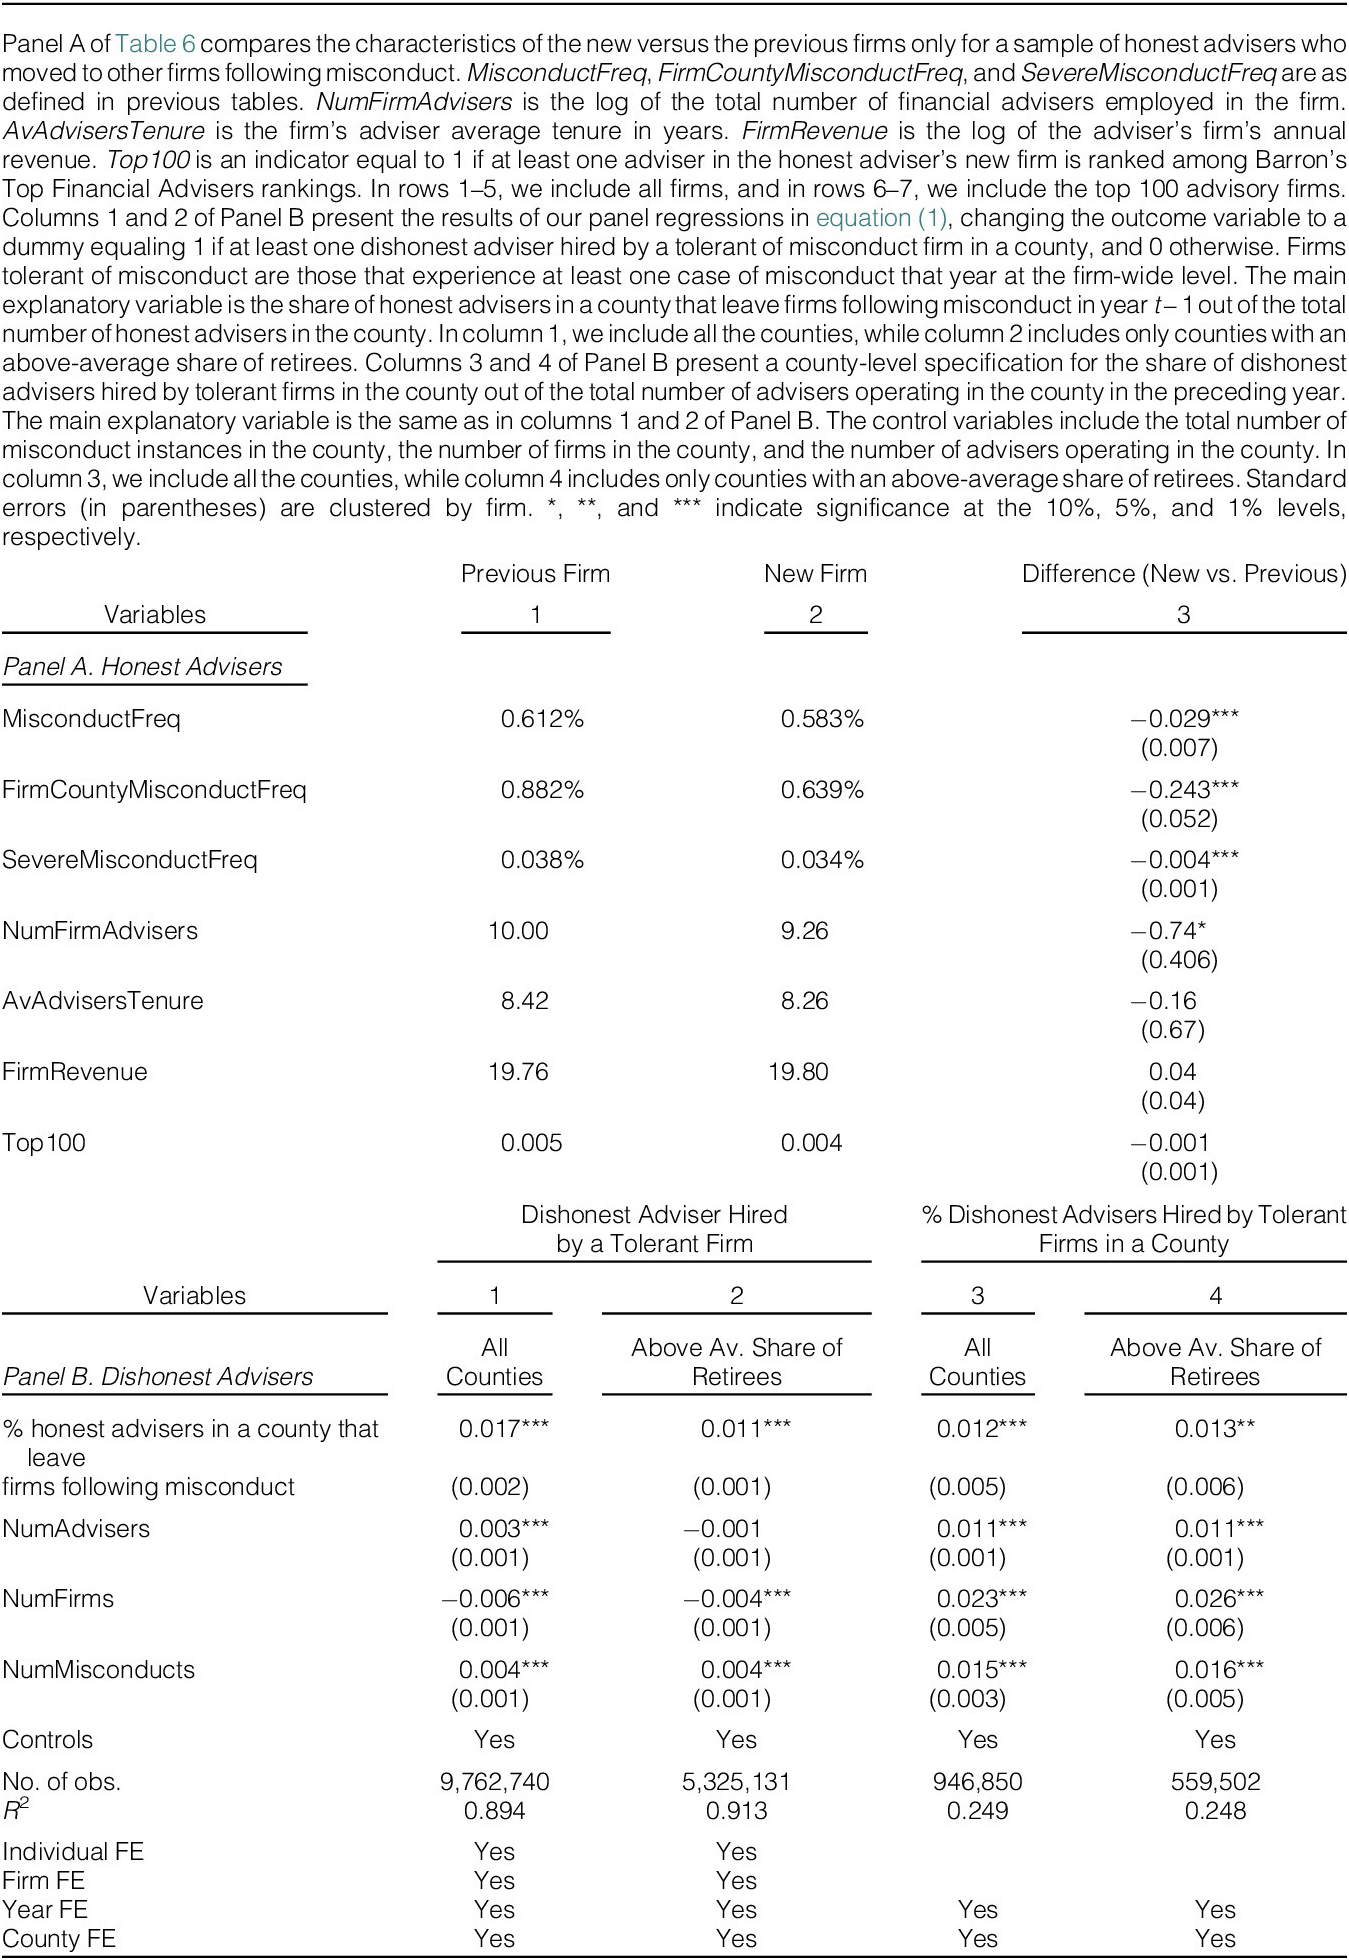
To this end, we focus on honest advisers who transition to new firms following misconduct at their former employers and compare the characteristics of the new firms with those of their former firms. Panel A in Table 6 presents the results. The first row, which compares the frequency of recorded misconduct incidents, shows that the incidence of misconduct at the new firm is statistically and economically significantly lower. In the second row, we compare the number of misconduct occurrences in the adviser’s new firm-county with those in their former firm-county. This comparison provides additional insight into the honest adviser’s considerations when selecting a new location. We find lower instances of misconduct at the new firm-county. The third row presents the comparison of the frequency of severe instances of misconduct (as defined in Section II.A). Here, again, we find lower misconduct occurrences in the adviser’s new firm relative to the previous firm. These findings suggest that honest advisers who choose to move tend to select both firms and firm-counties with lower levels of misconduct.

TABLE 6 Long description
Panel A compares characteristics of previous versus new firms for honest advisers. It includes three columns: 1 Previous Firm, 2 New Firm, and 3 Difference.
- Misconduct Freq: 0.612% in previous, 0.583% in new, difference of minus 0.029***.
- Firm County Misconduct Freq: 0.882% in previous, 0.639% in new, difference of minus 0.243***.
- Severe Misconduct Freq: 0.038% in previous, 0.034% in new, difference of minus 0.004***.
- Num Firm Advisers: 10.00 in previous, 9.26 in new, difference of minus 0.74*.
- Av Advisers Tenure: 8.42 in previous, 8.26 in new, difference of minus 0.16.
- Firm Revenue: 19.76 in previous, 19.80 in new, difference of 0.04.
- Top 100: 0.005 in previous, 0.004 in new, difference of minus 0.001.
Panel B presents regression results for hiring dishonest advisers across four columns: 1 and 2 for Dishonest Adviser Hired by a Tolerant Firm, and 3 and 4 for percentage of Dishonest Advisers Hired by Tolerant Firms in a County. Columns 1 and 3 include All Counties, while 2 and 4 include only those with an Above Average Share of Retirees.
- Percentage of honest advisers in a county that leave firms following misconduct: Coefficients are 0.017*** (Col 1), 0.011*** (Col 2), 0.012*** (Col 3), and 0.013** (Col 4).
- Num Advisers: 0.003*** (Col 1), minus 0.001 (Col 2), 0.011*** (Col 3), 0.011*** (Col 4).
- Num Firms: minus 0.006*** (Col 1), minus 0.004*** (Col 2), 0.023*** (Col 3), 0.026*** (Col 4).
- Num Misconducts: 0.004*** (Col 1), 0.004*** (Col 2), 0.015*** (Col 3), 0.016*** (Col 4).
- Number of observations: 9,762,740 (Col 1), 5,325,131 (Col 2), 946,850 (Col 3), 559,502 (Col 4).
- R-squared: 0.894 (Col 1), 0.913 (Col 2), 0.249 (Col 3), 0.248 (Col 4).
All columns in Panel B include Year and County Fixed Effects (F E). Columns 1 and 2 also include Individual and Firm F E.
In the next four rows of Panel A, we examine whether other characteristics of the honest adviser’s new firm differ from those in their previous firm. We start with firm size, measured as the log of the number of advisers employed in the firm (row 4). Then, we compare adviser tenure across their former and new firms (row 5). Next, we manually gathered data from InvestmentNews on the top 100 advisory firms to analyze the firm’s log annual revenue (row 6) and firm quality (row 7). We proxy firm quality using an indicator variable that equals 1 if at least one adviser at the firm is ranked in Barron’s Top 100 Financial Advisers rankings (Gerken and Momeni Shahraki (Reference Gerken and Momeni Shahraki2026)). Although row 4 shows a weak indication that honest advisers may be more likely to move to smaller firms following firm misconduct, we do not find evidence that any specific firm characteristic, other than misconduct, plays a meaningful role in the honest adviser’s relocation decision. These results suggest that, among observable firm characteristics, the incidence of misconduct is the primary consideration for honest advisers when selecting a new firm.
As mentioned in Section III, the honest adviser’s decision to leave following within-firm misconduct has a meaningful effect at the firm level. Now, we turn to show that this decision to leave and join a less-tolerant firm carries important implications for the matching dynamics between firms and advisers, based on the firm’s tolerance for misconduct. The more tolerant firms are left with a smaller pool of honest advisers and, consequently, a relatively larger proportion of dishonest ones. This provides additional insight into why firms with greater tolerance for misconduct tend to employ a higher percentage of dishonest advisers, complementing the explanation proposed by Egan et al. (Reference Egan, Matvos and Seru2019).
To provide empirical evidence for this outcome, we estimate the adviser-level specification in equation (1), modifying the dependent and the key explanatory variables. The outcome variable is a dummy that equals 1 if a firm tolerant of misconduct hired at least one dishonest adviser in a given county, and 0 otherwise. Firms tolerant of misconduct are those that experience at least one case of misconduct in that year at the firm-wide level. The main explanatory variable is the share of honest advisers in a county that leave firms following misconduct in year t – 1 out of the total number of honest advisers in the county. To address the fact that the outcome variable does not account for population and adviser heterogeneity across counties, we control for the number of advisers in the county, the number of firms operating in the county, and the number of misconduct occurrences in the county. The first two proxy for local market activity and opportunity sets, while misconduct prevalence may independently increase the likelihood that dishonest advisers match with misconduct-tolerant firms (Egan et al. (Reference Egan, Matvos and Seru2019)).
We find in column 1 of Panel B of Table 6 a positive association between the number of honest advisers leaving firms following misconduct and the likelihood that a firm that tolerates misconduct hires a dishonest adviser within the same county. Specifically, dishonest advisers are 2.3% more likely to be hired by tolerant firms in counties with departures of honest advisers 1 standard deviation above the sample mean following within-firm misconduct. The effect also holds in counties with more unsophisticated clients, who are more vulnerable to misconduct, suggesting broader welfare consequences in column 2.
Additionally, we conduct a parallel analysis at the county level. The dependent variable in this specification is the share of dishonest advisers hired by firms tolerant of misconduct within each county out of the total number of advisers operating in the county in the preceding year. The primary explanatory variable is identical to that in columns 1 and 2—the share of honest advisers in a county who leave their firms following misconduct—and we include the same set of controls. The results are consistent with the previous ones. In column 3 of Panel B of Table 6, we find that a 1-standard-deviation increase in honest advisers leaving following within-firm misconduct in a county is associated with a 6.9% increase in the share of dishonest advisers hired by tolerant firms out of the total number of advisers operating in that county (relative to the sample mean). The effect also holds in counties with more unsophisticated clients (column 4).
VI. Robustness and Endogeneity Tests
Sections III–V showed that honest advisers are more likely to leave firms that exhibit increased instances of misconduct and transition to firms less tolerant of such behavior due to reputational concerns. We conducted a thorough analysis and verified that our results are robust across various specifications. Additionally, we used 1-year lagged misconduct instances, incorporated a range of control variables, and included stringent fixed effects to ensure the robustness of our findings. In this section, we address potential alternative explanations for the observed effect by mitigating specific confounding factors and performing a Difference-in-Differences analysis.
A. Addressing Specific Alternative Explanations
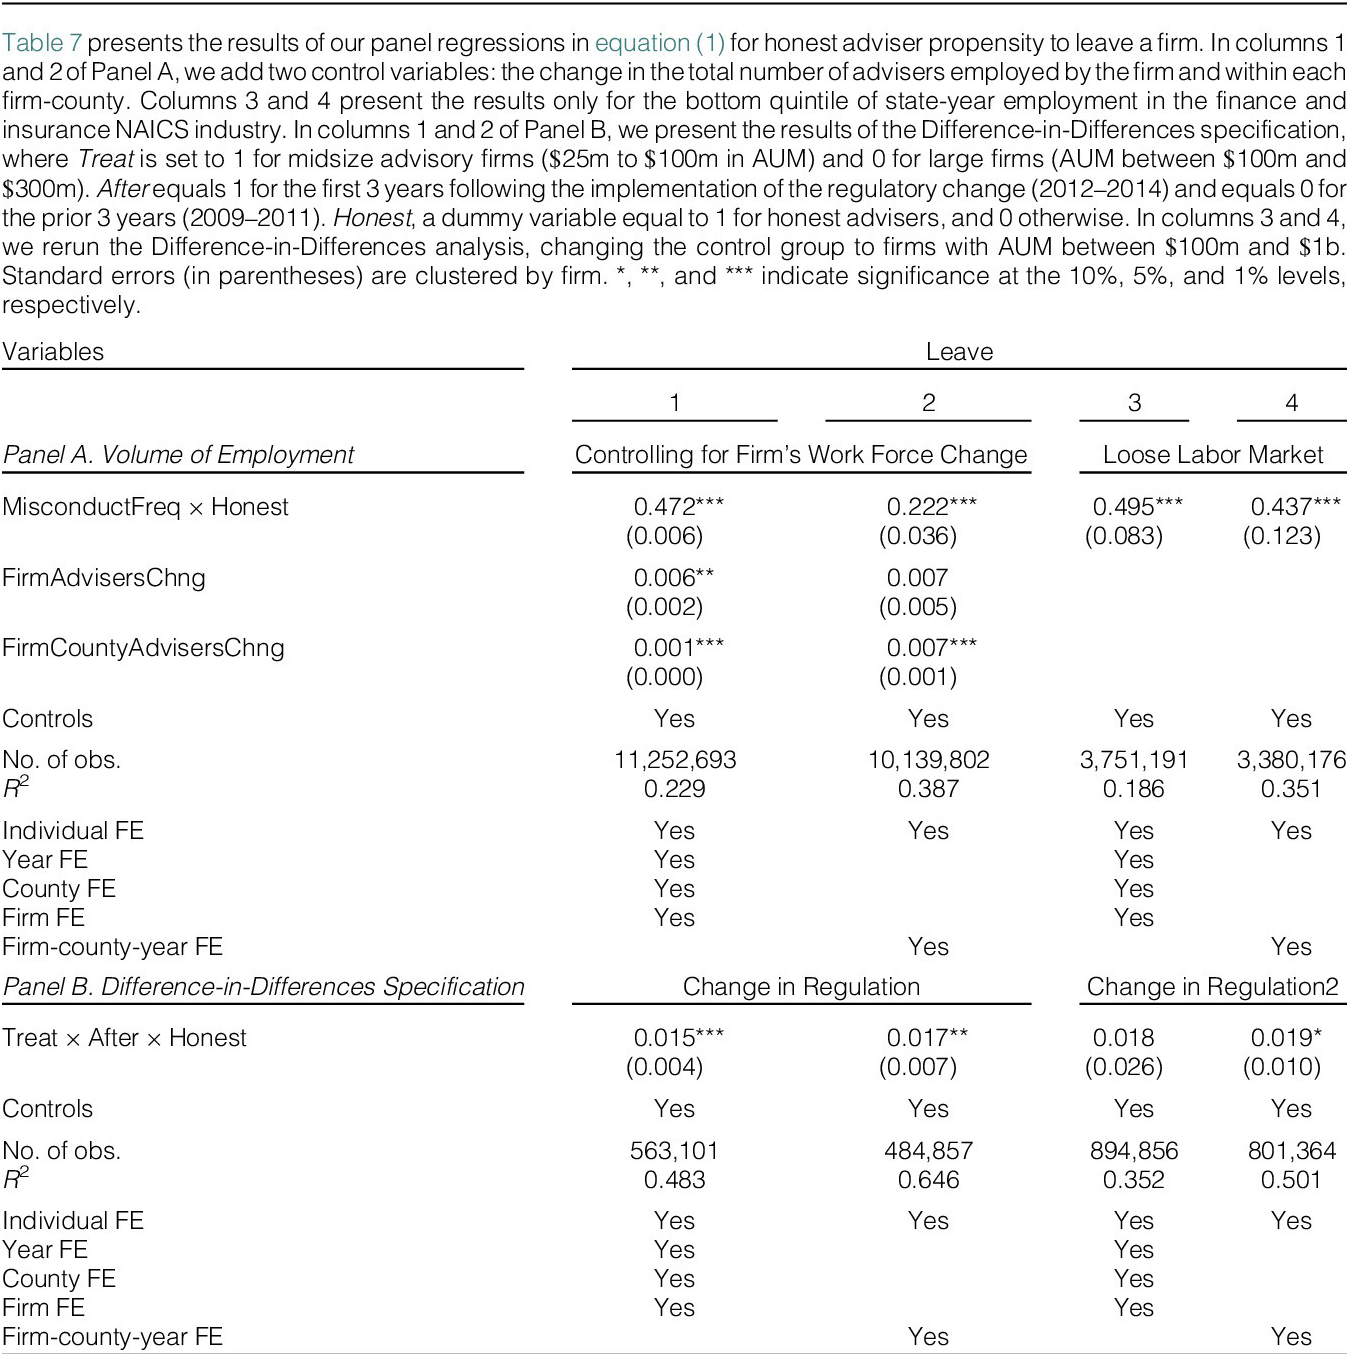
Our findings may raise the concern that observed adviser departures reflect firm-initiated responses to misconduct rather than reputational concerns. For example, instances of misconduct may be symptomatic of broader organizational issues that prompt the firm to restructure, revise internal policies, or conduct layoffs. At the same time, changes in a firm’s work environment, policies, or procedures may also influence the likelihood that some honest advisers choose to leave. To ensure that such factors are not driving the observed effect, we re-estimate our main specification in equation (1) and include two additional control variables: the change in the total number of advisers employed by the firm and within each firm-county. These two additional variables further help control for changes in the firm’s workforce and the broader firm-county dynamics. We find, in columns 1 and 2 in Panel A of Table 7, a positive and significant coefficient for the main explanatory variable, with magnitudes similar to those in our baseline specification.

TABLE 7 Long description
The table is divided into Panel A and Panel B, both with four columns labeled 1 through 4. The dependent variable for all columns is Leave.
Panel A: Controlling for Firm Workforce Change and Loose Labor Market.
* MisconductFreq times Honest: Column 1 is 0.472 (0.006) ***; Column 2 is 0.222 (0.036) ***; Column 3 is 0.495 (0.083) ***; Column 4 is 0.437 (0.123) ***.
* FirmAdvisersChng: Column 1 is 0.006 (0.002) **; Column 2 is 0.007 (0.005).
* FirmCountyAdvisersChng: Column 1 is 0.001 (0.000) ***; Column 2 is 0.007 (0.001) ***.
* Number of observations: Ranges from 3,380,176 to 11,252,693.
* R-squared: Ranges from 0.186 to 0.387.
Panel B: Change in Regulation.
* Treat times After times Honest: Column 1 is 0.015 (0.004) ***; Column 2 is 0.017 (0.007) **; Column 3 is 0.018 (0.026); Column 4 is 0.019 (0.010) *.
* Number of observations: Ranges from 484,857 to 894,856.
* R-squared: Ranges from 0.352 to 0.646.
Fixed Effects (F E) for both panels:
* Individual F E: Yes for all columns.
* Year, County, and Firm F E: Yes for columns 1 and 3.
* Firm-county-year F E: Yes for columns 2 and 4.
Standard errors are in parentheses. Asterisks indicate significance levels: * 10%, ** 5%, and *** 1%.
Another possibility is that adviser mobility is externally initiated. Firms with stronger compliance cultures may proactively recruit honest advisers away from firms experiencing reputational issues. To address this concern, we test whether our main results hold in a loose labor market. This alternative explanation is less plausible in a market characterized by an excess supply of advisers, where many are seeking new positions, while firms are hiring fewer. To explore this, we use annual employment data for the finance and insurance NAICS industry (52) from the Bureau of Labor Statistics. We estimate regional variations in labor market conditions by exploiting heterogeneity in state-level employment within the sector and perform the specification in equation (1) on the bottom quintile of state-year employment. State-level employment in the finance and insurance NAICS industry (52) is calculated as the share of employed individuals in this sector out of the state’s working-age population (16 years and older). In columns 3 and 4 in Panel A of Table 7, the results remain statistically significant and consistent with our central finding that within-firm misconduct drives honest advisers to leave their firms.
Another possibility is that the results are driven by advisers who have engaged in misconduct that has yet to be uncovered or by instances of misconduct removed from public records (Honigsberg and Jacob (Reference Honigsberg and Jacob2021)). However, the fact that honest advisers tend to move to firms with fewer instances of misconduct (as demonstrated in Section V) makes this explanation less likely. Furthermore, we find no other characteristics that consistently explain the honest advisers’ choice of their new firm. If advisers were concerned about increased monitoring following misconduct, we would expect them to gravitate toward firms with a higher tolerance for such behavior, rather than toward those with lower levels of misconduct. Finally, we confirm that the majority of honest advisers have never been involved in misconduct, even after their move. The literature suggests that advisers who have committed misconduct are more likely to repeat it (e.g., Egan et al. (Reference Egan, Matvos and Seru2019), and Honigsberg and Jacob (Reference Honigsberg and Jacob2021)).
B. Difference-in-Differences Analysis
Various unobservable factors, such as changes in personal circumstances (e.g., family-related decisions) or the fact that advisers were already seeking new employment opportunities, could also influence the decision and timing to switch firms. A firm’s misconduct can be correlated, either directly or through unobserved factors, with honest advisers’ decisions to leave.
Given that these factors are inherently difficult to measure, we employ a Difference-in-Differences analysis, using the shift in regulatory jurisdiction over midsize financial advisory firms from the SEC to state securities regulators as an exogenous shock. Charoenwong et al. (Reference Charoenwong, Kwan and Umar2019) demonstrate that this regulatory change, which is less stringent than SEC oversight, increased the likelihood of misconduct in midsize firms.
We closely follow the methodology of Charoenwong et al. (Reference Charoenwong, Kwan and Umar2019). Our treated group includes midsize financial advisory firms ($25m to $100m in AUM), while the control group consists of big firms. We perform the specification twice, once with the control group that consists of firms with AUM between $100m and $300m and then for firms with AUM between $100m and $1b. As Charoenwong et al. (Reference Charoenwong, Kwan and Umar2019) did, we exclude from the sample the two states (New York and Wyoming) in which midsize firms were not subject to a change in regulatory jurisdiction.
We perform our individual-level specification in equation (1), changing the primary explanatory variable to Treat × After × Honest. After takes the value of 1 for the 3 years following the change in regulatory jurisdiction (2012–2014) and 0 for the 3 years preceding the change (2009–2011). In column 1 in Panel B of Table 7, we mirror the previous results, finding that honest advisers are more likely to leave treated firms following the regulatory change. The effect in column 3 is also positive but not statistically significant.
A looser regulatory regime could potentially drive honest advisers to leave firms, regardless of the firm’s misconduct. While we do not consider this a plausible explanation in our case, having earlier shown that regulatory changes are unlikely to drive our results, we address this concern by including adviser, firm-county-time fixed effects in the specification. As shown in columns 2 and 4 of Panel B in Table 7, our results remain robust and consistent.
VII. Conclusions
This article investigates the impact of a firm’s misconduct occurrences on its honest advisers. Our examination of how honest advisers are affected by misconduct is novel, as the majority of existing literature has focused on dishonest advisers and the factors contributing to misconduct. We find that honest advisers are more likely to leave firms with higher levels of misconduct and transition to firms with fewer such incidents, driven by increased concerns about their reputations. We provide extensive evidence supporting this concern, demonstrating that the flow of information about misconduct and increased sensitivity to unethical behavior increases the likelihood that honest advisers will depart. These reputational spillovers have significant market consequences, shaping the matching dynamics between firms and advisers based on each party’s tolerance for misconduct.
The new factor established in this article regarding the influence of firm misconduct on employees’ strategic decisions to leave has broader implications. It could be applied to other professions, such as doctors or academics. We isolate and focus on a specific reason for departure that, to the best of our knowledge, has not been previously identified. Our contribution lies in highlighting the dynamics that help explain why some firms employ a significantly higher percentage of honest advisers than others.
Appendix Variable Definitions
This appendix presents the definitions of the variables used in our analysis.
- %dishonest advisers hired by tolerant firms in a county
-
$ \frac{\begin{array}{l}\mathrm{No}.\ \mathrm{of}\ \mathrm{dishonest}\ \mathrm{advisers}\ \mathrm{hired}\hskip0.42em \mathrm{by}\hskip0.42em \mathrm{tolerant}\ \mathrm{firms}\\ {}\hskip8em \mathrm{in}\ \mathrm{county}\hskip0.42em c\hskip0.42em \mathrm{in}\ \mathrm{year}\hskip0.42em t\end{array}}{\mathrm{No}.\ \mathrm{of}\ \mathrm{advisers}\ \mathrm{operating}\ \mathrm{in}\ \mathrm{county}\hskip0.42em c\hskip0.42em \mathrm{in}\ \mathrm{year}\hskip0.42em t-1}. $

- AvAdvisersTenure
-
Average tenure of advisers at firm f in year 𝑡.
- Dishonest adviser hired by a tolerant firm
-
Indicator whether at least one dishonest adviser hired by a tolerant of misconduct firm in county c in year 𝑡.
- FirmAdvisersChng
-
Annual change in the total number of advisers employed in firm f.
- FirmCountyAdvisersChng
-
Annual change in the total number of advisers employed in firm f in county c.
- FirmCountyMisconductFreq
-
$ \frac{\begin{array}{l}\mathrm{No}.\ \mathrm{of}\ \ \mathrm{misconduct}\ \mathrm{occurrences}\hskip0.42em \mathrm{at}\hskip0.42em \mathrm{firm}\hskip0.42em f\hskip0.42em \mathrm{in}\ \mathrm{county}\hskip0.42em c\\ {}\hskip13.5em \mathrm{in}\ \mathrm{year}\hskip0.42em t\end{array}}{\begin{array}{l}\mathrm{No}.\ \mathrm{of}\ \mathrm{advisers}\ \mathrm{employed}\hskip0.42em \mathrm{by}\hskip0.42em \mathrm{firm}\hskip0.42em f\hskip0.42em \mathrm{in}\ \mathrm{county}\hskip0.42em c\\ {}\hskip1em \mathrm{in}\ \mathrm{year}\hskip0.42em t\end{array}}. $
- FirmRevenue
-
Log revenue of firm f in year 𝑡.
- Honest
-
Indicator whether adviser 𝑖 has no prior disciplinary events as of year 𝑡.
- JuniorMisconduct
-
$ \frac{\begin{array}{l}\mathrm{No}.\ \mathrm{of}\ \ \mathrm{misconducts}\ \mathrm{by}\ \mathrm{adviser}\mathrm{s}\ \mathrm{younger}\\ {}\hskip-.5em \ \mathrm{than}\ \mathrm{the}\ \mathrm{median}\ \mathrm{adviser}\hskip0.42em \mathrm{at}\hskip0.42em \mathrm{firm}\hskip0.42em f\hskip0.42em \mathrm{in}\ \mathrm{year}\hskip0.42em t\end{array}}{\mathrm{No}.\ \mathrm{of}\ \mathrm{adviser}\mathrm{s}\ \mathrm{employed}\hskip0.42em \mathrm{by}\hskip0.42em \mathrm{firm}\hskip0.42em f\hskip0.42em \mathrm{in}\ \mathrm{year}\hskip0.42em t}. $
- Leave
-
Indicator whether adviser 𝑖 leaves firm f in county c in year 𝑡.
- LeaveMisconductFreq
-
$ \frac{\begin{array}{l}\mathrm{No}.\ \mathrm{of}\ \mathrm{advisers}\hskip0.42em \mathrm{who}\hskip0.42em \mathrm{committed}\ \mathrm{misconduct}\ \mathrm{in}\ \mathrm{year}\\ {}\hskip7em t\ \mathrm{and}\ \mathrm{were}\ \mathrm{laid}\hskip0.42em \mathrm{off}\hskip0.24em \mathrm{from}\ \mathrm{firm}\hskip0.42em f\end{array}}{\mathrm{No}.\ \mathrm{of}\ \mathrm{advisers}\ \mathrm{employed}\hskip0.42em \mathrm{by}\hskip0.42em \mathrm{firm}\hskip0.42em f\hskip0.42em \mathrm{in}\ \mathrm{year}\hskip0.42em t}. $
- MisconductDistance
-
Log average distance between the honest adviser’s employment location and the locations of advisers involved in misconduct at firm f in year 𝑡.
- MisconductFreq
-
$ \frac{\mathrm{No}.\ \mathrm{of}\ \mathrm{misconduct}\ \mathrm{occurrences}\hskip0.42em \mathrm{at}\hskip0.42em \mathrm{firm}\hskip0.42em f\hskip0.42em \mathrm{in}\ \mathrm{year}\hskip0.42em t\hskip0.42em }{\mathrm{No}.\ \mathrm{advisers}\ \mathrm{employed}\hskip0.42em \mathrm{by}\hskip0.42em \mathrm{firm}\hskip0.42em f\hskip0.42em \mathrm{in}\ \mathrm{year}\hskip0.42em t}. $
- MisconductNews
-
$ \frac{\begin{array}{l}\mathrm{No}.\ \mathrm{of}\ \mathrm{misconduct}\ \mathrm{occurrences}\ \mathrm{covered}\\ {}\hskip3em \mathrm{by}\hskip0.42em \mathrm{the}\ \mathrm{news}\hskip0.42em \mathrm{at}\hskip0.42em \mathrm{firm}\hskip0.42em f\hskip0.42em \mathrm{in}\ \mathrm{year}\hskip0.42em t\end{array}}{\mathrm{No}.\ \mathrm{of}\ \mathrm{misconduct}\ \mathrm{occurrences}\hskip0.42em \mathrm{at}\hskip0.42em \mathrm{firm}\hskip0.42em f\hskip0.42em \mathrm{in}\ \mathrm{year}\hskip0.42em t}. $
- NumFirmAdvisers
-
Log no. of financial advisers employed at firm f in year 𝑡.
- NumFirms
-
No. of firms operating in county c in year 𝑡.
- ProtocolFirm
-
Indicator for Broker Protocol adoption of firm f in year 𝑡.
- RestMisconductFreq
-
$ \frac{\begin{array}{l}\mathrm{No}.\ \mathrm{of}\ \mathrm{four}\ \mathrm{other}\ \mathrm{misconduct}\ \mathrm{categories}\ \mathrm{occurrences}\\ {}\hskip12em \mathrm{at}\hskip0.42em \mathrm{firm}\hskip0.42em f\hskip0.42em \mathrm{in}\ \mathrm{year}\hskip0.42em t\end{array}}{\mathrm{No}.\ \mathrm{of}\ \mathrm{advisers}\ \mathrm{employed}\hskip0.42em \mathrm{by}\hskip0.42em \mathrm{firm}\hskip0.42em f\hskip0.42em \mathrm{in}\ \mathrm{year}\hskip0.42em t}. $
- RetireesShare
-
$ \frac{\mathrm{No}.\ \mathrm{of}\ \mathrm{retirees}\ \mathrm{in}\ \mathrm{county}\hskip0.42em c\hskip0.42em \mathrm{in}\ \mathrm{year}\hskip0.42em t}{\mathrm{Total}\ \mathrm{over}\hskip0.42em 25\hskip0.42em \mathrm{population}\ \mathrm{in}\ \mathrm{county}\hskip0.42em c\hskip0.42em \mathrm{in}\ \mathrm{year}\hskip0.42em t}. $
- SeniorMisconduct
-
$ \frac{\begin{array}{l}\mathrm{No}.\ \mathrm{of}\ \mathrm{misconducts}\hskip0.42em \mathrm{by}\hskip0.42em \mathrm{advisers}\ \mathrm{older}\ \mathrm{than}\\ {}\hskip1em \ \mathrm{the}\ \mathrm{median}\ \mathrm{adviser}\hskip0.42em \mathrm{at}\hskip0.42em \mathrm{firm}\hskip0.42em f\hskip0.42em \mathrm{in}\ \mathrm{year}\hskip0.42em t\end{array}}{\mathrm{No}.\ \mathrm{of}\ \ \mathrm{adviser}\mathrm{s}\ \mathrm{employed}\hskip0.42em \mathrm{by}\hskip0.42em \mathrm{firm}\hskip0.42em f\hskip0.42em \mathrm{in}\ \mathrm{year}\hskip0.42em t}. $
- SevereMisconductFreq
-
$ \frac{\begin{array}{l}\mathrm{No}.\ \mathrm{of}\ \mathrm{criminal}\ \mathrm{or}\ \mathrm{civil}\ \mathrm{misconduct}\ \mathrm{occurrences}\\ {}\hskip10em \mathrm{at}\hskip0.42em \mathrm{firm}\hskip0.42em f\hskip0.42em \mathrm{in}\ \mathrm{year}\hskip0.42em t\end{array}}{\mathrm{No}.\ \mathrm{of}\ \mathrm{advisers}\ \mathrm{employed}\hskip0.42em \mathrm{by}\hskip0.42em \mathrm{firm}\hskip0.42em f\hskip0.42em \mathrm{in}\ \mathrm{year}\hskip0.42em t}. $
- StateCorruption
-
State-level crime rate based on Glaeser and Saks (Reference Glaeser and Saks2006).
- StayMisconductFreq
-
$ \frac{\begin{array}{l}\mathrm{No}.\ \mathrm{of}\ \ \mathrm{advisers}\hskip0.42em \mathrm{who}\hskip0.42em \mathrm{committed}\ \mathrm{misconduct}\\ {}\hskip1em \ \mathrm{in}\ \mathrm{year}\hskip0.42em t\hskip0.42em \mathrm{and}\ \mathrm{remained}\ \mathrm{employed}\hskip0.42em \mathrm{at}\hskip0.42em \mathrm{firm}\hskip0.42em f\end{array}}{\mathrm{No}.\ \mathrm{of}\ \mathrm{advisers}\ \mathrm{employed}\hskip0.42em \mathrm{by}\hskip0.42em \mathrm{firm}\hskip0.42em f\hskip0.42em \mathrm{in}\ \mathrm{year}\hskip0.42em t}. $
- Top100
-
Indicator whether at least one adviser in the honest adviser’s new firm is ranked among Barron’s Top Financial Advisers rankings.


Supplementary Material
To view supplementary material for this article, please visit http://doi.org/10.1017/S0022109026103214.