I. INTRODUCTION
The high interest in ceramic foams has been associated with their unique physical and chemical properties such as low mass, low thermal conductivity, high surface area, high permeability, and corrosion resistance etc. Reference Scheffler and Colombo1–Reference Zhang, He, Zhou, Wang and Fang3 To produce a ceramic foam, many different approaches can be followed: (i) replication of a sacrificial foam template, Reference Schwartzwalder and Somers4 (ii) direct foaming of a liquid slurry, Reference Sepulveda and Binner5 (iii) burn-out of fugitive pore formers, Reference Komarneni, Pach and Pidugu6 (iv) foams from preceramic polymers that cross-link during foaming, Reference Colombo and Hellmann7 (v) foaming of ceramic precursors that undergo a sol-to-gel transition, Reference Fujiu, Messing and Huebner8 (vi) sintering of hollow spheres. Reference Green9 More information one can find in a published book Reference Scheffler and Colombo1 and references therein. One of the most common methods for fabricating the ceramic foams is the replication of polymeric sponges. One of the problems of the replica template method is that the ceramic struts are hollow, due to volatilization of the organic filament used as substrate. Reference Innocentini, Sepulveda, Salvini and Pandolfelli10,Reference Brezny and Green11 This internal void and the flaws present on outer surface due to the difficulty in homogeneously coating the polyurethane foam template leads to the low mechanical strength levels that characterize this type of structure. On the other hand, direct foaming followed by consolidation of the wet foam by gel-casting leads to higher strength than replica foams at the same porosity level, although typically the components possess a somewhat lower permeability. Reference Innocentini, Sepulveda, Salvini and Pandolfelli10 Gel-casting of porous materials was developed as a result of the combination of the gel-casting process and the aeration of ceramic suspensions. Reference Sepulveda and Binner5 Wet foams stabilized by surfactants require a gelling agent to consolidate the foam microstructure before extensive coalescence and disproportionation take place. Historically, the first gelling system was development on the base of acrylamide monomer, which is a neuro-toxin. Reference Sepulveda and Binner5 Hence, processes of reduced toxicity were searched for, and many alternative gelling agents for the gel-casting of foams based on low-toxicity monomers were demonstrated by Ortega et al. Reference Ortega, Sepulveda and Pandolfelli12 New low-toxic monomers were developed by Szafran et al. for gel-casting of dense ceramic components. Reference Szafran, Szudarska and Bednarek13,Reference Szudarska, Mizerski and Szafran14 Alternatively, gel-casting techniques utilizing environmentally friendly biopolymers as gel-formers in manufacturing of ceramic foams were intensively studied. Different biopolymers such as proteins (ovalbumin and bovine serum albumin), Reference Dhara, Pradhan and Bhargava15–Reference Garrn, Reetz, Brandes, Kroh and Schubert18 sucrose, Reference Prabhakaran, Gokhale, Sharma and Lal19 agar, Reference Mouazer, Thijs, Mullens and Luyten20 agarose, Reference Potoczek21 have recently been applied as nontoxic components for the fabrication of gel-cast ceramic foams. Agarose and agar belong to polysaccharides which are formed gel during cooling. On the other hand, proteins form gel during heating. These environmentally friendly polysaccharides and proteins had been recognized as excellent gelling agents not only for alumina foams but for other kinds of cellular ceramic such as hydroxyapatite, calcium phosphate bioceramics, Reference Potoczek22,Reference Cosijns, Vervaet, Luyten, Mullens, Siepmann, Van Hoorebeke, Masschaele, Cnudde and Remon23 glass–hydroxyapatite nanocomposites, Reference Ghomi, Fathi and Edris24 silicon carbide, Reference Mouazer, Thijs, Mullens and Luyten20 cordierite, Reference Santacruz and Moreno25 Ti2AlC, Reference Potoczek, Guzi de Moraes and Colombo26 and Si3N4. Reference Yin, Zhou, Yu, Wang, Zhao, Luo and Yang27
The application fields of porous ceramics having open porosity are filters, drugs carriers, catalyst supports, bone implants, matrixes for metal-ceramic or polymer ceramic interpenetrating composites, etc. Reference Stipniece, Narkevica, Sokolova, Locs and Ozolins28–Reference Ligoda-Chmiel, Potoczek and Śliwa32 For this reason, the main criterion for the applicability of highly porous components possessing open porosity is their permeability and mechanical strength. Despite the fact that much work was done in the past on the development of new monomer systems, polymers or biopolymers as gelling agents for foamed ceramic suspensions, little work was focused on the investigation of biopolymer effects on the permeability of the porous ceramics obtained by the gel-casting technique. Permeability data of gel-cast foams are available mainly for highly porous bodies (65–95%). Reference Ortega, Sepulveda and Pandolfelli12,Reference Mouazer, Thijs, Mullens and Luyten20 In the present work, the extension of permeability changes was analyzed for bodies with wider porosity range prepared by the gel-casting technique using two types of biopolymers: agarose and egg protein.
II. MATERIALS AND METHODS
A. Alumina foams preparation
1. Agarose as a gelling agent
Ceramic suspensions of alumina powder (CT 3000 SG, Alcoa Chemie, Ludwigshafen, Germany, CAS no. 1344-28-1) were prepared to a solid loading of 55 vol% by dispersing them with 0.5 wt% of dispersant (Darvan 821A, R.T. Vanderbilt Company, Inc., Norwalk, California, CAS no. 9003-03-6). Their homogenization was carried out by ball milling using alumina balls and jar. Agarose solutions (2.5–4.0 wt%) were prepared by mixing agarose powder (POCH, Gliwice, Poland, Cat. No. 111720491, CAS no. 9012-36-6) with distilled water followed by heating for 1 h at 95 °C. The agarose solution was added to the 55 vol% alumina slurry maintaining the temperature of all constituents at 60 °C. The final alumina content in ceramic suspension was in the range 31.3–45.9 vol%. Total concentration of active gelling matter in the final slurry was from 0.3 to 1.0 wt% with regard to dry ceramic powder. Addition of nonionic surfactants (Tergitol TMN-10, Sigma-Aldrich Chemie GmbH, Steinheim am Albuch, Germany, CAS no. 60828-78-6 and Simulsol SL-26, Seppic, Puteaux, France, CAS no. 110615-47-9) was necessary to stabilize the foams. The concentration of each surfactant was from 0.20 to 0.34 g/100 mL of slurry. The foamed suspension containing agarose was poured into a mold. The mold was cooled down using flowing cold water (15 °C) to transform the foam from a liquid state to a gelled state. The green bodies were then de-molded and left in room conditions to dry. Sintering was performed at 1600 °C with 2 h soaking time using heating rate of 2 °C/min to 600 °C and then 4 °C/min up to sintering temperature.
2. Ovalbumin as a gelling agent
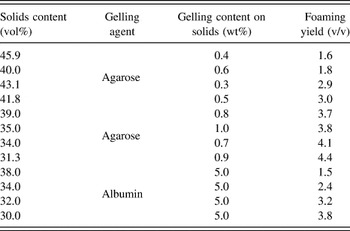
Alumina suspensions were prepared to solids loading of 30–38 vol% by dispersing them with 0.5 wt% of dispersant (Darvan 821A, R.T. Vanderbilt, USA, CAS no. 9003-03-6). Their homogenization was carried out by ball milling using alumina balls and jar. Next, the albumin powder (Egg white albumen, Mw = ∼45,000 g/mol, AppliChem Gmbh, Darmstadt, Germany, CAS no. 9006-59-1), was added to alumina suspensions with amount of 5 wt% (on alumina powder content) and suspensions were stirred at 100 rpm for 30 min to achieve ovalbumin dissolution. Afterward, the slurries were aerated with a double shear mixer at 700 rpm during 5 min to achieve foaming. Tergitol in concentration of 0.2/100 mL slurry was added to stabilize the wet foam. Then, the foams were poured in a cylindrical mold and thermal gelling occurred in a dryer at 80 °C for 2 h because of the cross-linking of amino acids (cysteine), followed by drying at ambient air for approximately 24 h. Sintering was done analogously as in the case of alumina foams gelled using agarose. Table I summarizes the compositional features of all processed samples.
Features of processed samples.

B. Characterization of sintered foams
The relative density and open porosity were determined by water immersion method using Archimedes’ principle, as specified in ASTM C20-00. The theoretical density of fully densified alumina (3.98 g/cm3) was used as a reference to calculate the total volume fraction of porosity.
The microstructure of the produced foams was observed by scanning electron microscopy (SEM), (Jeol Ltd., JSM-5500LV, Tokyo, Japan), and the cell and cell window size were measured by the linear intercept method (ASTM E112-12). When the cells are spherical and uniformly distributed, according to ASTM D3576-98, the relationship between the average measured chord length l and the average sphere diameter D is: D = 1.623 l.
The compressive strength was measured by uniaxial compression (Instron, Norwood, MA) according to the ASTM C133-97 standard. The crosshead speed was 1.0 mm/min. Specimens with a nominal size of 10 × 10 × 20 mm were cut from larger bodies. In all mechanical determinations results were based on average of five samples for each density.
Permeability parameters of the porous bodies were retrieved from experimental data and fitting of Forchheimer’s equation, an empirical relationship well accepted in the literature to express the parabolic dependence of pressure drop (ΔP) with the resulting superficial or face velocity (v s) of fluid through the medium Reference Innocentini, Coury, Fukushima and Colombo33–Reference Zeng and Grigg45 :
 $${{\Delta P} \over L} = {\mu \over {{k_1}}}{v_{\rm{s}}} + {\rho \over {{k_2}}}{v_{\rm{s}}}^2$$
in which L is the medium length or thickness along the macroscopic flow direction, and μ and ρ are respectively the viscosity and density of fluid. The parameters k 1 and k 2 are respectively known as Darcian and non-Darcian permeability coefficients, in reference to Darcy’s law; it is worth noting that k 1 is expressed in square length dimensions, while k 2 is expressed in length dimensions to maintain dimensional consistency in Eq. (1). Both coefficients are considered to be only dependent on pore features (size, volume, morphology, interconnectivity, etc.) and therefore may be used to predict the ∆P × v s profile for other fluids or flow conditions, provided that ρ and μ are corrected in Eq. (1). It is worth noting, however, that k 1 and k 2 for ceramic materials may vary under high temperature flows (>300 °C) due to thermal expansion effects. Reference Innocentini, Chacon, Caldato, Rocha and Adabo35,Reference Barg, Innocentini, Meloni, Chacon, Wang, Koch and Grathwohl36,Reference Innocentini, Rodrigues, Romano, Pileggi, Silva and Coury38
For compressible flow of gases or vapors, ΔP in Eq. (1) must be calculated by:
 $$\Delta P = {{{P_{\rm{i}}}^2 - {P_{\rm{o}}}^2} \over {2P}}$$
in which P i and P o are, respectively, the absolute fluid pressures at the entrance and exit of the medium. P is the pressure for which v s, μ, and ρ are measured or calculated (in this work P = P o ≈ P atm = 95 kPa, T ≈ 29 °C, ρ ≈ 1.1 kg/m3, μ ≈ 1.87 × 10⁻⁵ Pa s).
In this work, permeation experiments were carried out in a laboratory-made apparatus, with tests performed in steady-state regime with dry airflow at room conditions on 3 specimens of each composition. The test specimens (diameter of 33–40 mm and thickness ≈17–28 mm) were sealed with annular rubber rings within a cylindrical sample holder that provided a useful medium diameter of 2.05 cm a circular flow area (A flow) of 3.30 cm2. The pressure drop across the specimen (P i − P o) was measured by a digital manometer (Sper Scientific, model 840083, Scottsdale, AZ) in response to variations in the air volumetric flow rate Q, controlled by a needle valve and measured with a rotameter (Conaut, São Paulo-SP, Brazil) or a soap-bubble flowmeter open to the atmosphere. Flow rate (Q) was corrected to the value at sample exit (Q o) and finally converted to superficial velocity by v s = Q o/A flow. To assess flow anisotropy, tests were performed with air stream sequentially in opposite axial orientations: (a) upflow and (b) downflow by changing valves and connections. Further details of the setup are described elsewhere. Reference Innocentini, Coury, Fukushima and Colombo33,Reference Vakifahmetoglu, Zeydanli, Innocentini, Ribeiro, Lasso and Soraru34
The collected data set (P i, P o, and v s) for each permeation test was fit treated according to the least-square method using a parabolic model of the type: y = ax + bx 2, where y is ΔP [from Eq. (2)] and x is the fluid velocity v s. The permeability parameters were then calculated from the fitted constants a (k 1 = μ/a) and b (k 2 = ρ/b) of Eq. (1).
III. RESULTS AND DISCUSSION
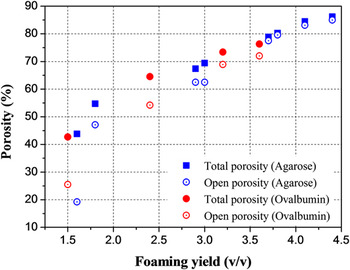
In the method of gel-casting of foams, the porosity depends on the foaming yield, defined as the ratio between the volume of the foam to the volume of the slurry (V foam/V slurry). Foaming yield depends on processing parameters such as solids loading, gelling agent content, stirring rate, and time and surfactant concentration (Table I). Figure 1 gives the total and open porosity of alumina foams after sintering at 1600 °C as a function of foaming yield. In the porosity range for typical foams (>50%) a linear dependence between porosity and foaming yield is observed, which confirms the importance of this parameter to control and predict the final porosity level of bodies.
Total porosity and open porosity as a function of foaming yield for the alumina foams manufactured using agarose or ovalbumin as gelling agents.

The data indicate that the adopted processing conditions led to foams having broad total porosity range (43–86%). For foams having higher porosity range (above 70%) the difference between total and open porosity was not higher than 5%. The difference between open and total porosity was ∼20% when the foam total porosity was below 50%.
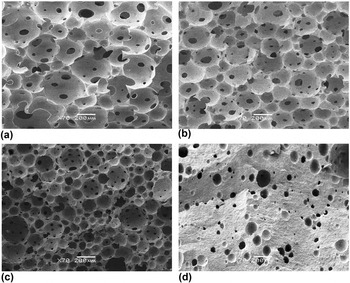
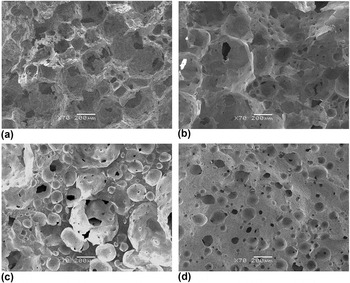
The morphology of the sintered foams manufactured with the use of agarose or ovalbumin as gelling agents is shown in Figs. 2 and 3. The morphology of alumina foams was changed with total porosity. In higher porosity range (70–86%) the obtained foams were typically composed of approximately spherical open cells interconnected by circular windows. For lower porosity range (below 70%) both open and closed cells were observed. Moreover, morphologies of porous samples having total porosity below 50% were more similar to those obtained by burn-out of organic pore-formers method than to typical foams structure. The cell and the window size of the alumina foams prepared using ovalbumin was slightly higher than that obtained for foams gelled using agarose. The difference of the cell and the window size is connected with different gelling mechanisms of the foam prepared using ovalbumin or agarose. Agarose forms gel during cooling. The agarose molecules form physical hydrogel due to the transformation to helical structure at a well-defined transition temperature. On the other hand, proteins form gel during heating. During this process, denaturation of protein takes place and the 3D network is formed to stabilize pore structure of foamed slurry. However, thermal consolidation process makes that the window shape is not near to circular shape as is visible for foams prepared using agarose (Fig. 2), but is more irregular instead (Fig. 3).
Morphology of alumina foams manufactured using agarose as gelling agent having total porosity of: (a) 86%, (b) 80%, (c) 67% and (d) 47%.

Morphology of alumina foams manufactured using ovalbumin as gelling agent having total porosity of: (a) 78%, (b) 73%, (c) 64% and (d) 43%.

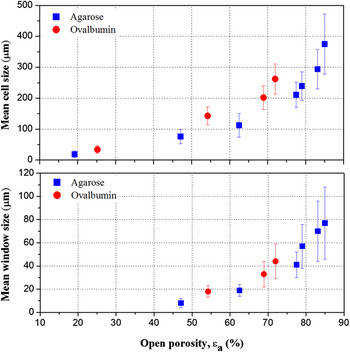
Both cell and windows mean sizes increased according to very clear trends with open porosity, as observed in Fig. 4. It is worth noting that even with a smaller content of gelling agent (0.3–1 wt%), bodies produced with agarose yielded a wider variation in cell size and porosity that bodies prepared with ovalbumin, used in a fixed content of 5 wt%.
Mean cell and window sizes of alumina foams manufactured using agarose or ovalbumin as gelling agents as a function of open porosity. Error bars mean standard deviation of mean cell size and mean window size.

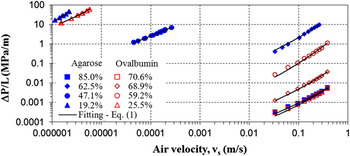
Typical length-normalized pressure drop curves (ΔP/L) obtained in the airflow permeation tests for samples with different gelling agents are given in Fig. 5. The plots are in log scales as wide ranges of air velocities and pressure drops were verified for samples of different porosity levels. Forchheimer’s equation [Eq. (1)] was suitably fitted to experimental data (R 2 > 0.99 in all cases), indicating the contribution of both viscous-linear [μv s/k 1] and inertial-quadratic [ρv s 2/k 2] terms on pressure drop. No important change in ΔP was observed by inverting the flow orientation, what could happen in case of pores with axis-oriented morphology.
Typical pressure drop curves obtained in permeation tests with gel-cast foams (symbols in legend mean open porosity of alumina samples manufactured using agarose or ovalbumin).

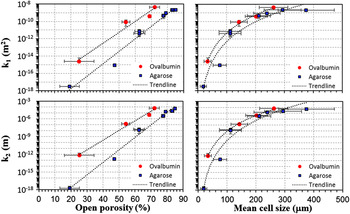
The permeability coefficients retrieved from fitting of Forchheimer’s equation to experimental pressure drop curves are given in Fig. 6. Clear and consistent trendlines were observed with increases of nine orders of magnitude in k 1 (3.2 × 10⁻¹⁸ to 4.3 × 10⁻⁹ m2) and thirteen orders in k 2 (1.8 × 10⁻¹⁸ to 6.5 × 10⁻⁵ m) for an open porosity range of 19–85% and a cell size range of 19–375 μm. Compared to a same open porosity or cell size level, ovalbumin resulted in slightly more permeable foams, although the range achieved by agarose foams was slightly wider. This difference could be ascribed to the shape and the interconnectivity of cells and windows resulting from each gelling agent.
Experimental dependence of permeability coefficients k 1 and k 2 with open porosity and cell size of gel-cast foams prepared with agarose or ovalbumin as gelling agents.

It is worth noting that the literature is plenty of empirical equations to correlate permeability coefficients as a function of microstructural features of porous media. Ergun, in 1952, proposed reliable expressions to describe k 1 and k 2 for loose beds made of spheres, cylinders, tablets, nodules, round sand, and crushed materials (glass, coke, coal, etc.) as a function of the porosity of the bed (ε) and the equivalent particle size (d p) Reference Ergun46 :
 $${k_1} = {{{\varepsilon ^3}{d_{\rm{p}}}^2} \over {150{{\left( {1 - \varepsilon } \right)}^2}{\rm{\ }}}}\quad .$$
 $${k_2} = {{{\varepsilon ^3}{d_{\rm{p}}}} \over {1.75\left( {1 - \varepsilon } \right){\rm{\ }}}}\quad .$$
“Ergun-like” equations have also been adapted to several types of consolidated porous media, including ceramic foams. A common approach in the literature suggests that d p could be replaced by an equivalent pore or cell size, d c, usually represented by the cylindrical form of the hydraulic diameter Reference Innocentini, Sepulveda, Ortega, Scheffler and Colombo39,Reference Biasetto, Colombo, Innocentini and Mullens47 :
 $${k_1} = {{2.25} \over {150}}\varepsilon {d_{\rm{c}}}^2\quad .$$
 $${k_2} = {{1.5} \over {1.75}}{\varepsilon ^2}{d_{\rm{c}}}\quad .$$
In this work, no particular Ergun-like equation was proposed or fitted to correlate permeability coefficients with pore features of gel-cast foams. Nevertheless, data in Fig. 6 confirm that both k 1 and k 2 depended clearly on porosity and cell size according to nonlinear trendlines, which should be further investigated.
A useful and scientific criterium to evaluate the relative importance of k 1 and k 2 in different fluid flow situations is provided by the Forchheimer’s number (Fo), defined as: Reference Innocentini, Faleiros, Pisani, Thijs, Luyten and Mullens37–Reference Innocentini, Sepulveda, Ortega, Scheffler and Colombo39,Reference Innocentini, Tanabe, Aguiar and Coury42,Reference Ruth and Ma43
 $${\rm{Fo}} = {{\rho {v_{\rm{s}}}} \over \mu }\left( {{{{k_1}} \over {{k_2}}}} \right)\quad .$$
Based on the Fo parameter, Eq. (1) can be rewritten as:
 $${{\Delta P} \over L} = {\mu \over {{k_1}}}{v_{\rm{s}}}\left( {1 + {\rm{Fo}}} \right)\quad .$$
The parameter Fo is related to the linearity in the pressure drop curve in the same way that the Reynolds number (Re) is usually related to the laminarity of flow in ducts. By inspection of Eqs. (1), (7), and (8), it is observed that when Fo ≪ 1, only the term [μv s/k 1] is relevant to predict ΔP/L (as stated by Darcy’s law). On the other hand, when Fo ≫ 1, ΔP/L can be reasonably predicted by the term [μv s 2/k 2]. For intermediary flow conditions, the complete Forchheimer’s equation (and thus both coefficients k 1 and k 2) should be used to evaluate ΔP/L reliably. It is also worth noting that Fo depends on the fluid properties (μ and ρ) and for this reason the relationship ΔP × v s could be very different for a same porous sample if the fluid is a gas or a liquid. In this work, the maximum Fo values in each airflow test varied widely from 0.02 to 59 depending on the porosity of the sample. Therefore, a careful analysis of flow conditions and fluid properties must be carried out in each application.
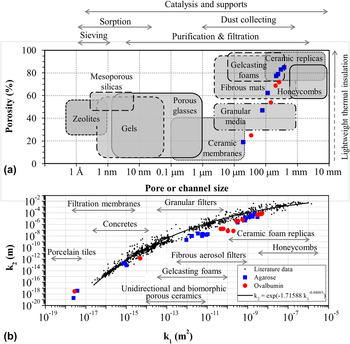
Gel-cast foams can also be compared with other porous materials through the permeability and porosity maps presented in Fig. 7. The map in Fig. 7(a), adapted from Okada et al., Reference Okada, Isobe, Katsumata, Kameshima, Nakajima and MacKenzie48 identifies several groups of materials according to their porosity and pore size levels and the usual applications. Alumina bodies produced in this work not only covered the range of typical gel-cast foams used as scaffolds or catalytic supports, but also included the range of fibrous mats used for aerosol filtration, and granular media and ceramic membranes used in nano, ultra, and micro filtration applications. The map in Fig. 7(b), adapted from Innocentini et al., Reference Innocentini, Sepulveda, Ortega, Scheffler and Colombo39 confirmed the very broad permeability range of produced alumina bodies by controlling the solid content and the type/amount of gelling agent. Structures as low permeable as porcelain tiles (k 1 = 3.2 × 10⁻¹⁸ m2 and k 2 = 1.8 × 10⁻¹⁸ m) were obtained for a 46 vol% solid content and 0.4 wt% content of agarose. On the other hand, highly permeable foams, comparable to ceramic foam replicas (k 1 = 4.3 × 10⁻⁹ m2 and k 2 = 6.5 × 10⁻⁵ m) were produced with a 32 vol% solid content and 5.0 wt% ovalbumin.
Maps of properties and applications of porous ceramics with location of gel-cast samples produced with agarose or ovalbumin as gelling agents: (a) porosity map adapted from Okada et al. Reference Okada, Isobe, Katsumata, Kameshima, Nakajima and MacKenzie48 ; (b) permeability map adapted from Innocentini et al. Reference Innocentini, Sepulveda, Ortega, Scheffler and Colombo39

The clear and univocal trends linking porosity, pore size, permeability, and the wide extension of these properties observed in this work qualify the adopted method to tailor ceramic products with desired features for several applications.
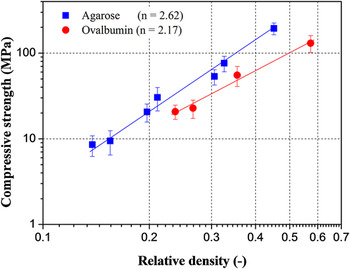
The important criteria for the applicability of highly porous components possessing open porosity include not only permeability but also mechanical strength. The compressive strength of the porous alumina varied within the range 8.5–149.7 MPa, increasing as relative density increased, as shown in Fig. 8. The reduction of the overall solid area as total porosity increased explains this trend, in addition to structural factors intrinsic to the production method, such as changes in strut thickness and shape with density. For the same foam density, the compressive strength of porous alumina manufactured using agarose is a little higher than those manufactured using ovalbumin. The reason probably is connected with the morphological features of alumina foams manufactured using agarose and ovalbumin as gelling agents. For the alumina foams manufactured using agarose the window shape is circular, while for the foams manufactured using ovalbumin the window shape is more irregular (Figs. 2 and 3).
Compressive strength of the alumina foams versus relative density.

The experimental data presented in Fig. 8 are also compared with the behavior that is expected for completely open-cell and closed-cell foams according to Gibson and Ashby model. Reference Gibson and Ashby2 Gibson and Ashby Reference Gibson and Ashby2 model indicates that the compressive strength of a cellular material is related to its relative density via the expression:
 $$\sigma = {\sigma _{\rm{s}}}C{\left( {{\rho \mathord{\left/ {\vphantom {\rho {{\rho _{\rm{s}}}}}} \right. \kern-\nulldelimiterspace} {{\rho _{\rm{s}}}}}} \right)^n}\quad ,$$
in which σ is the compressive strength of the foam, σs is the compressive strength of strut and cell-wall material, (ρ/ρs) is the relative density of the material, C is the dimensionless constant and n is an exponent (n = 1.5 for open cell foams or n = 2.0 for closed-cell foams).
The data presented in Fig. 8 show a relative density exponent n = 2.62 ± 0.13 (R 2 = 0.9850) for the alumina foams manufactured using agarose as a gelling agent and n = 2.17 ± 0.19 (R 2 = 0.9835) for foams manufactured using ovalbumin. These values are more than that predicted by Gibson–Ashby model. This is because the model considers foams with constant cell size, whereas the cell size in this work is a function of the foam density. Besides this, the strut thickness and shape of cells and windows changes with density.
IV. CONCLUSIONS
The use of agarose or ovalbumin as gelling agents was proved a valuable tool to produce alumina gel-cast foams with controlled levels of porosity, cell size, permeability, and compressive strength. The use of different agarose or ovalbumin concentration as well as alumina powder content in ceramic suspensions effected the total porosity of the resulting ceramics in the range from 43 to 86%.
The resulting permeability varied widely, matching values typical of porcelain tiles to highly permeable ceramic replicas. Compared to a same porosity level, ovalbumin resulted in bodies with larger cells/windows and hence slightly higher permeability but lower strength levels. Morphologies of bodies having total porosity below 50% were more similar to those obtained by burn-out of organic pore-formers method than to typical foams structure.
ACKNOWLEDGMENTS
The work has been financially supported by the Faculty of Chemistry of Rzeszów University of Technology (U-594/DS) and by CNPq (Brazilian National Council for Scientific and Technological Development) under the project 303962/2015-1.