Introduction
Village chickens have been kept for millennia under traditional management practices of smallholder farmers; therefore they are adapted to a wide range of ecological settings. They are characterized by non-descript and hyper-variable phenotypic landscape (Orheruata, Adegite and Okpeku, Reference Orheruata, Adegite and Okpeku2006; Halima et al., Reference Halima, Neser, van Marle-Koster and de Kock2007; Dana et al., Reference Dana, Dessie, van der Waaij and van Arendonk2010a; Egahi et al., Reference Egahi, Dim, Momoh and Gwaza2010; Melesse and Negesse, Reference Melesse and Negesse2011). They show striking morphological variations in plumage colour and pattern, comb shape, earlobe colour, shank colour, etc. (Orheruata, Adegite and Okpeku, Reference Orheruata, Adegite and Okpeku2006).
Studies conducted in the early twentieth century confirmed a Mendelian mode of inheritance pattern in these visual traits (e.g. Bateson, Reference Bateson1909; Punnett, Reference Punnett1923). It has been substantiated that single comb (the wild type) is recessive to all comb types; except the comb-less variant. The causative genetic variants for some of these morphological traits were mapped to their respective genomic regions (e.g. Dorshorst, Okimoto and Ashwell, Reference Dorshorst, Okimoto and Ashwell2010; Wragg et al., Reference Wragg, Mwacharo, Alcalde, Hocking and Hanotte2012). Segregation of these traits in village chickens has been influenced by a long lasting practice of uncontrolled breeding and this has provided a unique and powerful resource for genetic mapping (Wragg et al., Reference Wragg, Mwacharo, Alcalde, Hocking and Hanotte2012). Moreover, this genetic structure provides an opportunity to study the effect of artificial selection and ecological landscape on the morphological structure of domestic fowl.
The origin and status of this diversity, however, remains largely unknown and the influence of natural and/or artificial selection on morphological diversity of village chickens has not been sufficiently studied. However, it is strongly believed that the multipurpose function of village chickens has played its own role in shaping this phenotypic diversity. This is indeed true, because, such diversity is important for them to survive in resource-limited production systems with hostile environmental settings. This high phenotypic diversity has been partly induced by the act of uncontrolled breeding. This represents the main difference observed between village chickens and their commercial and fancy counterparts that have been selected for decades to produce phenotypically standardized populations.
Genetic improvement of village chickens for production traits is exceptionally rare (Dessie et al., Reference Dessie, Taye, Dana, Ayalew and Hanotte2011). However, there is some sort of selection on visual traits even by smallholder farmers who keep chickens not only for their direct use values such as egg and meat production but also to satisfy their visual appeal and to meet their cultural and religious needs (Dessie and Ogle, Reference Dessie and Ogle2001; Dana et al., Reference Dana, Dessie, van der Waaij and van Arendonk2010a; Melesse and Negesse, Reference Melesse and Negesse2011). To meet their personal preferences, individuals and/or communities commonly have their own preference rankings for visual traits. However, showing an inclined type of preference towards some variants of morphology is not uncommon. This type of selective breeding practice has been used to maintain and increase the frequencies of particular phenotype(s) for the preferred traits (Bartels, Reference Bartels2003). Smallholder farmers usually have broad breeding objectives to fulfil their versatile needs (Dana et al., Reference Dana, van der Waaij, Dessie and van Arendonk2010b; Moges, Mellesse and Dessie, Reference Moges, Mellesse and Dessie2010) through keeping flocks of diverse phenotypes. This study was intended at dissecting village chickens' morphological structures and to elicit farmers' preferences for visual traits.
Materials and methods
The study sites
The study sites include Horro district (37°01′E to 37°12′E longitudes and 9°55′N to 9°77′N latitudes, recorded for the study villages only) from Western Ethiopia and Jarso district (42°10′E to 42°16′E longitudes and 9°25′N to 9°41′N latitudes) from Eastern Ethiopia. These two study sites are ~870 km apart and are known by their noticeable differences in farming systems and ecological landscapes. Horro district is characterized by a sub-humid type of agro-ecological zone and food self-sufficiency. According to Horro District Office of Agriculture's unpublished data, the average annual rainfall is 1 685 mm (ranging from 1 300 to 1 800 mm) and average annual temperature is 19 °C (from 14 to 24 °C). Majority of the inhabitants are Christians (~98 percent) and the agricultural (rural) population accounted for 88 percent of the district's human population. It consists of 21 rural villages. It is typically characterized by a cereal dominated crop livestock mixed farming system. Livestock and livestock products are among the main sources of on-farm incomes. The major types of crops grown are maize, teff (Eragrostis tef), noug (Guizotia abyssinica), wheat, barley, faba bean and peas. The livestock species kept by farmers in descending number of counts include cattle, sheep, chickens, goats, horses and donkey. The major soil types are redzinas, haplic and luvic phaeozems.
Similarly, unpublished data obtained from Jarso District Office of Agriculture show that Jarso district is characterized as a semi-arid agro-ecological zone and food deficient. The average annual rainfall is 700 mm (from 600 to 900 mm) and the average temperature is 21 °C (from 14 to 24 °C). Unlike Horro district, nearly all the inhabitants are Muslim (99 percent). It has 18 rural villages. It is characterized by undulating and degraded landscape. Majority of the farmers earn their living from khat (Catha edulis) and Irish and sweet potatoe production, and petty trading. Livestock species reared by farmers in descending number of counts are chickens, cattle, sheep, goats, donkeys, camels and a few feral horses. The main soil types include lithosols, vertic luvisols, eutric regosols, vertic cambisols and eutric fluvisols.
The study populations
According to the respective district agriculture offices, the total number of chickens found in Horro and Jarso were 38 776 and 62 829, respectively. Both chicken populations subsist on scavenging and mating is uncontrolled and in most instances random.
Sampling methods
The study sites were selected based on their wide variations in socio-economic and agro-ecological settings. A reconnaissance tour was made in both districts to identify sampling units (villages). A pilot study was conducted to gain hands on experience on sampling and data collection practices. Villages that are found nearby town centres were excluded from sampling to keep at minimum the influence of urban affiliated farming systems on a typical rural village-based chicken management system. Only farmers that keep indigenous chickens were visited. From each district two market sheds were selected and each market shed was represented by two villages. Accordingly, we sampled eight villages with four from each district. Equal numbers of households were visited in each village, market shed and district. The data were collected twice in 2011 (from April to June and from October to November).
Twenty-five households were sampled from each village during each field visit and two adult chickens over ~6 months of age were sampled from each household. Sampled chickens were snapshot and scored for unique morphological variants. Households and chickens were selected from the list of farmers in a village and from a family flock, respectively, using random table numbers. This was done when more than two adult birds met our selection criteria. However, when flock size was small, two adult chickens were directly sampled. In the absence of a cock, two hens were sampled. Using this strategy, we sampled 798 chickens (400 in Horro and 398 in Jarso district) from 399 households (200 from Horro and 199 from Jarso district).
Data sources
Multiple photographs of each chicken were taken from lateral, front and dorsal sides besides the details of the head and leg regions. Morphologies were scored in the field by direct physical observation and by looking at individual photographs. Owing to the rudimentary and ambiguous nature of hens' comb, we analysed this trait for cocks only. Moreover, chicken owners were briefly interviewed for their preferences for comb shape and shank colour, and to state their reasons for preferences they have made. Earlobe has no equivalent local name and farmers do not value of this trait while selecting their breeding stocks. Therefore, variation in earlobe colour in the study sites could be under the influence of breeding history and natural selection.
Data management and analysis
Dependent variables were analysed using the non-parametric Chi-square test in R (R Core Team, 2012). Logistic regression analysis in SPSS (2007) was used to analyse binomial type response variables (Equation 1).
 $$L_i = {\rm In}\left[{\displaystyle{{\,p_i } \over {1 - p_i }}} \right]\comma \;$$
where p i is the probability of the presence of a phenotype, 1−p i the probability for the absence of a phenotype and L i the natural log of odds ratio. This model used district as a classifying variable.
Cramer's V (Equation 2) as estimated using SPSS (2007) was used to test possible association between three pigmentation traits (earlobe colour, shank colour and beak colour) and the association between district and four morphological traits (crest, earlobe colour, shank colour and beak colour).
 $$V = \sqrt {\displaystyle{{\chi ^2 } \over {n\lpar k - 1\rpar }}}\comma \;$$
where V is Cramer's V, n the total number of observations and k the number of studied traits.
Correspondence analysis (CA) was used to visualize the discriminating power of earlobe colour, shank colour, beak colour and crest variants using CA Package (Nenadić and Greenacre, Reference Nenadic and Greenacre2007) as implemented in R (R Core Team, 2012).
Equation (3) was used to analyse the effect of three explanatory variables on live weight of the sampled chickens using SPSS (2007):
 $$y = \mu + A + B + C + A^{\ast} B + A^{\ast} C + B^{\ast} C + e\comma \;$$
where y is the live weight of a chicken, μ the common mean, A, B and C representing sex, location and sampling slot, respectively, and e the residual term.
Results
Counts of sampled chickens
We sampled 160 cocks and 240 hens from Horro district (cock to hen ratio of 1:1.5) and 121 cocks and 277 hens (1:2.29) from Jarso district, though our sampling strategy favoured sampling of more number of hens. This difference in the ratios was because of frequent absence of cocks in flocks sampled from Jarso (χ 1 2 = 5.22; P = 0.022). Sampling less number of cocks than hens is not unusual in village chickens, because in most instances cocks are the ones that are slaughtered for religious and/or cultural ceremonies, to welcome guests and to meet family's dietary protein need. Moreover, cocks are sold out more frequently to cover incidental expenses.
Comb-shape variants
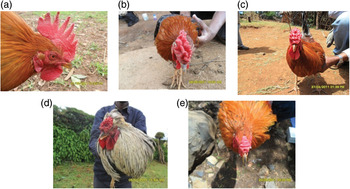
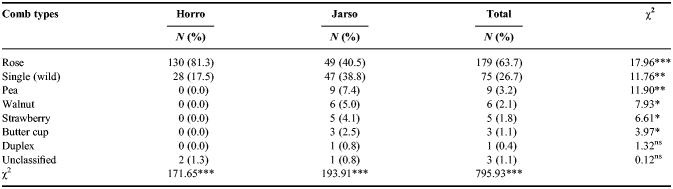
We observed seven types of comb shapes (single, buttercup, duplex, pea, rose, strawberry and walnut) across the two districts (Table 1 and Figure 1a–e). The proportions of different types were significantly different (χ7 2 = 802.07; P < 0.001). However, we left a few ambiguous comb shapes unclassified (n = 3). In Horro, cocks' comb shapes were limited to rose and single types, whereas other comb types, though rare, were observed in Jarso cocks. Mutant comb types were more common than the single comb as of the wild-type, i.e. 73.3 percent (n = 206) versus 26.7 percent (n = 75) (χ 1 2 = 61.07; P < 0.001). Single comb was found in 28 of Horro and 47 of Jarso cocks (χ 1 2 = 11.76; P = 0.001). The logistic regression analysis also shows that the chance of finding single-combed cocks in Horro district is less likely by the order of 66 percent.
Comb types: (a) single, (b) pea, (c) rose, (d) strawberry and (e) walnut.

Observed count differences in cocks' comb variants within and between districts.

nsNot significant; *P < 0.05; **P < 0.01; ***P < 0.001.
Comb-shape preferences
Farmers have a dichotomous type of classification and preference for comb-shape variants. This preference has been made between single and the rest of comb types. This shows that farmers do not care so much the details of morphological differences observed among mutant comb types. We found that 98 percent of Horro and 89.5 percent of Jarso farmers preferred to have non-single combed chickens (χ1 2 = 0.39; P = 0.535). Preferences of comb shapes were dictated by reasons described in Table 2.
Stated reasons for comb type preferences of farmers.

nsNot significant; *P < 0.05; **P < 0.01; ***P < 0.001.
Ear tuft and variants of other Mendelian traits
Rudimentary types of ear tufts were observed in all sampled chickens despite slight variations in their size and appearance. However, multiple spur, polydactyl, heterodactyl, syndactyly and bantam chickens were not found. Only one naked neck chicken (not picked up by random sampling) was found in Horro district. The absence of naked neck birds might be associated with high elevation of the study districts (higher than ~2 000 m above sea level for all sampled villages). Farmers also showed no preference for the naked neck phenotype. Their main reasons were lack of visual appeal (58.0 percent); unfamiliarity (41.0 percent) and low market demand (12.4 percent). Farmers also considered that naked neck chickens are affected by cold weather and rain (3.8 percent) and they are more vulnerable to predators (1.9 percent).
Tufted crest
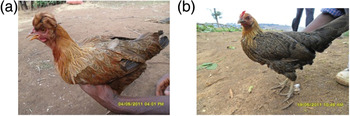
Tufted crest (Figure 2) was commonly observed in hens (n = 106, 83.5 percent) than cocks (n = 21, 16.5 percent) (χ 1 2 = 55.82, P < 0.001). This is a typical characteristic feature of sex-influenced traits. Logistic regression analysis also shows that the likelihood of being crestless in cocks is more likely by 77.3 percent than in hens. Moreover, the chance of finding crested chickens in Horro district was ~10.5 times more likely than in Jarso district. The proportion of crested phenotype recorded for both districts was 16.1 percent (127/791) and this shows the abundance of crestless chickens (χ 1 2 = 364.56, P < 0.001). In Horro district, 111 crested chickens (27.9 percent, 111/398) were sampled, whereas there were 16 (4.1 percent, 16/393) only in Jarso district (χ 1 2 = 69.87, P < 0.001).
Crest: (a) crested hen and (b) crestless hen.

Earlobe colour
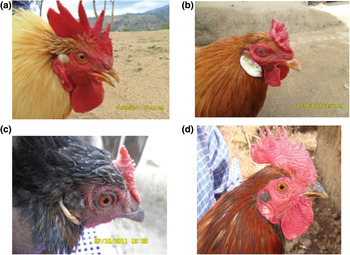
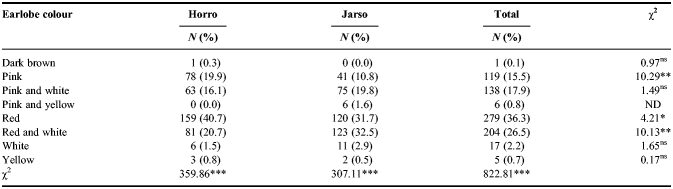
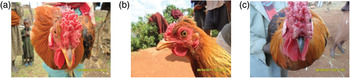
The village chickens display high diversity in earlobe colouration (Figure 3a–d). For example, we found red and pink earlobes that are mingled or peppered with varying proportions of white and yellow colours. This made the classification of earlobe colours into distinct phenotypic classes challenging. Therefore, we grouped them into broader phenotypic classes by pooling closely related ones to a single slot (Table 3).
Earlobe colour: (a) red, (b) white, (c) yellow and purple and (d) white-spotted red.

Earlobe colour variants of the chicken populations.

nsNot significant; *P < 0.05; **P < 0.01; ***P < 0.001; ND, not done.
Beak colour
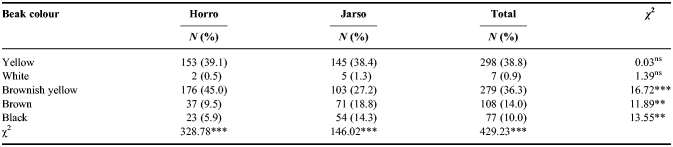
Usually the two horny mandibles of chickens' beak display variations in their colour. The lower mandible is usually brighter than the upper one and this creates a mosaic appearance. This might be because of continuous exposure of the upper part of the beak to direct sunlight besides the differential act of location-specific biochemical processes. Observed beak colour phenotypes are presented in Table 4 and are displayed in Figure 4a–c.
Beak colour: (a) brownish yellow, (b) yellow and (c) black.

Beak colour variants observed in the chicken populations.

nsNot significant; **P < 0.01; ***P < 0.001.
Shank colour
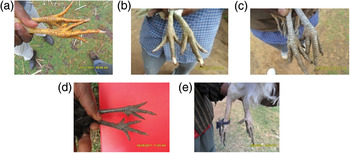
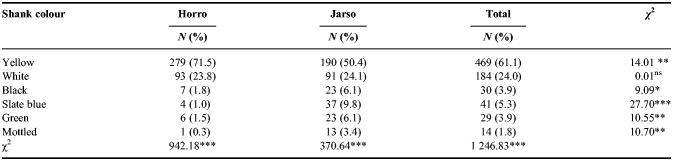
The commonest shank colours were yellow and white, whereas the rare variants included slate blue, green, black and brown (Table 5 and Figure 5a–e). Out of 14 mottled shanks observed, 13 of these were found in Jarso district (χ 1 2 = 10.70, P = 0.001). Dark shanks (black, slate blue and willow green) were also relatively more frequent in Jarso than Horro district (χ 1 2 = 47.90, P < 0.001).
Shank colour: (a) yellow, (b) green, (c) slate blue, (d) black and (e) white.

Observed phenotypes of shank colour.

nsNot significant; *P < 0.05; **P < 0.01;***P < 0.001.
Preference of shank colour
Farmers were asked to rank their favourite shank colour namely white, yellow or black (slate blue) using a pre-coded checklist; however, a few farmers mentioned red shank as an additional variant. This represents a deep yellow shank that has vertical streaks of light pink bands. Farmers showed highly skewed preferences towards yellow shank (Table 6).
Preferences of farmers to shank colour types.

nsNot significant; ***P < 0.001.
Feathered shank and spur
Lightly feathered shank (ptilopody, Figure 6) was rarely found, and only 2.1 percent (17/798) of all the sampled chickens had this phenotype (χ 1 2 = 731.44, P < 0.001). This included seven from Horro district (1.8 percent, 7/400, χ 1 2 = 372. 49, P < 0.001) and 10 from Jarso district (2.5 percent, 10/398, χ 1 2 = 359.0 1, P < 0.001). However, difference in the proportions of ptilopody between the two districts was not significant (χ 1 2 = 0.54, P = 0.461). A well grown spur was observed in cocks whereas it was rudimentary in most of the sampled hens (data not shown). Length of spur is usually influenced by age of the bird, the older the bird, the longer the spur.
Feathered shanks.

Correspondence analysis of qualitative traits
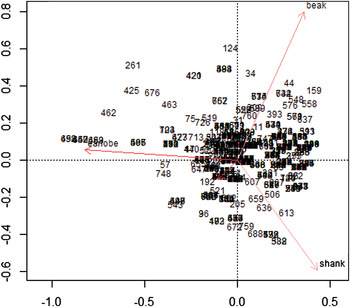
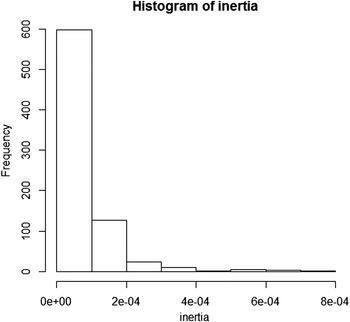
The summary function of CA analysis (Nenadić and Greenacre, Reference Nenadic and Greenacre2007) showed that the three (the original variables (four morphological traits) minus one) principal inertias (eigenvalues) accounted for 56.54, 24.96 and 18.5 percent of the total variance (the corresponding values were 0.029, 0.013 and 0.009, respectively). Most of the study birds were tightly clustered (Figure 7). Variations of earlobe colour, shank colour, beak colour and crest explained 39.4, 20.2, 23.3 and 17.1 percent of the total inertia, respectively (with inertia values of 0.020, 0.010, 0.012 and 0.009, respectively). This shows that despite its binary nature, crest variation contributed to a substantial part of the total variance. Only a few outlier birds showed higher inertia whereas for most of the sampled birds, individual difference for traits considered was found to be weak (Figure 8). All the four traits showed coordinates of different signs (direction of the arrows) and this indicated the presence of weak correlation among them.
A CA plot obtained from earlobe, shank and beak colours and crest variants of sampled chickens. Serial numbers 1–391 and 392–769, respectively, represent Horro and Jarso chickens.

Frequency distribution of eigenvalues (inertias) explained by individual birds.

Relationship between qualitative traits
Cramer's V test revealed that the three morphological traits, which were characterized by different colour variants showed low but statistically significant relationships, i.e. earlobe versus shank colour (0.230, P < 0.001); earlobe versus beak colour (0.122, P = 0.003) and beak colour versus shank colour (0.266, P < 0.001). Cramer's V analysis also showed statistically significant association between district and variants of crest (0.324, P < 0.001), earlobe colour (0.230, P < 0.001), shank colour (0.331, P < 0.001) and beak colour (0.320, P < 0.001).
Live weight
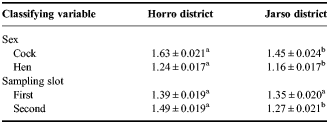
District and sex showed significant effects on the live weight of sampled chickens (Table 7) (P < 0.001), however, sampling slot did not affect the live weight (P = 0.483). The interaction effect between location and sex (P = 0.017) and location and sampling slot were significant (P < 0.001), however, the interaction between sex and sampling slot was not visible (P = 0.396). We found an R 2 value of 32.41 percent from the fitted model. This showed that the remaining variation in live weight was explained by hidden environmental factors and an individual and/or population-based genetic differences.
Least square means (LSM ± S.E) for live weight (kg) of the chicken populations.

Superscripts that appeared with different alphabets across row show statistically significant difference at P < 0.01.
Discussion
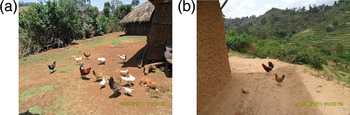
Morphology refers to the outward appearance of an organism and it can be used to group members of a population into sub-groups. Morphological variations (Figure 9) have been a subject of thorough studies owing to its importance in evolutionary biology and socio-economic life of subsistence farmers. For example, the interviewed farmers showed highly skewed preferences for particular kinds of birds than others, which substantiate its importance.
The non-descript scavenging chicken and their natural habitat: (a) Horro chickens and (b) Jarso chickens.

Variants of comb shape
Rareness of single comb (26.7 percent) found in our study is inconsistent with the report of Melesse and Negesse (Reference Melesse and Negesse2011) for southern Ethiopian chickens (55.0 percent). Moreover, high proportion of single comb was reported for Shelleng and Song (96.45 percent, Apuno, Mbap and Ibrahim, Reference Apuno, Mbap and Ibrahim2011), Dekina (51 percent, Daikwo, Okpe and Ocheja, Reference Daikwo, Okpe and Ocheja2011) and Edo State chickens (92 percent, Orheruata, Adegite and Okpeku, Reference Orheruata, Adegite and Okpeku2006) from Nigeria, and for Desi chickens of Bangladesh (97 percent, Bhuiyan, Bhuiyan and Deb, Reference Bhuiyan, Bhuiyan and Deb2005). This commonness might be associated with special importance of this phenotype to adapt to warm climates and possibly because of variations in culture and religion. For example, the southern Ethiopia region is dominated by Protestant Christians (55.5 percent, FDREPCC, 2008) and the dogma of this religion is strictly against sacrificial offerings and associated practices. Hence people living in this part of Ethiopia are most likely not worried about comb type. High demand for mutant-type comb shapes observed elsewhere in Ethiopia (Dessie and Ogle, Reference Dessie and Ogle2001; Dana et al., Reference Dana, Dessie, van der Waaij and van Arendonk2010a; Moges, Mellesse and Dessie, Reference Moges, Mellesse and Dessie2010) is of limited importance in this region. However, in line with our findings, Dana et al. (Reference Dana, Dessie, van der Waaij and van Arendonk2010a) reported a low averaged proportion of single comb phenotype in five indigenous chicken populations (13 percent). Similarly, Dong Xuan et al. (Reference Dong Xuan, Szalay, Su, Tieu and Dang Vang2006) reported a low frequency of single comb in Dong Tao chickens in Vietnam (10 percent). We found that single comb was relatively more common in Jarso (38.8 percent) than Horro chickens (17.5 percent). This is because Jarso is almost entirely inhabited by Muslims who hardly sacrifice chickens for cultural and/or ritual purposes. This traditional practice otherwise requires sacrifice of non-single combed chickens in the context of Ethiopian tradition (Moges, Mellesse and Dessie, Reference Moges, Mellesse and Dessie2010).
Dong Xuan et al. (Reference Dong Xuan, Szalay, Su, Tieu and Dang Vang2006) reported pea comb as the commonest variant (90 percent) in Vietnamese Dong Tao chickens. Similarly, Dana et al. (Reference Dana, Dessie, van der Waaij and van Arendonk2010a) reported pea comb as a common variant in Horro chickens, however, we hardly found this phenotype in the same population. Halima et al. (Reference Halima, Neser, van Marle-Koster and de Kock2007) also reported pea comb as a common variant in northwestern Ethiopia chickens. In line with our findings, rareness of pea comb was reported in Beninese chickens (Youssao et al., Reference Youssao, Tobada, Koutinhouin, Dahouda, Idrissou, Bonou, Tougan, Ahounou, Yapi-Gnaoré, Kayang, Rognon and Tixier-Boichard2010). The presence of v-shaped comb was reported in 13.4 percent of northwestern Ethiopian chickens (Halima et al., Reference Halima, Neser, van Marle-Koster and de Kock2007), however, it was rarely seen in this study. We found rose comb as the commonest variant and this partly agrees with Melesse and Negesse (Reference Melesse and Negesse2011) who reported rose comb as the second most common variant. However, all these findings should be treated with caution owing to inconsistencies in the definition of comb types.
Farmers' preference for comb shape
Mutant comb types are mostly preferred by farmers and consumers in Ethiopia. For example, 81.1 percent of farmers in northwestern Ethiopia showed preference to mutant-type combs, which is comparable with our findings (Moges, Mellesse and Dessie, Reference Moges, Mellesse and Dessie2010). Sizable proportion of farmers (36.4 percent) also included cultural and religious values in their breeding objectives (Moges, Mellesse and Dessie, Reference Moges, Mellesse and Dessie2010) and this has also been reflected in our findings on comb type and shank colour preferences. A quarter of the interviewed farmers in central highlands of Ethiopia also used chickens for sacrificial and healing purposes (Dessie and Ogle, Reference Dessie and Ogle2001). This indicates the special importance of morphological traits in fulfilling cultural and religious needs. This is common because plumage colour and pattern, sex, comb shape and age have been used as the main criteria to slaughter chickens (cocks) for cultural and religious ceremonies (Dessie and Ogle, Reference Dessie and Ogle2001). Variation in different combinations of these traits in turn determines market demand and price. Most likely inclusion of morphological traits as selection criteria has been driven by such demand (Muchadeyi et al., Reference Muchadeyi, Wollny, Eding, Weigend and Simianer2009; Dana et al., Reference Dana, van der Waaij, Dessie and van Arendonk2010b; Moges, Mellesse and Dessie, Reference Moges, Mellesse and Dessie2010).
Muchadeyi et al. (Reference Muchadeyi, Wollny, Eding, Weigend and Simianer2009) noted that in some instances chickens were culled based on their comb shape and plumage colour. This shows the influence of artificial selection on morphological structure of village chickens. Systematic culling of single-combed chickens through sale and ordinary consumptive slaughter is common in Ethiopia. Elsewhere in Ethiopia this has been practiced for centuries to reduce the frequency of this phenotype in a breeding flock. Owing to its homozygous recessive expression pattern, sizable reduction in allelic frequency can be easily achieved through continuous culling.
Through the continuous practices of skewed selection for Mendelian traits such as comb shapes, farmers indirectly affect metric traits influenced by pleiotropic effect of loci controlling the expression of Mendelian traits. For example, the homozygous rose is known to reduce fertility (Crawford and Smyth, Reference Crawford and Smyth1964) and pea comb is noted to reduce tissue mass (see Wright et al., Reference Wright, Boije, Meadows, Bed'hom, Gourichon, Vieaud, Tixier-Boichard, Rubin, Imsland, Hallbook and Andersson2009 for a review). Significant phenotypic correlations observed between some morphological traits indicates the influence of farmers' selection for a trait on the associated traits. This can be also seen from ecological adaptation perspectives. For example, in elevated highland areas that experience temperate-like weather, chickens having mutant comb types that are characterized by reduced surface area might be better adapted owing to reduction in heat loss (see Wright et al., Reference Wright, Boije, Meadows, Bed'hom, Gourichon, Vieaud, Tixier-Boichard, Rubin, Imsland, Hallbook and Andersson2009 for pea comb).
Crested versus crest-less chickens
The rareness of crest reported in Nigerian (17.03 percent, Egahi et al., Reference Egahi, Dim, Momoh and Gwaza2010) and Ugandan chickens (12 percent, Ssewannyana et al., Reference Ssewannyana, Ssali, Kasadha, Dhikusooka, Kasoma, Kalema, Kwatotyo and Aziku2008) are in line with our findings. Dana et al. (Reference Dana, Dessie, van der Waaij and van Arendonk2010a) also reported an average proportion of 34 percent of crested chickens (ranging from 1 to 75 percent) for five chicken populations in Ethiopia, particularly 33 percent for Horro chickens, which is comparable with our findings for the same population (27.9 percent). However, Halima et al. (Reference Halima, Neser, van Marle-Koster and de Kock2007) reported a higher proportion of crested chickens (48.8 percent) in northwestern Ethiopia. The frequency of this trait showed variation among geographical locations. For example, it was rare in south and southwestern Ethiopia compared with northwestern and western Ethiopia (Dana et al., Reference Dana, Dessie, van der Waaij and van Arendonk2010a). This variation has been also observed between our populations. Wang et al. (Reference Wang, Gao, Imsland, Gu, Feng, Liu, Song, Tixier-Boichard, Gourichon, Li, Chen, Li, Andersson, Hu and Li2012) noted a voluminous crest in cocks than in hens, however, a completely different situation has been observed in this study. For example, we observed a low proportion of cocks showing the rudimentary form of this phenotype.
Variants of earlobe colour
In line with our findings: earlobe, comb and wattle colours are commonly red in fancy chickens (Wragg et al., Reference Wragg, Mwacharo, Alcalde, Hocking and Hanotte2012). We observed earlobe colours different from the only single-coloured types reported for southern Ethiopian chickens (Melesse and Negesse, Reference Melesse and Negesse2011). Red and pink earlobes mingled or peppered with varying proportion of white colour were present in both study districts. In agreement with our findings, some Kenyan indigenous chicken populations were characterized by intermingled red and white earlobe colours (Kingori, Wachira and Tuitoek, Reference Kingori, Wachira and Tuitoek2010). The proportion of white earlobe colour that we found (2.2 percent) is much lower than the one observed in Beninese Forest type (60.8 percent) and Savannah-type chickens (45.1 percent) (Youssao et al., Reference Youssao, Tobada, Koutinhouin, Dahouda, Idrissou, Bonou, Tougan, Ahounou, Yapi-Gnaoré, Kayang, Rognon and Tixier-Boichard2010), Nigerian chickens (73.21 percent, Egahi et al., Reference Egahi, Dim, Momoh and Gwaza2010) and Ugandan chickens (48 percent, Ssewannyana et al., Reference Ssewannyana, Ssali, Kasadha, Dhikusooka, Kasoma, Kalema, Kwatotyo and Aziku2008). White earlobe is a characteristic feature of chickens of the Mediterranean region (FAO, 2010). Comparable with our findings, Orheruata, Adegite and Okpeku (Reference Orheruata, Adegite and Okpeku2006) from Edo State in Nigeria reported red earlobe colour as the commonest one (60 percent), however, reasonably higher proportion of white earlobe (39 percent) was also observed in this population. Red earlobe was once reported as the second most frequent one (47 percent) in Ugandan chickens (Ssewannyana et al., Reference Ssewannyana, Ssali, Kasadha, Dhikusooka, Kasoma, Kalema, Kwatotyo and Aziku2008). Vij, Tantia and Vijh (Reference Vij, Tantia and Vijh2006) reported brown earlobe as the commonest variant in Punjab brown chickens, however, we found only a single bird (0.1 percent) showing this phenotype. Earlobe was prominently seen in all the sampled chickens, however, it was not clearly visible in the majority (64 percent) of Ugandan chickens (Ssewannyana et al., Reference Ssewannyana, Ssali, Kasadha, Dhikusooka, Kasoma, Kalema, Kwatotyo and Aziku2008). Despite controversies over the inheritance pattern of this trait (Warren, Reference Warren1928), polygenic and sex-linked patterns have been reported (Warren, Reference Warren1928; Wragg et al., Reference Wragg, Mwacharo, Alcalde, Hocking and Hanotte2012).
Variants of beak colour
Unlike our study populations that had been dominated by brownish yellow beaks, Kenyan indigenous chickens usually have black and dark grey beaks (Kingori, Wachira and Tuitoek, Reference Kingori, Wachira and Tuitoek2010). Beak colour in Punjab brown chickens of India is yellow, however, its upper part turns black as the chicken ages (Vij, Tantia and Vijh, Reference Vij, Tantia and Vijh2006). A comparable type of mosaic beak colour was observed in this study.
Variants of shank colour
We found yellow as the commonest shank colour type (61.1 percent). This is comparable with reports of Halima et al. (Reference Halima, Neser, van Marle-Koster and de Kock2007, 64.4 percent), Dana et al. (Reference Dana, Dessie, van der Waaij and van Arendonk2010a, 60 percent) and Melesse and Negesse (Reference Melesse and Negesse2011, 52.5 percent) from Ethiopia; Daikwo, Okpe and Ocheja (Reference Daikwo, Okpe and Ocheja2011) for Dekina chickens in Nigeria (40.5 percent) and Ssewannyana et al. (Reference Ssewannyana, Ssali, Kasadha, Dhikusooka, Kasoma, Kalema, Kwatotyo and Aziku2008) for Ugandan chickens (42 percent). Moreover, Bhuiyan, Bhuiyan and Deb (Reference Bhuiyan, Bhuiyan and Deb2005) and Orheruata, Adegite and Okpeku (Reference Orheruata, Adegite and Okpeku2006) reported yellow shank as the second most frequent phenotype for Bangladeshi Desi chickens (32 percent) and for Nigerian chickens (30 percent). However, all these findings are inconsistent with Youssao et al. (Reference Youssao, Tobada, Koutinhouin, Dahouda, Idrissou, Bonou, Tougan, Ahounou, Yapi-Gnaoré, Kayang, Rognon and Tixier-Boichard2010) who reported the presence of this phenotype in only 5 percent of Beninese chickens. White shank colour is the second common phenotype in our findings (24.0 percent), and this is comparable with Ugandan chickens (20 percent, Ssewannyana et al., Reference Ssewannyana, Ssali, Kasadha, Dhikusooka, Kasoma, Kalema, Kwatotyo and Aziku2008) and Bangladesh Desi chickens (29 percent, Bhuiyan, Bhuiyan and Deb, Reference Bhuiyan, Bhuiyan and Deb2005). However, white shank was the commonest phenotype in Nigerian chickens (41 percent, Orheruata, Adegite and Okpeku, Reference Orheruata, Adegite and Okpeku2006) and the second commonest type in Beninese chickens (40.1 percent, Youssao et al., Reference Youssao, Tobada, Koutinhouin, Dahouda, Idrissou, Bonou, Tougan, Ahounou, Yapi-Gnaoré, Kayang, Rognon and Tixier-Boichard2010). Unlike our report, reasonably high proportions of dark shanks were reported for a number of village chicken populations in developing countries. These include black shank at 39 percent in Bangladeshi Desi chickens (Bhuiyan, Bhuiyan and Deb, Reference Bhuiyan, Bhuiyan and Deb2005); 42.2 or 29 percent in Nigerian chickens (Orheruata, Adegite and Okpeku, Reference Orheruata, Adegite and Okpeku2006; Egahi et al. Reference Egahi, Dim, Momoh and Gwaza2010) and 21 percent in Ugandan chickens (Ssewannyana et al., Reference Ssewannyana, Ssali, Kasadha, Dhikusooka, Kasoma, Kalema, Kwatotyo and Aziku2008). Slate blue shank is among the rare variants in our populations. This phenotype is, however, the commonest one in Beninese chickens (43.3 percent, Youssao et al., Reference Youssao, Tobada, Koutinhouin, Dahouda, Idrissou, Bonou, Tougan, Ahounou, Yapi-Gnaoré, Kayang, Rognon and Tixier-Boichard2010). Moreover, dark shank colour is a typical characteristic feature of the red jungle fowl (for reviews, see Brisbin and Peterson, Reference Brisbin and Peterson2007 and the references therein). Green shank was rarely seen (3.9 percent) in this study and a comparable proportion (0.5 percent) was reported for Ugandan chickens (Ssewannyana et al., Reference Ssewannyana, Ssali, Kasadha, Dhikusooka, Kasoma, Kalema, Kwatotyo and Aziku2008). However, Halima et al. (Reference Halima, Neser, van Marle-Koster and de Kock2007) reported a higher proportion of green-shanked chickens (12 percent) from northwestern Ethiopia. Rareness of green shank is not surprising, because it is unfavourably correlated with viability (see McGibbon, Reference McGibbon1979 and the references therein). Uniquely, Apuno, Mbap and Ibrahim (Reference Apuno, Mbap and Ibrahim2011) have reported the highest proportion of pink shank (38.8 percent) in Nigerian chickens.
Lightly feathered shank
We sampled 2.1 percent chickens that have feathered shank and this low frequency is invariably confirmed by the report of Melesse and Negesse (Reference Melesse and Negesse2011) (2 percent) and Halima et al. (Reference Halima, Neser, van Marle-Koster and de Kock2007) (2.5 percent) from Ethiopia, and in the work of Ssewannyana et al. (Reference Ssewannyana, Ssali, Kasadha, Dhikusooka, Kasoma, Kalema, Kwatotyo and Aziku2008) on Ugandan chickens (4 percent).
Colours of combs and wattle
In line with our findings (data not shown), almost all combs and wattles of indigenous chickens in Kenya were red, except a few variants spotted with white and black colours (Kingori, Wachira and Tuitoek, Reference Kingori, Wachira and Tuitoek2010). However, we have not found any spotted phenotypes. It is biologically important to study the colour of these two phenotypes because their colours are usually used as indicators of chickens' health and egg laying status (Hume, Reference Hume2011). Moreover, Navara, Anderson and Edwards (Reference Navara, Anderson and Edwards2012) reported a positive correlation between brightness of comb and sperm viability.
The influence of ecological variation and artificial selection
Unlike quantitative traits, environment has little effect on traits that show Mendelian mode of inheritance. However, we found that even qualitative traits that were not under the influence of direct artificial selection were significantly different between the two chicken populations (e.g. some variants of shank, earlobe and beak colours). This might indicate the influence of ecological variation and their breeding history. Moreover, four of the morphological traits (crest, earlobe colour, shank colour and beak colour) showed statistically significant association with district and this shows the influence of ecological landscape on morphological traits. Although the preference of farmers for comb shape and shank colour was not significantly different between study sites, differences in culture and religion possibly have contributed especially to variation in single comb proportions between the two chicken populations. The intra population low frequency of single comb and high frequency of yellow shank possibly indicates the influence of artificial selection. However, as a weak selection pattern of farmers is intended at keeping chickens displaying different phenotypes to meet their multiple needs, a clear-cut morphological difference is not found among village chicken populations.
Proposed reasons for observed morphological differences
Except tufted crest, all other mutations were mostly seen in Jarso chickens. This might be because of the difference in breeding history between these two chicken populations. There are historical and archaeological evidences for earlier settlement of people in northern Ethiopia (e.g. D'Andrea et al., Reference D'Andrea, Richards, Pavlish, Wood, Manzo and Wolde-Kiros2011) and perhaps human settlement in eastern Ethiopia where Jarso district is located had been initiated closer to this historical time point (Betemariam, Reference Betemariam2011). The degraded landscape also indicates a longer history of agriculture in Jarso area. On the other hand, elderly farmers in Horro recalled the very recent (~40 years back) presence of intact dense forest cover in the area, which have now, been cleared for agricultural activities and human settlement. We also noticed that Horro still has patches of dense natural forest cover and the district's land use pattern data has also confirmed an extant cover of ~42.6 percent natural forest. Jarso is closer to the outlet for an ancient trade route between Ethiopia and the Middle East through Red Sea coast – one of the presumed route for the introduction of domestic chickens from their centres of domestications (Blench and Macdonald, Reference Blench, Macdonald, Kenneth and Kriemhild2000). This indicates that domestic chickens might have arrived and the foundation stock most likely founded earlier in Jarso than Horro.
Variation in live weight between two chicken populations
The average live weight of the sampled chickens was 1.54 ± 0.016 kg for cocks and 1.20 ± 0.012 kg for hens and this is comparable with the findings of Melesse and Negesse (Reference Melesse and Negesse2011) (cocks = 1 427 ± 18 g and hens = 1 144 ± 18 g) and Dana et al. (Reference Dana, Dessie, van der Waaij and van Arendonk2010a) (cocks = 1 612 g and hens = 1 266 g) from Ethiopia, and Daikwo, Okpe and Ocheja (Reference Daikwo, Okpe and Ocheja2011) (cocks = 1.32 ± 0.02 kg and hens = 1.05 ± 0.01 kg) for Dekina chickens from Nigeria. However, the average body weight reported by Youssao et al. (Reference Youssao, Tobada, Koutinhouin, Dahouda, Idrissou, Bonou, Tougan, Ahounou, Yapi-Gnaoré, Kayang, Rognon and Tixier-Boichard2010) for Savannah and Forest chickens in Benin (1 177 g for cock and 965 g for hen) and Halima et al. (Reference Halima, Neser, van Marle-Koster and de Kock2007) from Ethiopia (1 259.6 and 847 g for cocks and hens, respectively) are lower than our findings. Higher live weights were reported from Uganda (2.1 kg for cock and 1.4 kg for hen) (Ssewannyana et al., Reference Ssewannyana, Ssali, Kasadha, Dhikusooka, Kasoma, Kalema, Kwatotyo and Aziku2008) and for Punjab brown chickens from India (2.15 ± 0.94 kg for cocks and 1.57 ± 0.04 kg for hens) (Vij, Tantia and Vijh, Reference Vij, Tantia and Vijh2006). The live weight of the well-defined and large-framed Dong Tao chickens from Vietnam (3.6 kg for cock and 2.6 kg for hen, Dong Xuan et al., Reference Dong Xuan, Szalay, Su, Tieu and Dang Vang2006) is, however, higher than the average live weight of non-descript village chickens commonly reported in literatures. Olawunmi, Salako and Afuwape (Reference Olawunmi, Salako and Afuwape2008) reported an average weight of 1.01 kg for cocks and 0.92 kg for hens in Yoruba chickens, whereas they reported 1.79 and 1.46 kg for Fulani chickens, indicating the presence of wide variation even among chicken populations sampled from the same country. We also found significant differences in live weight of the two chicken populations (Table 7). Variation in chickens live weight, however, needs to be treated with caution. Live weight may vary because of inaccuracies of weighing scales, individual differences in measuring accuracy, age of the bird and season of the year at which the chicken is weighed (during seasons of relatively better feed supply most likely chickens have higher live weight). Moreover, genetic and other environmental (stochastic) factors possibly affect the live weight of village chickens.
Conclusion
Most of the rare morphological variants found in our study were present in Jarso chickens (except crest), which shows the high phenotypic diversity of Jarso chickens. This indicates that Jarso chickens might have descended from earlier founding chicken population. This is possible because phenotypic diversity is positively correlated with the length of breeding history and inversely related to geographical distance from the centre of domestication (Jarso is closer to the presumed centre of domestication for domestic fowl). Owing to its ancient inhabitation, stochastic factors and evolutionary forces might have had longer time to provoke and modulate germline mutations in Jarso chickens. Moreover, owing to the influence of a long history of artificial selection, Jarso chickens most likely have had better chance to accumulate some of the rare variants observed. Difference in their ancestral genetic background (genetic structure of the founder population) and variation in ecological landscape might have contributed to the observed differences. The lower relative diversity observed in most of the morphological traits in Horro chickens on the other side might be the consequence of the very recent introduction of chickens following the short history of human settlement. The relative abundance of crested chickens in Horro district, however, might be associated with high frequency of crested alleles in the founder population.
Acknowledgements
This study was financed by the Biotechnology and Biological Sciences Research Council (BBSRC), the UK Department for International Development (DFID) and the Scottish Government (grant numbers BB/H009396/1, BB/H009159/1 and BB/H009051/1). This study is a part of the collaborative project (CH4D, Chicken Health for Development) launched by UK institutes (University of Nottingham, University of Liverpool, The Roslin Institute) and institutes based in Ethiopia–International Livestock Research Institute (ILRI) and Ethiopian Institute of Agricultural Research (EIAR)). Visited farmers kindly allowed us to sample their chickens and warmly welcomed our interview. Respective district and village Office of Agriculture staffs facilitated our field work. The data were collected by core epidemiology and genetics field team members and enumerators. We would like to thank the anonymous reviewers and the journal editor(s) for their valuable comments.