INTRODUCTION
The Amazon basin is the largest fluvial region in the world covering an area of about 5.5 million km2 (Irion and Kalliola, Reference Irion and Kalliola2010), and it is considered a hot spot of diversity with ~16,000 tree species (Olson et al., Reference Olson, Dinerstein, Wikramanayake, Burgess, Powell, Underwood, D’amico, Itoua, Strand and Morrison2001; Ter Steege et al., Reference Ter Steege, Pitman, Sabatier, Baraloto, Salomão, Guevara and Phillips2013). In the Amazon region, forests store ~50% of tropical forest carbon and play a vital role in global water, energy, and carbon cycling (Levine et al., Reference Levine, Zhang, Longo, Baccini, Phillips, Lewis, Alvarez-Davila, Andrade and Brienen2016). The Amazon also contains the largest black-water river in the world, the Rio Negro, with a basin area of ~700,000 km2 (Goulding et al., Reference Goulding, Barthem and Ferreira2003; Latrubesse and Franzinelli, Reference Latrubesse and Franzinelli2005). This black-water river system is characterized by large amounts of sand, high concentrations of humic acid, and low quantities of suspended matter (Moran, Reference Moran1995; Junk and Piedade, Reference Junk and Piedade2010; Junk et al., Reference Junk, Piedade, Schöngart, Cohn-Haft, Adeney and Wittmann2011; Montero, Reference Montero2012).
The floodplains of the Rio Negro are locally called igapós, and a combination of factors, such as geomorphology, climate, and hydrology, control the floristic variation of the igapó forest along the river (Tuomisto et al., Reference Tuomisto, Ruokolainen, Kalliola, Linna, Danjoy and Rodriguez1995; Piedade et al., Reference Piedade, Parolin and Junk2006; Junk et al., Reference Junk, Piedade, Wittmann, Schöngart and Parolin2010; Montero, Reference Montero2012; Montero and Latrubesse, Reference Montero and Latrubesse2013). The geomorphology and precipitation seasonality cause igapó forests to flood from ~50 to 230 days/yr, and a precipitation reduction for extended periods reduces the river level, increasing the risk of fires in the area (Montero et al., Reference Montero, Piedade and Wittmann2012; Ritter et al., Reference Ritter, Andretti and Nelson2012). Terrestrial and aquatic herbaceous plants are scarce in igapós, and many white-water species are absent because of the low fertility and/or low pH of the water (Junk et al., Reference Junk, Piedade, Wittmann, Schöngart and Parolin2010; Montero et al., Reference Montero, Piedade and Wittmann2012). However, the igapó forests are home to several endemic tree species (e.g., in the Lecythidaceae and Fabaceae families; Kubitzki, Reference Kubitzki1989; Montero et al., Reference Montero, Piedade and Wittmann2012).
The vegetation in the Rio Negro region has likely been strongly affected by the dynamics of the Rio Negro at least since the last ca. 65,000 calyrBP (Latrubesse and Franzinelli, Reference Latrubesse and Franzinelli1998, Reference Latrubesse and Franzinelli2005). In fact, understanding the evolution of such forests might be of particular interest for predicting the impact of future climate change considering the estimated increase of floods and droughts already occurring in the Amazon basin (Espinoza et al., Reference Espinoza, Guyot, Ronchail, Cochonneau, Filizola, Fraizy, Labat, Oliveira, Ordoñez and Vauchel2009; Marengo et al., Reference Marengo, Tomasella, Soares, Alves and Nobre2012). This is especially important because the river is one of the main factors shaping the landscape. On the other hand, the igapó forests are part of the huge rain forest’s water pump in the Amazon region, contributing to the global water circulation (Aragão, Reference Aragão2012). Therefore, any drastic change in such environments makes them prone to fires as is reported in some areas of the Rio Negro (Ritter et al., Reference Ritter, Andretti and Nelson2012; Flores et al., Reference Flores, Piedade and Nelson2014, Reference Flores, Fagoaga, Nelson and Holmgren2016).
In such a unique region, paleoecological studies can help to unravel the changes and responses of the igapó forests to climatic, geomorphological, and anthropogenic changes in the past. However, in remote regions like the middle-upper part of the Rio Negro basin, the current and past forest dynamics remain particularly poorly investigated. The only paleoecological record close to this area is the Hill of Six Lakes, which is situated on a small inselberg in the upper part of the Rio Negro valley (Colinvaux et al., Reference Colinvaux, De Oliveira, Moreno, Miller and Bush1996; Santos et al., Reference Santos, Cordeiro, Silva-Filho, Turcq, Lacerda, Fifield, Gomes, Hausladen, Sifeddine and Albuquerque2001; Bush et al., Reference Bush, De Oliveira, Colinvaux, Miller and Moreno2004; Cordeiro et al., Reference Cordeiro, Turcq, Sifeddine, Lacerda, Silva Filho, Gueiros, Potty, Santelli, Pádua and Patchinelam2011; D’Apolito et al., Reference D’Apolito, Absy and Latrubesse2013). The results from such records revealed that forest was dominant for the Holocene and hyperhumid conditions dominated in the area since the last 6000 cal yr BP (D’Apolito et al., Reference D’Apolito, Absy and Latrubesse2013).
On the other hand, the role of humans is still poorly understood in the Rio Negro region, although people have been living in the Amazonian landscape since at least 13,000 cal yr BP (Roosevelt et al., Reference Roosevelt, Costa, Lopes Machado, Michab, Mercier, Valladas and Feathers1996). Currently, most of the fires in the middle-upper part of the Rio Negro are the result of human influence, even during extreme droughts (Ritter et al., Reference Ritter, Andretti and Nelson2012). The low levels of the river and the high amount of leaves and bark fragments allow human-induced fires to spread easily, burning almost the 90% of the root system of the trees in the igapó forest in the municipality of Barcelos (Flores et al., Reference Flores, Fagoaga, Nelson and Holmgren2016). In this context, human-made fires may have affected the vegetation dynamics during the last several millennia as reported in paleoecological reconstructions along the Amazon region and archaeological inventories along the Rio Negro (Neves et al., Reference Neves, Petersen, Bartone and Heckenberger2004; Neves and Petersen, Reference Neves and Petersen2006; Neves, Reference Neves2013; Rull et al., Reference Rull, Montoya, Nogué, Vegas-Vilarrúbia and Safont2013; Bush et al., Reference Bush, McMichael, Piperno, Silman, Barlow, Peres, Power and Palace2015).
Here, we aimed to reconstruct past vegetation and river dynamics in a floodplain lake of the middle to upper part of the Rio Negro. Considering that the river dynamics play an important role in the vegetation of the area, this research is based on a multiproxy approach that included geochemistry, pollen, and microcharcoal analyses. The study was focused on the understanding of the igapó forests stability and the influence of the river dynamics on vegetation establishment during the early and late Holocene. Additionally, we have used fire signal, frequency of pioneer species, and location of previous archaeological sites as possible human disturbance indicators in the area. Our results represent the only record to date of past vegetation changes and forest dynamics directly from the middle-upper Rio Negro floodplain areas.
STUDY AREA
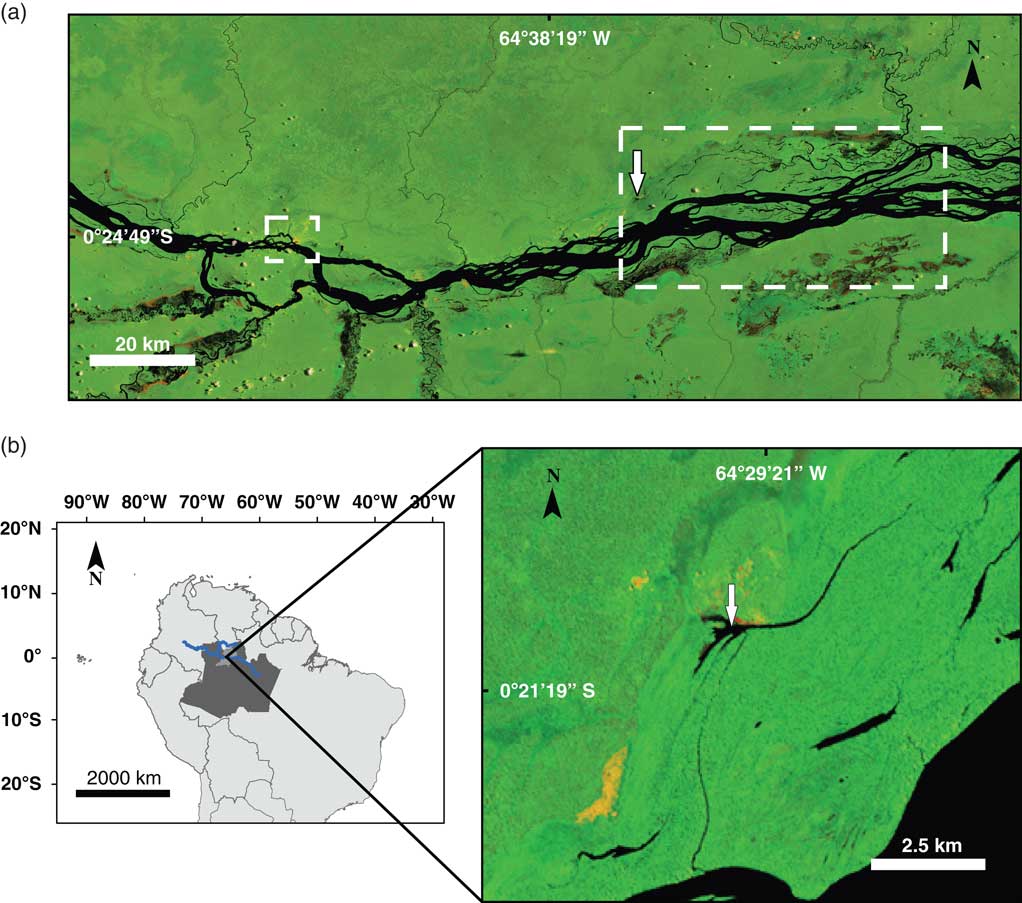
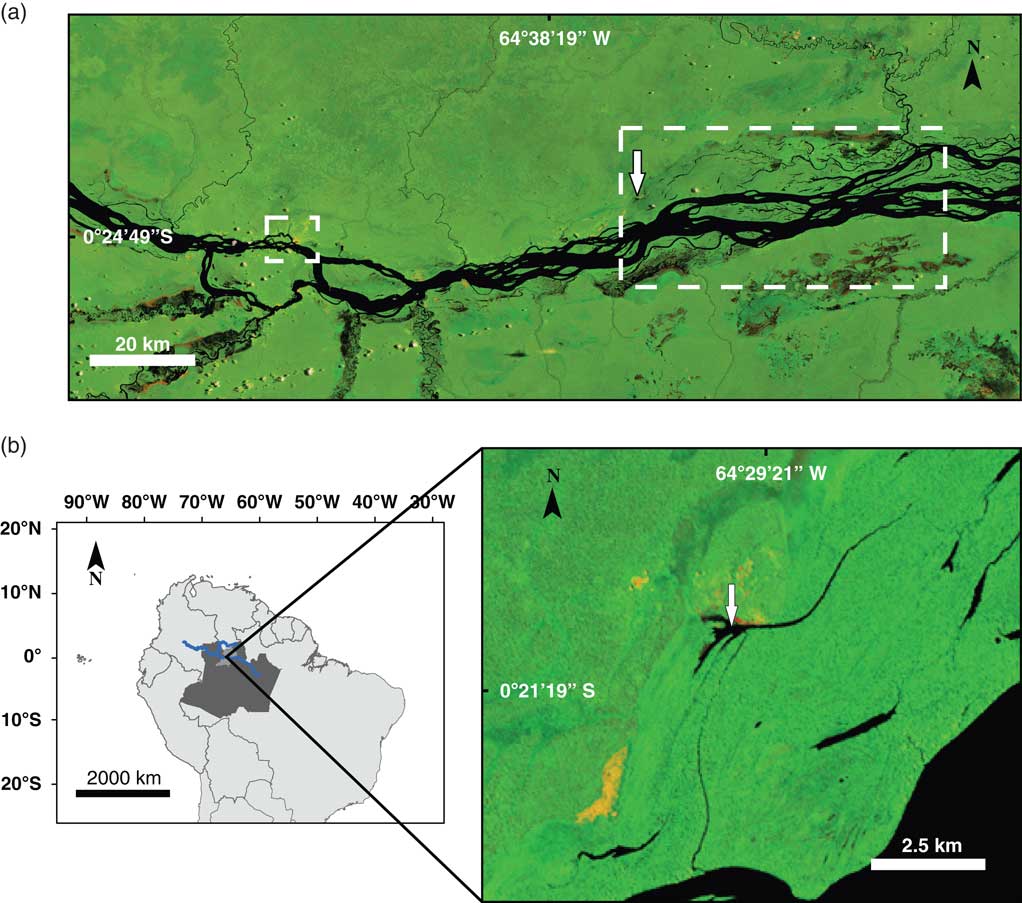
The Lake Acarabixi is a floodplain lake in the middle-upper part of Rio Negro located ~60 km to the east of the city of Santa Isabel, in the Amazonia state in Brazil (0°20′45″S, 64°29′56″W; 33 m elevation). The lake has an area of ~0.4 km2 and has a direct connection to the Rio Negro during extreme high water levels (Figs. 1 and 2). On the eastern side of the lake lies a small village from the community of Acarabixi that uses the area for fishing and forest extraction (Silva, Reference Silva2011; Instituto Socioambiental, 2012).
Location of the Lake Acarabixi sediment core. Landsat 5 images were obtained from the web page of the Brazilian National Institute for Space Research (Instituto Nacional de Pesquisas Espaciais, Ministério da Ciencia, Tecnologia e Inovaçao; http://www.inpe.br [accessed August 5, 2016]). The color images are composed of the midinfrared band 5, the near-infrared band 4, and the red band 3, which shows land-water boundaries. The black color is showing watercourses, yellowish and reddish areas show open soils (sand dunes), and green areas represent the vegetation. (a) The middle-upper part of the Rio Negro. The small dashed square on the left side shows the city of Santa Isabel. The large dashed rectangle shows the lakes and channels used for fishing. The white arrow shows the study site. (b) Left side, a map of South America including the Amazon region in Brazil (dark gray), the municipality of Santa Isabel (light gray), and the course of the Rio Negro (blue line). Right side, Lake Acarabixi. The white arrow is showing the coring site location. (For interpretation of the references to color in this figure legend, the reader is referred to the web version of this article.)
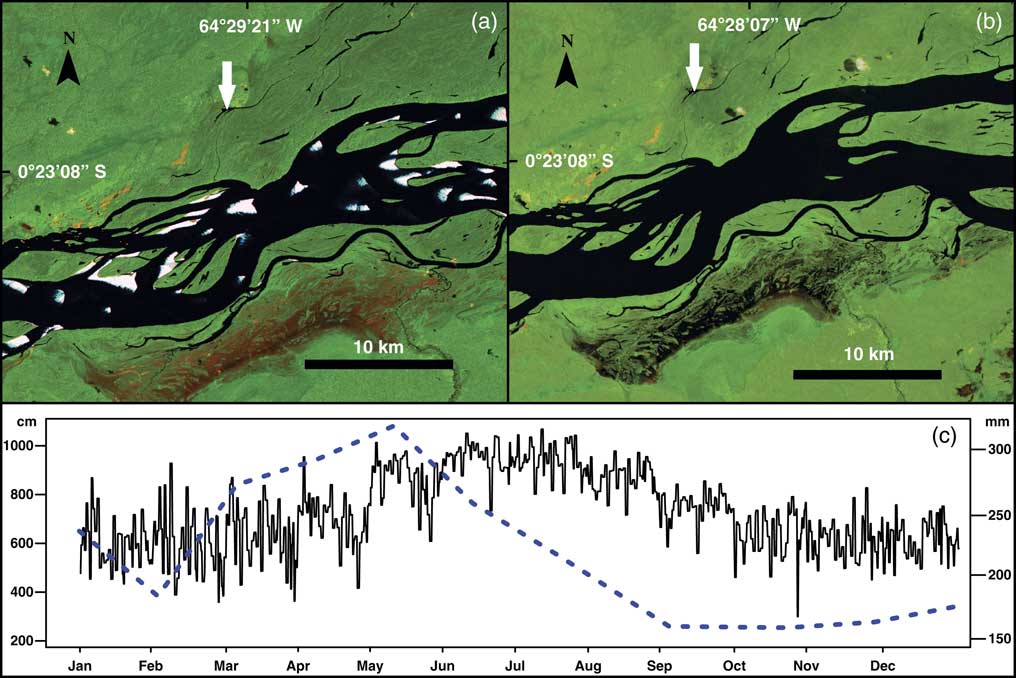
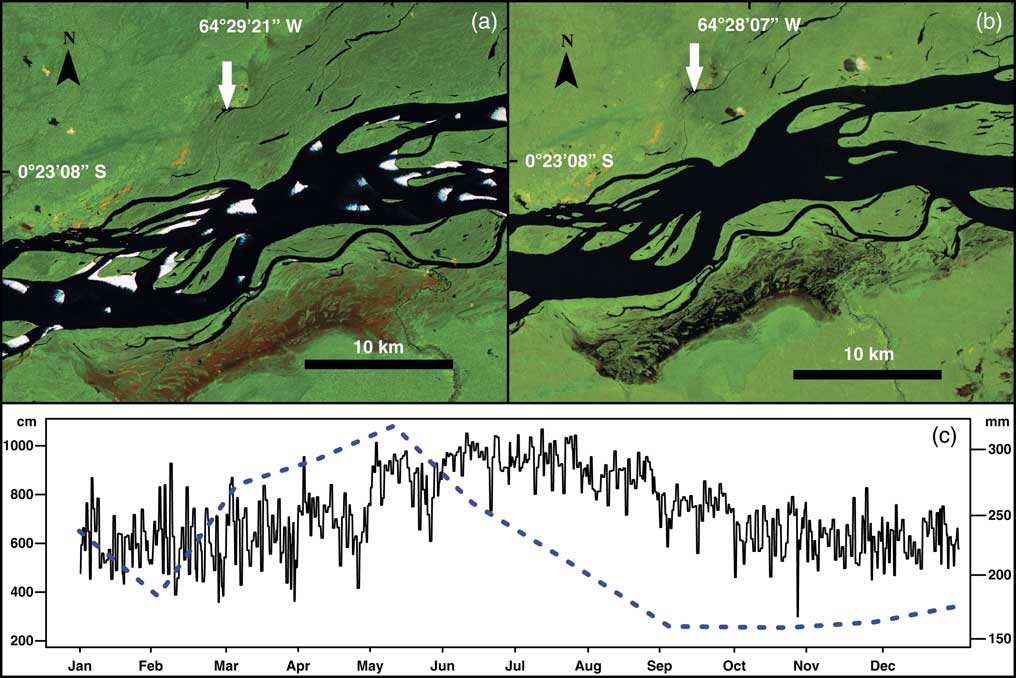
Hydrologic variability between seasons at the middle-upper part of the Rio Negro. Landsat 5 images showing the Lake Acarabixi floodplain; the images were obtained from the web page of the Brazilian National Institute for Space Research (Instituto Nacional de Pesquisas Espaciais, Ministério da Ciencia, Tecnologia e Inovaçao; http://www.inpe.br [accessed August 5, 2016]). These color images are composed of the midinfrared band 5, the near-infrared band 4, and the red band 3. (a) Image from the Rio Negro and Lake Acarabixi during the dry season on February 1985, showing the exposed soils (sands) because of the low water level. White arrow indicates the location of the lake. (b) Image from the Rio Negro and Lake Acarabixi at the end of the wet season in September 1985. White arrow indicates the location of the lake. (c) Mean monthly water level in centimeters (continuous line) from 1977 to 2015 (data courtesy of the Agência Nacional de águas, http://www.snirh.gov.br/hidroweb [accessed August 16, 2016]) at the climatic station Serrihna). Mean monthly precipitation in millimeters (dashed line) from 1961 to 1990 (data courtesy of Instituto Nacional de Metereologia, Ministério da Agricultura, Pecuária e Abastecimento, http://www.inmet.gov.br. [accessed July 10, 2016], at the climatic station Santa Isabel do Rio Negro). (For interpretation of the references to color in this figure legend, the reader is referred to the web version of this article.)
Geologically, the upper part of the Rio Negro contains coarse sediments from Precambrian granitic and granulitic rocks of the Guiana Shield (Montero, Reference Montero2012). The alluvial landscape is characterized by rocky islands and the presence of granite inselbergs that lie close to the river channel (Latrubesse and Franzinelli, Reference Latrubesse and Franzinelli2005; Montero, Reference Montero2012; Montero et al., Reference Montero, Piedade and Wittmann2012). Most of the length of the river behaves as a complex anabranching system, which can be divided into six main sections (reaches) that have similar hydrologic characteristics within each other (Latrubesse and Franzinelli, Reference Latrubesse and Franzinelli2005). The Lake Acarabixi belongs to reach II, in which the anabranching pattern of the river begins in alluvial sediments that form a wide Holocene floodplain (Latrubesse and Franzinelli, Reference Latrubesse and Franzinelli2005).
Santa Isabel has a tropical equatorial climate (Af, Köppen classification) with a mean annual precipitation of 2500 mm and a mean annual temperature ranging between 25°C and 28°C (Instituto Nacional de Metereologia [INMET], Ministério da Agricultura, Pecuária e Abastecimento, http://www.inmet.gov.br. [accessed July 10, 2016]). Precipitation amounts are highest from March through August, with a rise in river levels from May to August (Fig. 2). Subsequently, a period with a reduction of rainfall, which is rarely less than 100 mm, occurs from September to February (Agencia Nacional de Aguas, http://www.snirh.gov.br/hidroweb [accessed August 16, 2016]). Between January and March the river has the lowest levels, where sandy and quartzic banks are exposed.
The vegetation growing near the lake is igapó forest, characteristic of black-water rivers (Montero et al., Reference Montero, Piedade and Wittmann2012). The canopy height averages about 15–20 m with few emergent trees up to 30 m. The most important families growing adjacent to the Rio Negro are Fabaceae, Lecythidaceae, Chrysobalanaceae, Euphorbiaceae, and Sapotaceae. Other important families are Annonaceae, Malvaceae, and Rubiacae, and species that have a restricted distribution to the Rio Negro basin are Heterostemon mimosoides, Aldina heterophylla, and Eschweilera atropetiolata (Montero, Reference Montero2012).
METHODS
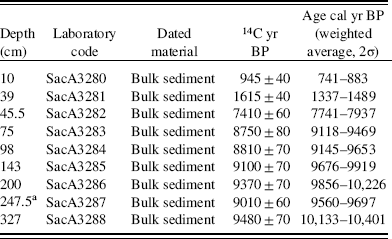
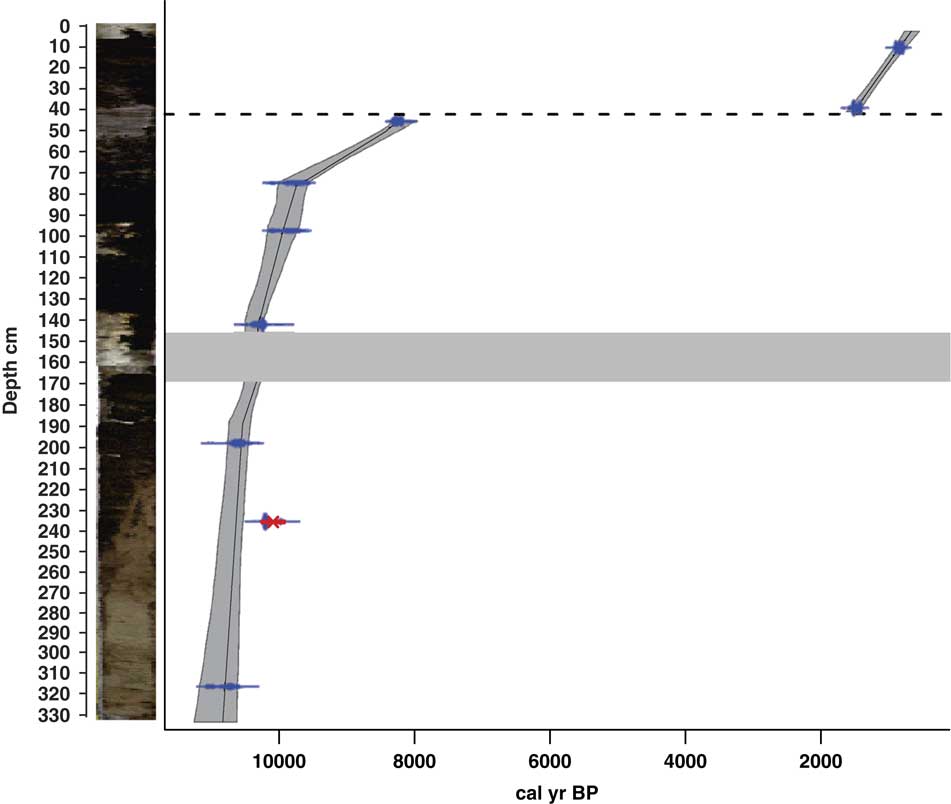
The sediments from Lake Acarabixi were collected in 2002 by a vibra-coring system using aluminum tubes with a diameter of 7.6 cm and a platform based on two rubber boats. Two sediment cores were collected, ACA 02/03 (330 cm), which was used for our analyses, and ACA 02/06 (320 cm). Nine bulk sediment samples were submitted to the Laboratoire de Mesure du Carbone 14 (LMC14), Saclay in France for 14C accelerator mass spectrometry (AMS) dating (Table 1). Radiocarbon dates were calibrated with the IntCal13 calibration curve for the Northern Hemisphere (Reimer et al., Reference Reimer, Bard, Bayliss, Beck, Blackwell, Ramsey and Buck2013) using the package ‘clam’ (Blaauw, Reference Blaauw2010) in R (R Development Core Team, 2016).The age-depth model was developed using the linear interpolation method.
List of the accelerator mass spectrometry radiocarbon dates from the Acarabixi sediment core ACA 02/03.
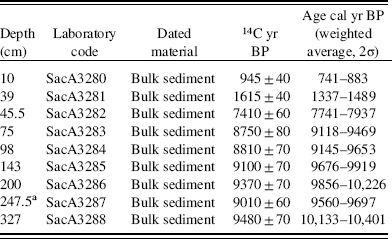
a Date not included in the age-depth model.
Bulk organic matter parameters were analyzed at the University of California, Davis Stable Isotope Facility (USA). Total organic carbon (TOC) and total nitrogen were analyzed using an elemental analyzer (C/H/N FISONS NA-2000). Stable isotope composition (δ13C) was analyzed using a Europe Hydra 20/20 isotope ratio mass spectrometer (IRM) equipped with a continuous flow. The analytical precision (as the standard deviation of repeated internal standard measurements) for the stable isotope measurements was 0.06% for δ13C. All elements were analyzed each 2 to 3 cm through the core. The C/N ratio together with the δ13C values were used to determine the origin of the organic matter. High values of C/N ratio generally indicate large proportions of land-plant organic matter in lake sediments (Meyers, Reference Meyers2003), while the δ13C is commonly used to detect the variations of C3 or C4 plants in the studied area (Martinelli et al., Reference Martinelli, Victoria, Camargo, Piccolo, Mertes, Richey, Devol and Forsberg2003; Meyers, Reference Meyers2003).
For palynological analysis, 31 samples of 0.5 cm3 were analyzed from the core ACA 02/03. High content of sand on the record ACA 02/06 impeded developing the pollen analysis. Samples were treated with 40% hydrofluoric acid and 10% KOH following the standard method of Faegri and Iversen (Reference Faegri and Iversen1989). For calculation of pollen concentration and influx and charcoal influx, one tablet of exotic marker was added (Lycopodium clavatum) per sample (Stockmarr, Reference Stockmarr1971). Pollen and spore identifications were based on reference literature (Colinvaux et al., Reference Colinvaux, De Oliveira and Moreno1999; Rangel-Ch. et al., Reference Rangel-Ch., Bogotá and Jiménez-B.2001; Jiménez et al., Reference Jiménez, Bogotá and Rangel2008) and the pollen reference collection at the Department of Palynology and Climate Dynamics (University of Goettingen, Germany). Most of the samples were counted to a sum higher than 400 pollen grains. The sample at 5 cm depth had very low pollen content and was counted to 90 pollen grains. Spores were excluded from the pollen sum. The zonation of the pollen diagram was obtained using CONISS on the pollen data (Grimm, Reference Grimm1987). The number of statistically significant zones was evaluated using the broken stick model (Bennett, Reference Bennett1996). The CONISS analysis was performed using the software Tilia (Grimm, Reference Grimm2015). Calculations and pollen diagram were done with psimpoll and Tilia (Bennett, Reference Bennett2009; Grimm, Reference Grimm2015).
Pollen-based indices were calculated using R, version 3.3.1 (R Development Core Team, 2016), and the vegan package, version 2.3.0 (Oksanen et al., Reference Oksanen, Blanchet, Kindt, Legendre, Minchin, O’Hara, Simpson, Solymos, Stevens and Wagner2015). The pollen-spore sample diversity was plotted based on rarefaction analysis to a base of 10 counts, E(T10), and pollen-spore richness using rarefaction to a base of 400 counts, E(T400), using the method of Matthias et al. (Reference Matthias, Semmler and Giesecke2015).Considering that the pollen-based index for diversity has not been tested in the igapó forests, therefore, the pollen samples were also tested with the Shannon index for comparison (data not shown) (Hill, Reference Hill1973). The results were highly correlated (R 2=0.9238); thus we have selected the representation for diversity as rarefaction to a base of 10 counts, E(T10), as a conceptually simpler representation of pollen type diversity within the sample (e.g., Rodríguez-Zorro et al., Reference Rodríguez-Zorro, Costa and Behling2017).
Ordination analyses based on detrended correpondence analysis (DCA) were done using the pollen data (Correa-Metrio et al., Reference Correa-Metrio, Dechnik, Lozano-García and Caballero2014). The DCA was performed using R (R Development Core Team, 2016) and the paleoMAS and vegan packages (Correa-Metrio et al., Reference Correa-Metrio, Urrego, Cabrera and Bush2011; Oksanen et al., Reference Oksanen, Blanchet, Kindt, Legendre, Minchin, O’Hara, Simpson, Solymos, Stevens and Wagner2015).
Microcharcoal and macrocharcoal particles (>10 µm, >100 µm) were counted on the pollen slides and expressed as influx (particles/cm2/yr). Such differentiation in sizes could allow identifying regional (microcharcoal) and possible local (macrocharcoal) fires.
RESULTS
Stratigraphy and chronology
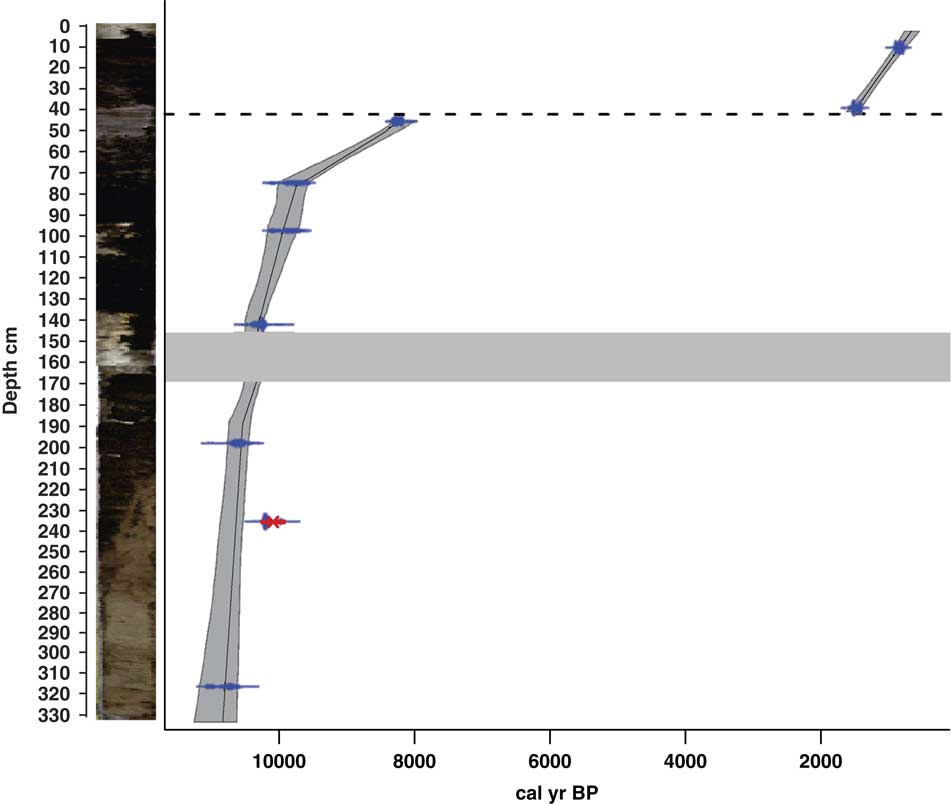
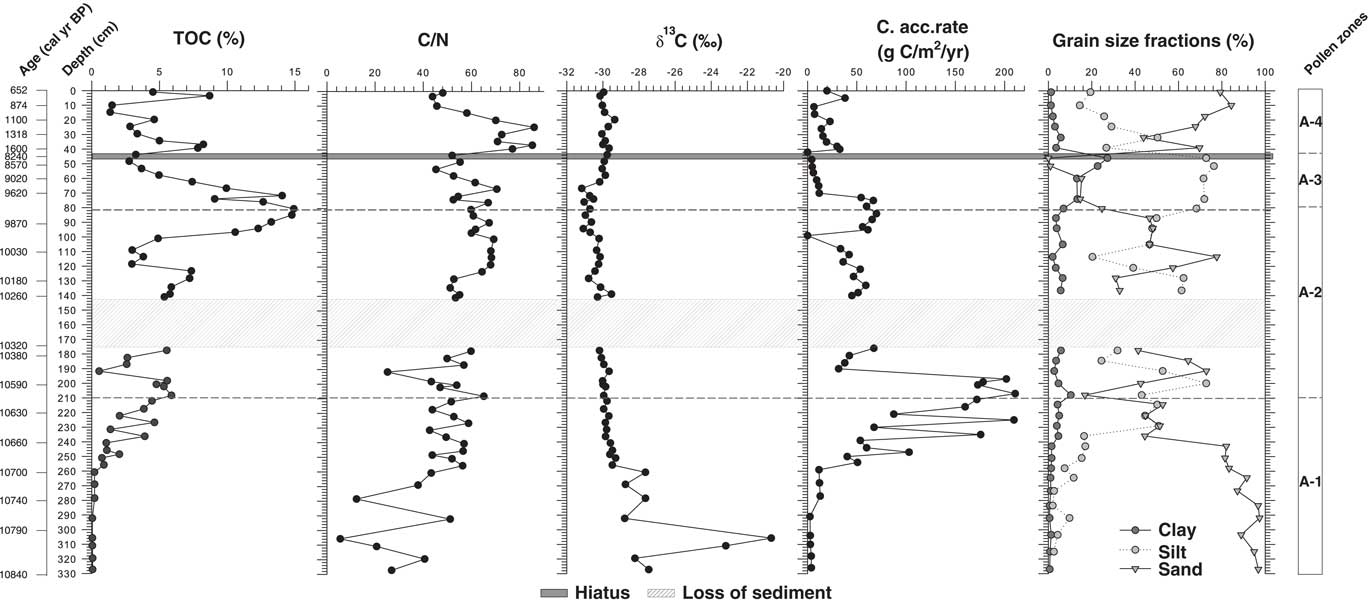
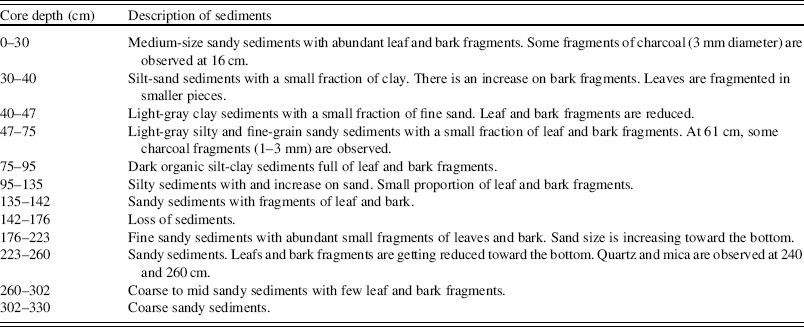
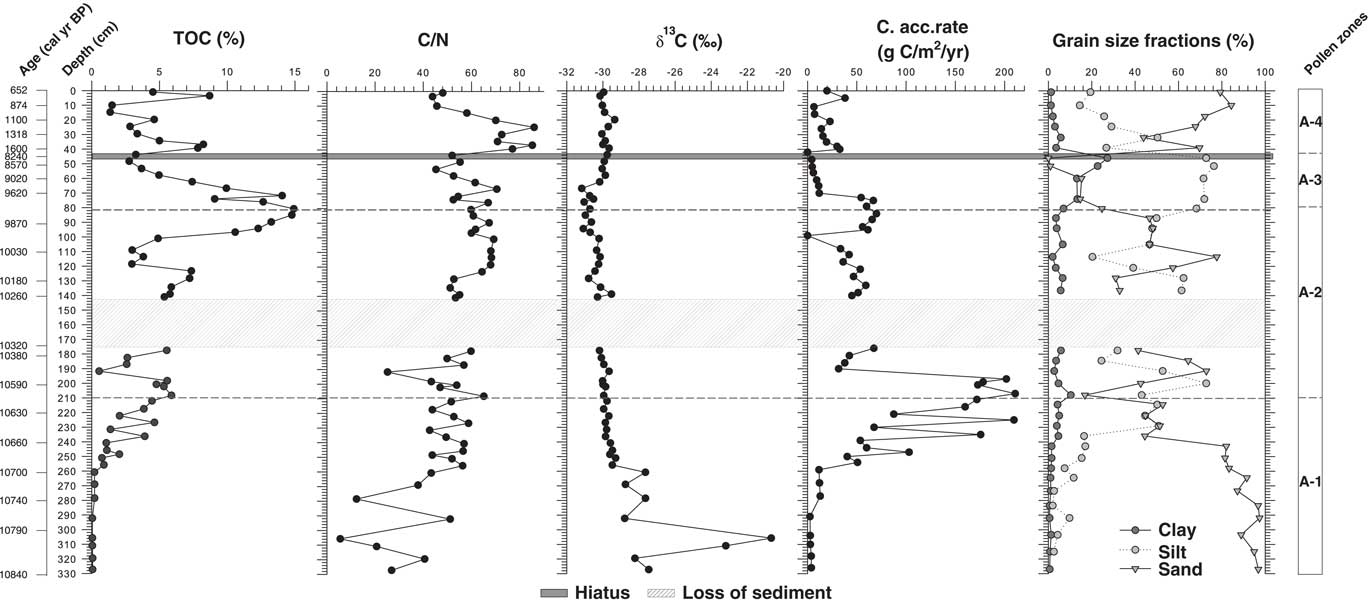
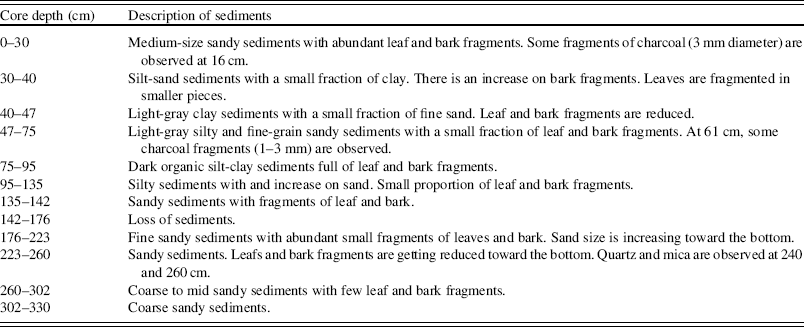
The sediments of Lake Acarabixi were characterized by the dominance of sandy and silty deposits with a few fractions of clay (Figs. 3 and 4). The sediments had a mixture of organic fragments, composed mainly of leaves and wood remains (Table 2). Coarser sediments were found at the bottom and top of the core. Additionally, the record had a gap in sediments between 176 and 145 cm (10,320 and 10,300 cal yr BP) as a result of the process of the retrieving core.
(color online) Stratigraphy and chronology of the Lake Acarabixi sediment core. The stratigraphy is shown on the left side. Dashed line indicates the hiatus in sedimentation, and the thick gray band indicates a gap between sediments.
Geochemical data of the Lake Acarabixi record showing the total organic carbon (TOC), atomic C/N, the isotopic δ13C, the carbon accumulation rate, and the grain-size fractions of the sediment.
Description of the sediments of the Lake Acarabixi core ACA 02/03.
The age-depth model was based on eight of the nine radiocarbon dates from the record ACA 02/03 (Table 1 and Fig. 3). The date at 245.5 cm depth was rejected as a result of reworked material (Table 1). There is a lack of sediment in the core between 176 and 145 cm. This is because of a disruption of the sediment column when the core was retrieved. To develop the age-depth model a “slump” between 176 and 145 cm (10,320 and 10,300 cal yr BP) was added in the ‘clam’ model. A large hiatus in sedimentation was detected from 8240 to 1600 cal yr BP (44 cm). The obtained model spanned from 10,840 cal yr BP to 650 cal yr BP. Therefore, the periods analyzed in this article are related to part of the early Holocene from 10,840 to 8240 cal yr BP, in which there was detected a reduction in coarse sediments, and part of the late Holocene from 1600 to 650 cal yr BP, in which sediments resumed and increased their grain size (Fig. 4).
Geochemical record
Geochemical analyses showed an increase on the percentage of carbon (TOC) toward the top of the core (Fig. 4). The highest peak in TOC was at 9970 cal yr BP (80 cm) (14.9%). Carbon accumulation rate had the highest peaks (160 and 210 g/m2/yr) between 10,680 and 10,550 cal yr BP (250 and 197 cm depth) and decreased toward the top of the sediment core, having a second peak of 61 and 66 g/m2/yr between 9910 and 9680 cal yr BP (96 and 74 cm). The δ13C values were higher at the bottom part of the core, with a maximum at 10,790 cal yr BP (304 cm) (−20.7‰). Afterward, values were reduced toward the top, oscillating between −31 and −27‰. The C/N curve remains relatively stable along the record with the lowest values at 10,790 cal yr BP (304 cm) and the highest at 1400 and 1140 cal yr BP (35 and 23 cm depth).
Pollen diagram
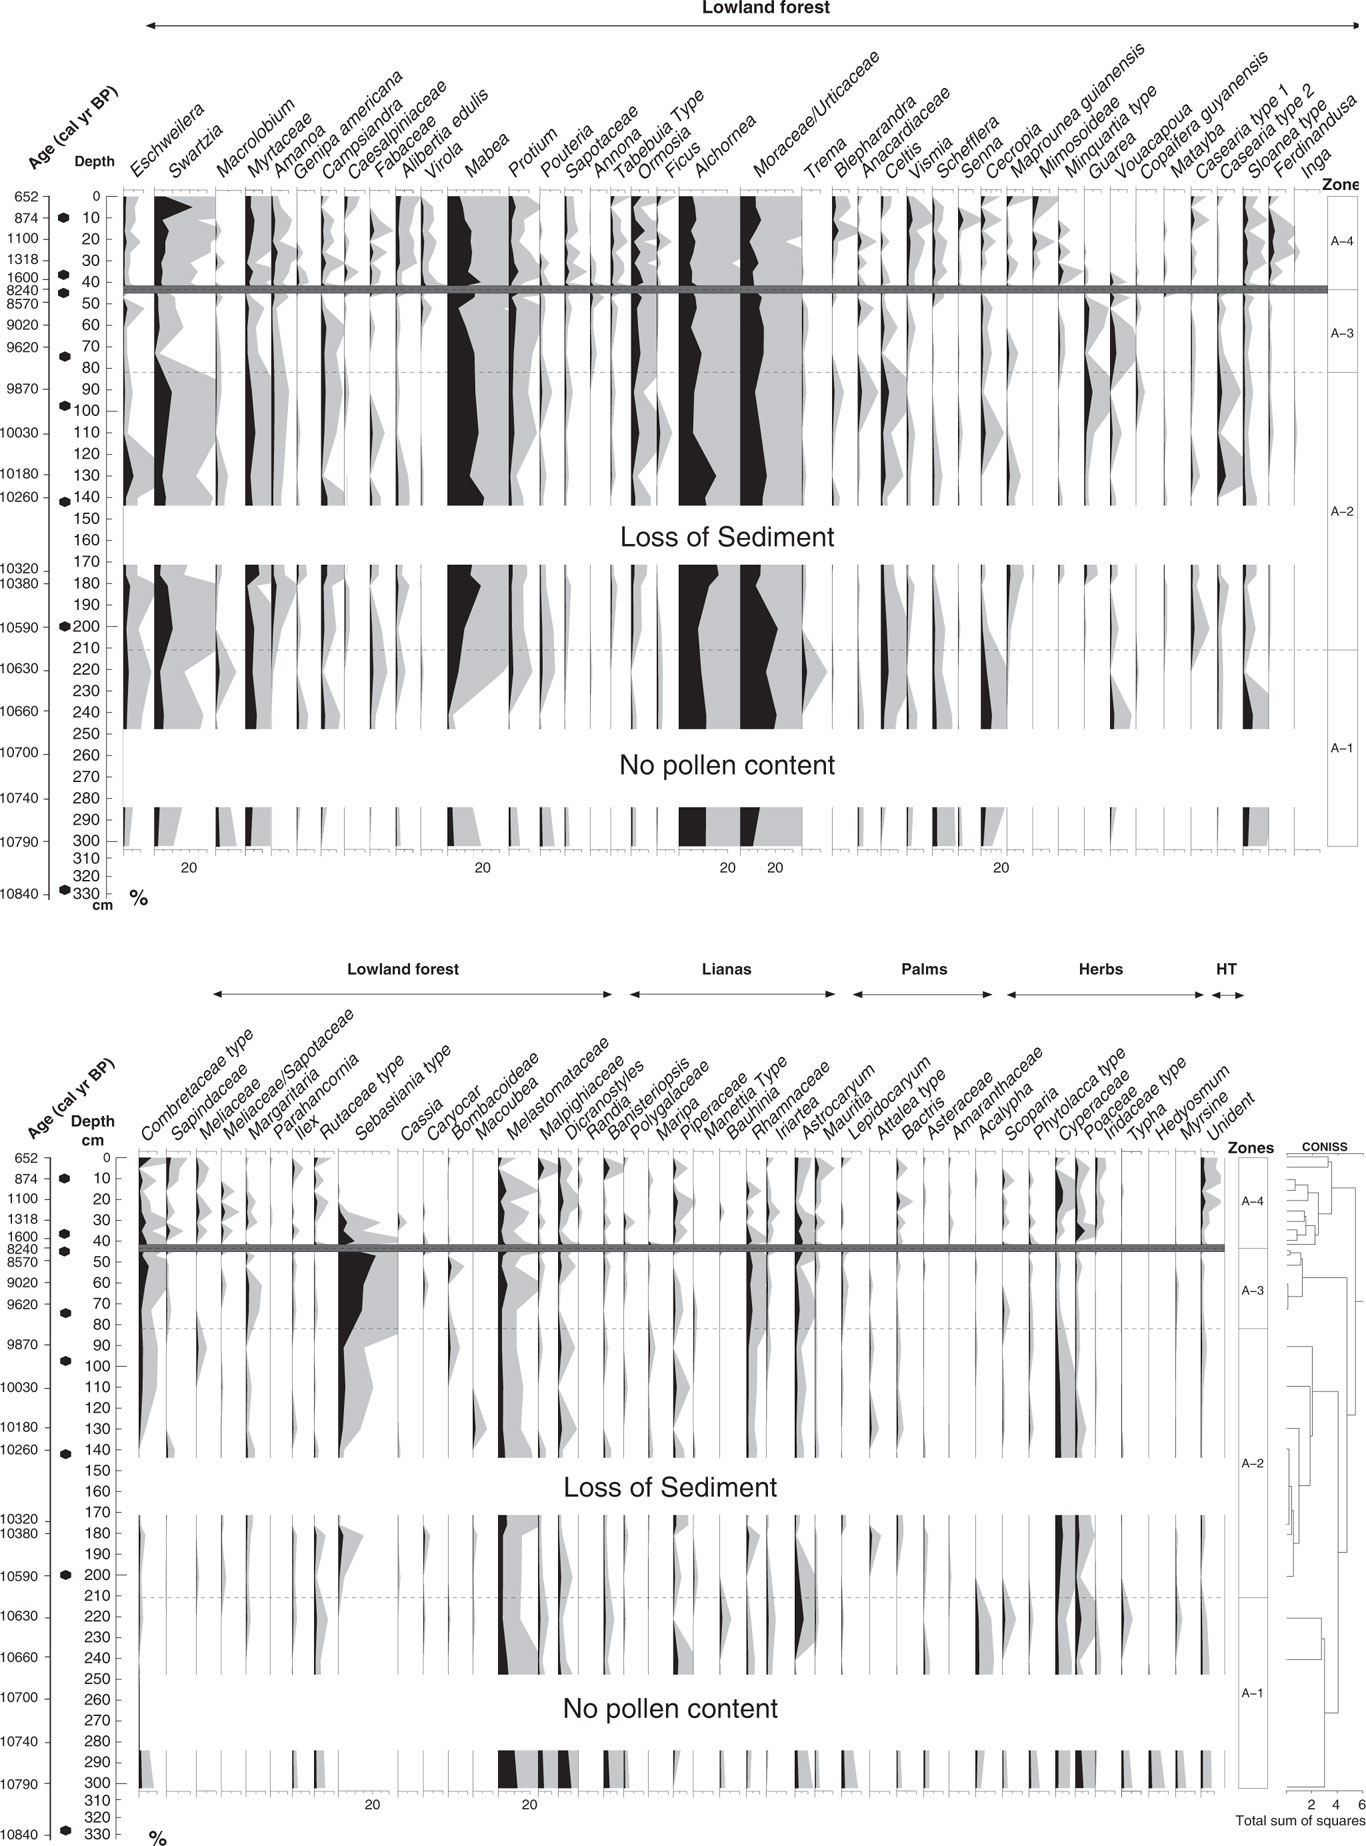
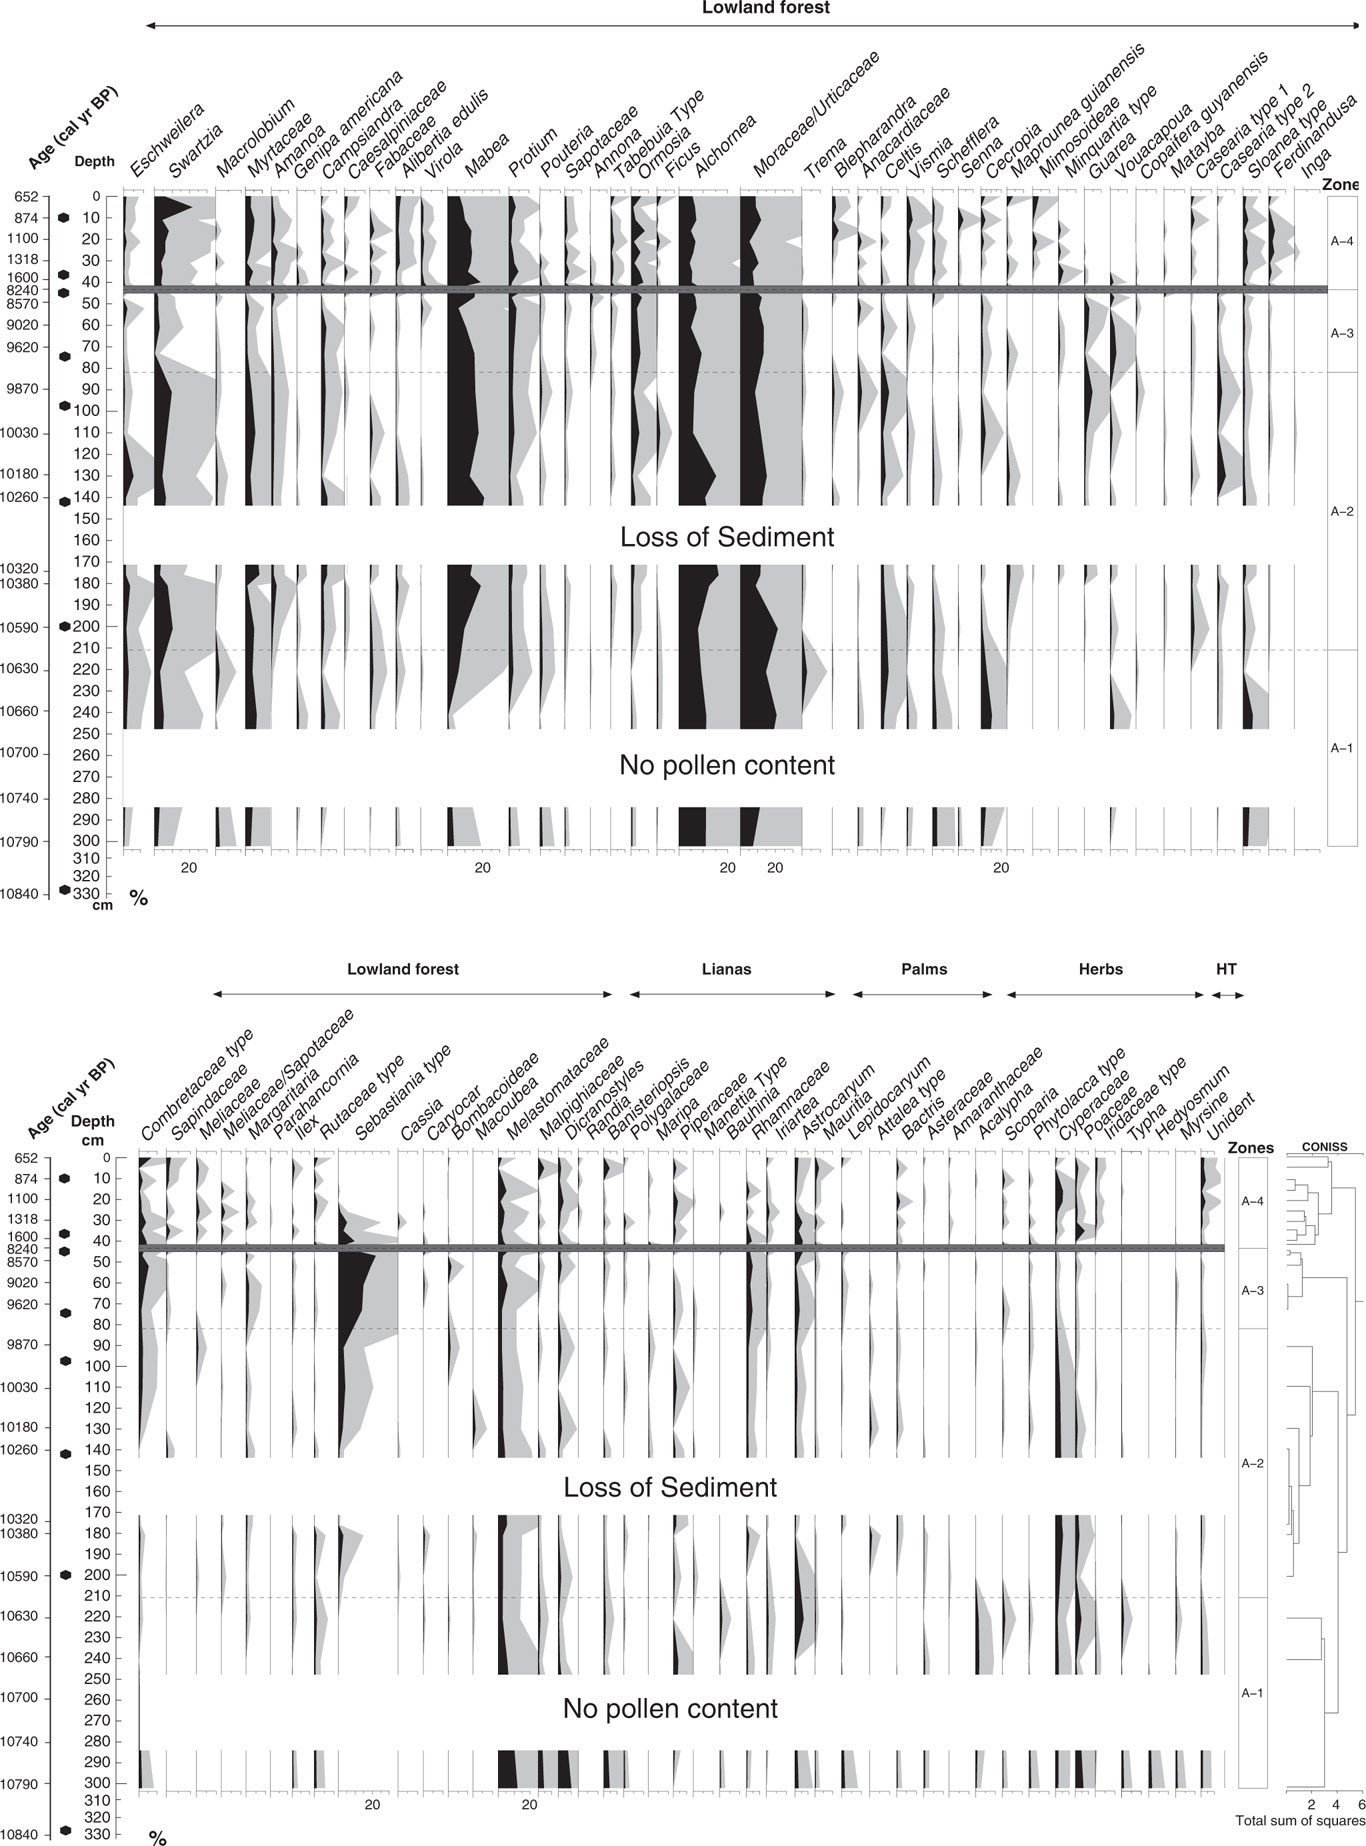
In total, four statistically significant zones were detected: A1 (10,790–10,600 cal yr BP; 302–210 cm; 5 samples), A2 (10,600–9770 cal yr BP; 210–81 cm; 7 samples), A3 (9770–8240 cal yr BP; 81–44 cm; 5 samples), and A4 (1600–650 cal yr BP; 44–0 cm; 10 samples). A total of 98 pollen types were identified and grouped into five ecological groups: lowland forest, lianas, palms, herbs, and highland taxa (Figs. 5 and 6). The samples at the core depths 262, 282, 314, and 330 cm (10,710, 10,750, 10,810, and 10,840 cal yr BP) were without pollen. The sample at the core depth of 5 cm (740 cal yr BP) was not included for interpretation as a result of low pollen content in the sample (90 pollen grains). Pollen concentration oscillated between 3000 and 140,000 grains/cm3.
Pollen and spores percentage diagram showing the taxa grouped into ecological groups: lowland forest, lianas, palms, herbs, and highland taxa (HT). Gray shading is exaggeration ×5. Dark gray line at 44 cm shows the hiatus in sedimentation.
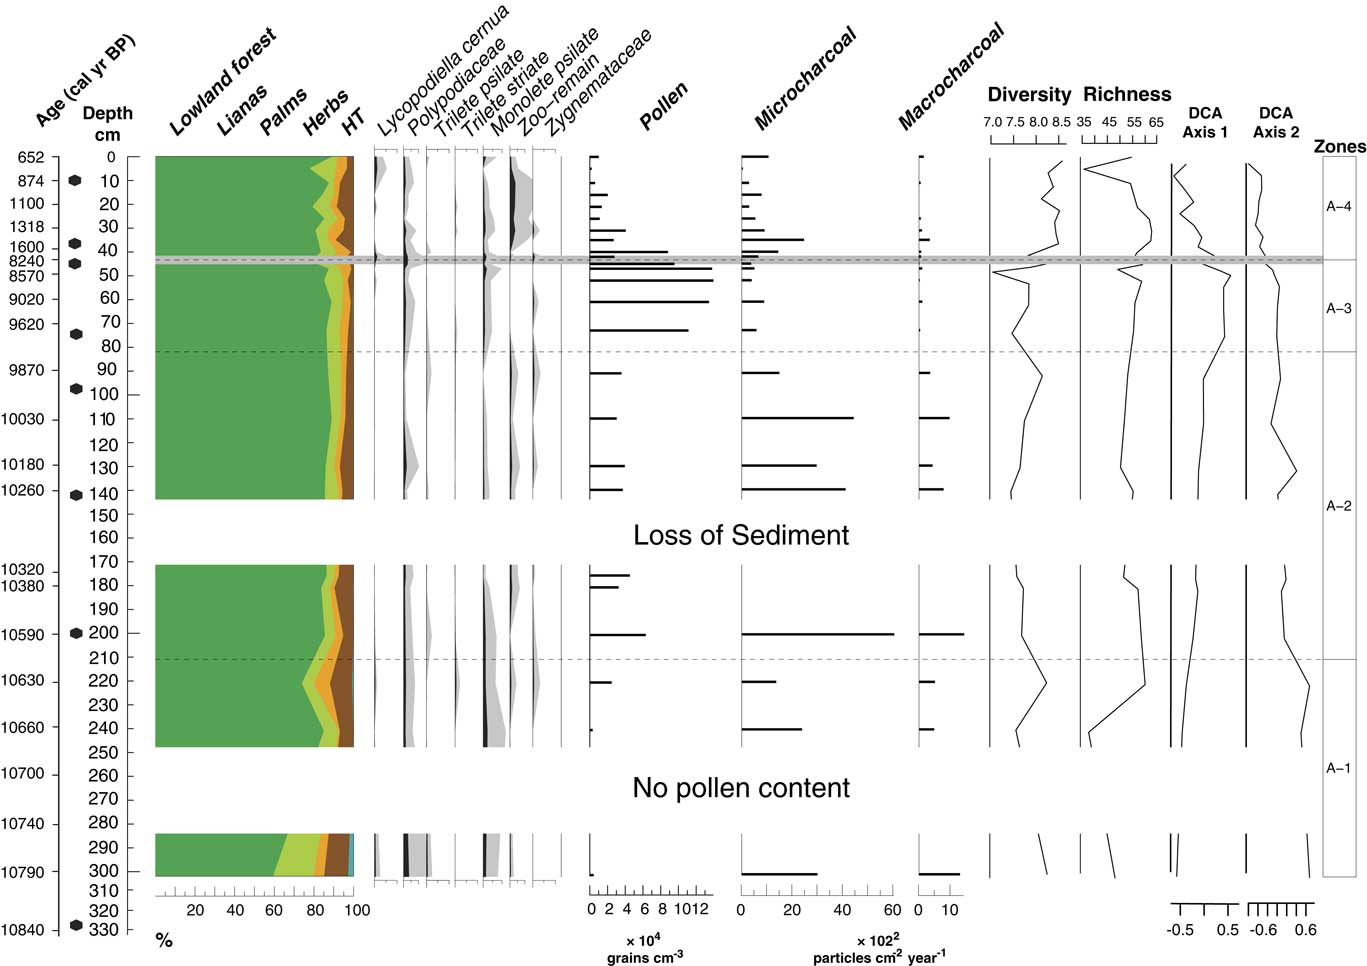
(color online) Pollen sum diagram showing the sum of each ecological group; spore percentages; pollen concentration; microcharcoal and macrocharcoal influx; pollen-spore sample diversity, E(T10), and pollen-spore richness, E (T400); and detrended correspondence analysis (DCA) scores for the axes 1 and 2. Light gray line at 44 cm shows the hiatus in sedimentation.
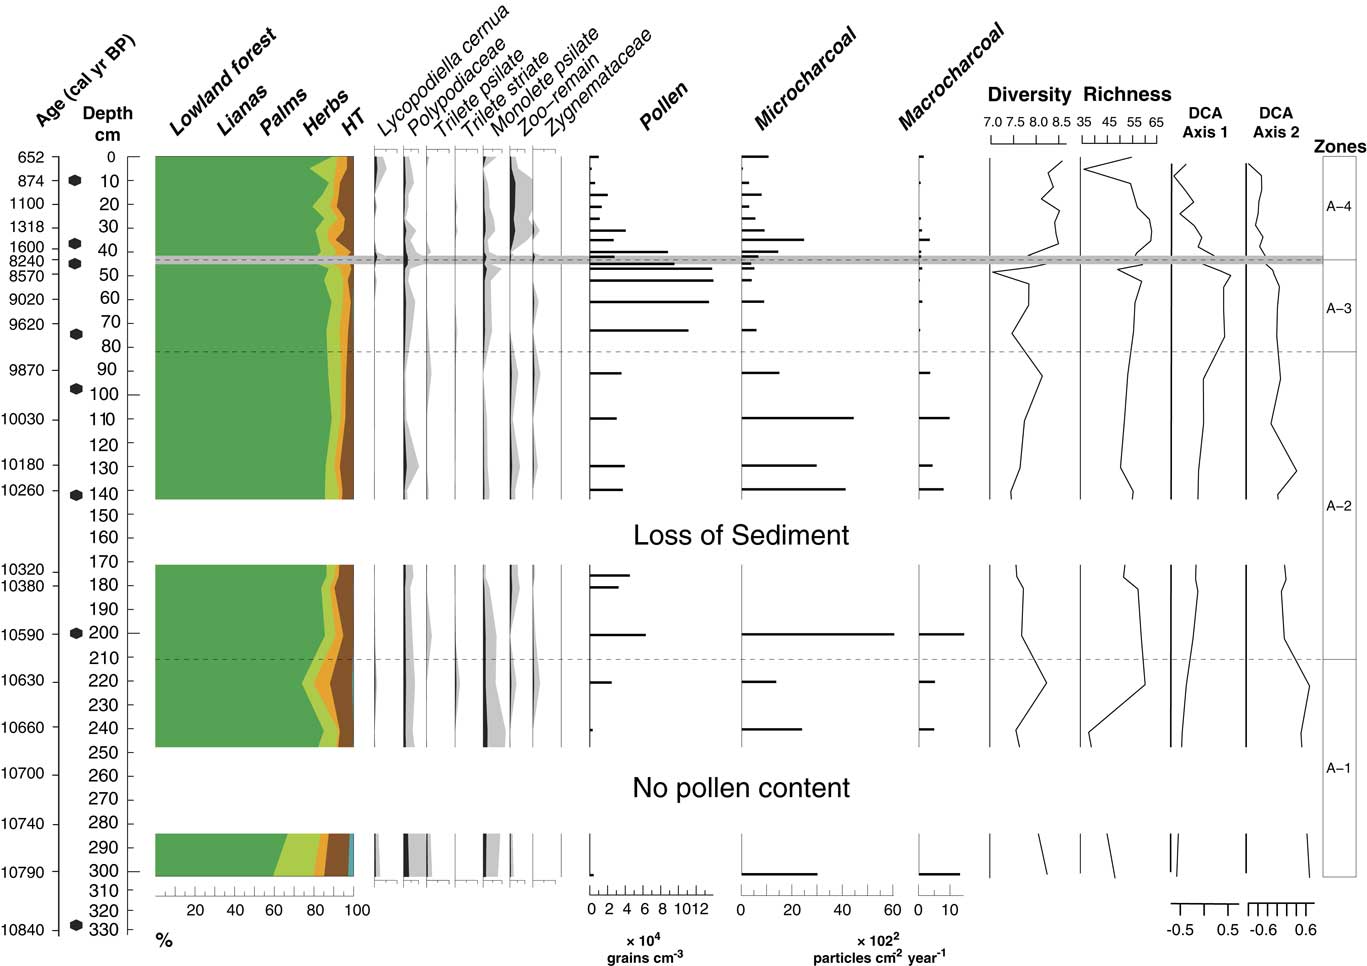
Pollen-spore sample diversity, E(T10), has the highest values from 42 cm depth (1560 cal yr BP) toward the top. Pollen-spore richness, E(T400), has the highest values from 35 to 26 cm core depth (1400 to 1200 cal yr BP) (Fig. 6). Microcharcoal and macrocharcoal influx have the highest peak at 200 cm core depth (10,580 cal yr BP).
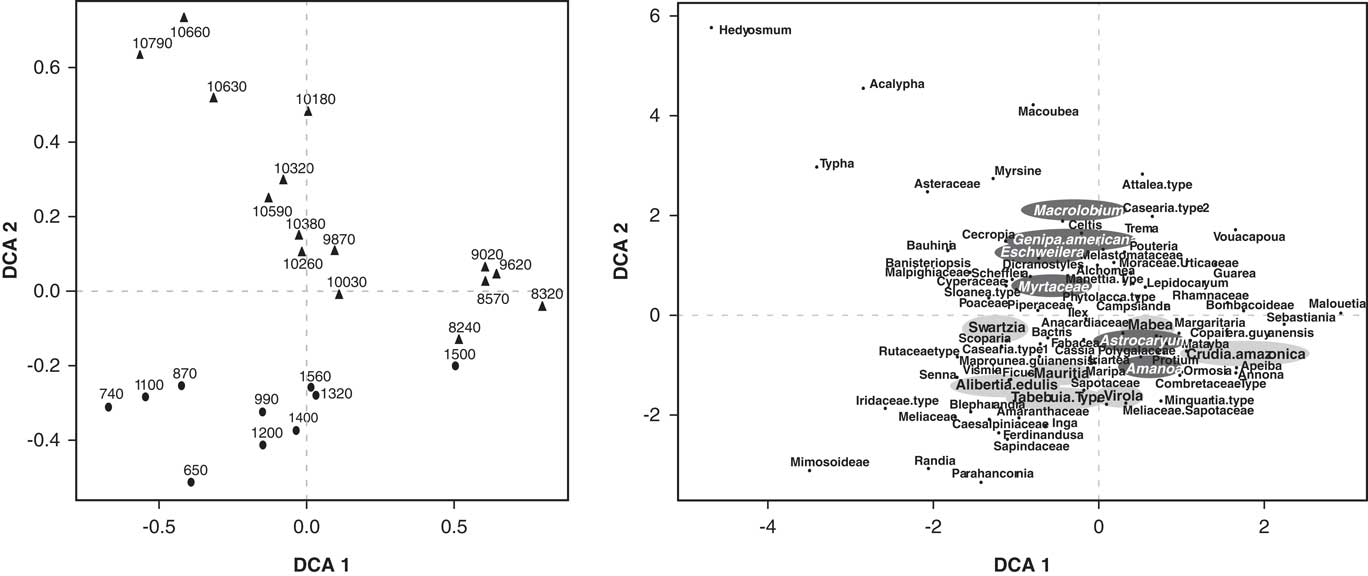
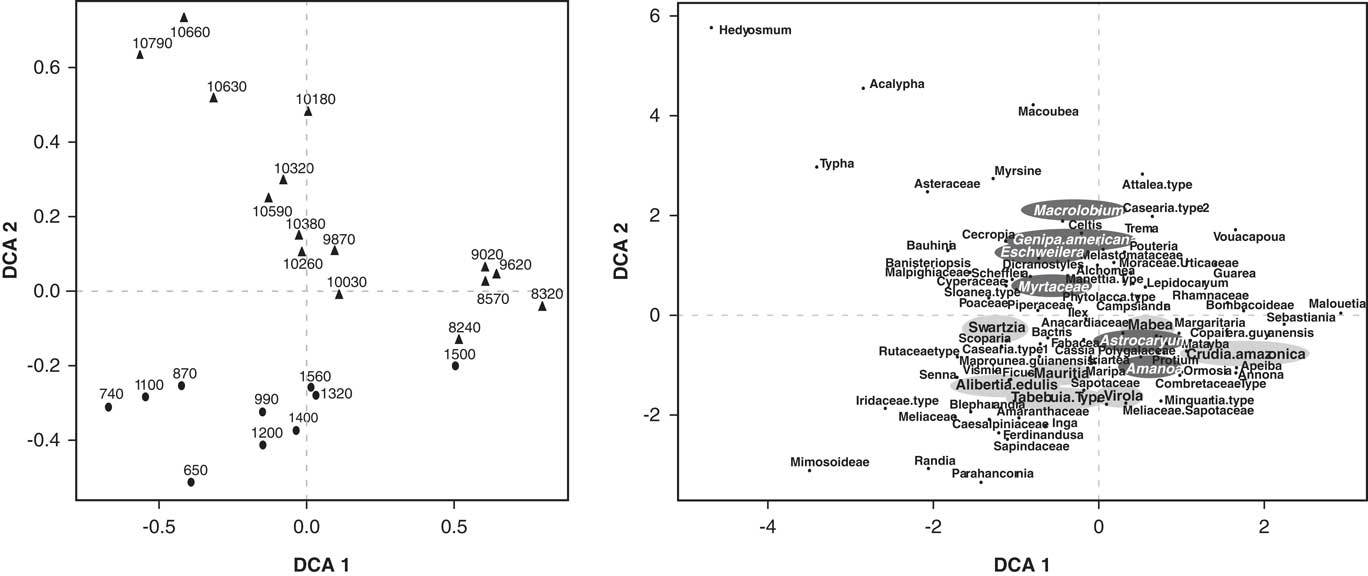
The ordination of the pollen data showed a separation between the samples that belong to the early Holocene and the ones from the late Holocene (Figs. 6 and 7). The first DCA axis likely reflected canopy openness. Taxa with lower axis 1 scores, such as Cecropia, Acalypha, Poaceae, Cyperaceae, and Vismia inhabit more open areas, whereas taxa with high axis 1 scores tend to be closed-canopy elements such as Guarea, Vouacapua, Apeiba, and Copaifera guyanensis. The species that are associated with being tolerant to long periods of flood attain high DCA axis 2 scores, like Eschweilera, Macrolobium, and Myrtaceae (Ferreira and Stohlgren, Reference Ferreira and Stohlgren1999; Piedade et al., Reference Piedade, Junk, Adis and Parolin2005; Montero, Reference Montero2012); whereas species less tolerant to floods and growing along river margins attain low scores from the DCA axis 2, such as Alibertia edulis, Swartzia, and Mabea, among others (Fig. 7) (Ferreira and Stohlgren, Reference Ferreira and Stohlgren1999).
Detrended correspondence analysis (DCA) of the Lake Acarabixi pollen data. Left side shows the samples chronologically. The right side is showing the species. The species tolerant to long periods of flood are highlighted in dark gray, and the species that are less tolerant to flood and grow along river margins are highlighted in light gray.
Pollen zone A1 (10,790–10,600 cal yr BP; 302–210 cm; 5 samples)
The main characteristic of this zone was the low pollen concentration at the lowest part of the core from 10,790 to 10,660 cal yr BP (302 to 241 cm) with values oscillating between 3400 and 4600 grains/cm3 (Figs. 5 and 6). The highest representation of highland taxa (0–3%) occurred within this zone, in which Myrsine and Hedyosmum were found at 10,790 cal yr BP with values of 0% to 2%. The ecological group of herbs also had the highest representation with values between 6% and 12%. Lowland forest vegetation dominated by 59% to 85% with taxa such as Alchornea/Aparisthmium (9–11%), Moraceae/Urticaceae (7–21%), Melastomataceae (3–12%), and Myrtaceae (3–7%). The lowest values of Mabea were found in this zone; it started to increase at 10,660 cal yr BP (240 cm) with values between 1% and 7%. Pioneer species such as Cecropia (2–11%), Schefflera (1–2%), and Vismia (0–1%) were present in this interval. Lianas were the second representative group of this zone (6–21%). Dicranostyles (1–10%), Banisteriopsis (1–5%), and Rhamnaceae (0–2%) were the most characteristic taxa. Pollen from palms increased by 8% toward the end of the zone at 10,620 cal yr BP (221 cm), mainly dominated by Astrocaryum with values of 7%. Herbs had the highest percentages of the record (12%), mainly dominated by Cyperaceae (2–3%) and Poaceae (1–6%) taxa.
Pollen zone A2 (10,600–9770 cal yr BP; 210–81 cm; 7 samples)
The main characteristic of this interval was the increase of pollen (30,700 to 66,000 grains/cm3) concentration. Additionally, microcharcoal and macrocharcoal had the highest influx of the record at 10,580 cal yr BP, 200 cm depth (6000 and 1400 particles/cm2/yr, respectively) (Fig. 6). Lowland forest vegetation dominated this zone by 84% to 89%. Eschweilera had the highest frequencies of the record by 0% to 5%. New taxa occurred like Sebastiania type (0–4%), Amanoa (1–3%), Tabebuia type (0–1%), Casearia type 1 (0–2%), and Guarea (0–5%), while others increased their frequencies such as Swartzia (3–11%), Mabea (10–21%), Casearia type 2 (0–5%), Ormosia (1–5%), and Myrtaceae (2–8%). Lianas had frequencies of 4% to 7%; palms, 2% to 4%; and herbs, 4% to 9%. Highland taxa were represented by less than 1% only with Myrsine (Fig. 5).
Pollen zone A3 (9770–8240 cal yr BP; 81–44 cm; 5 samples)
Pollen concentration was the highest of the record (114,000–142,000 grains/cm3) (Fig. 6). Lowland forest vegetation dominated this period by 85% to 89%. Sebastiania type increased markedly by 12% to 22%. Some forest taxa were reduced, such as Swartzia by 1% to 3% and Myrtaceae by 0% to 2%, but others were increasing, like Annona (0–2%), Guarea (1–3%), and Ormosia (3–6%). Palm pollen had a slight increase from 2% to 8% toward the end of this zone. Pollen-spore sample diversity had the lowest values of the record at 8240 cal yr BP (45 cm).
Pollen zone A4 (1600–650 cal yr BP; 44–0 cm; 10 samples)
A significant change of vegetation for zonation was found at 44 cm depth, where the hiatus in sedimentation occurred. Pollen concentration was reduced toward the top (2000–88,000 grains/cm3). Pollen-spore sample diversity increased and had the highest values of the record as well as richness (Fig. 6). Lowland forest pollen dominated by 77% to 89% and oscillated through this interval. Several forest taxa increased their percentages toward the top from 1560 cal yr BP (42 cm), such as Swartzia (4–8%), Sapotaceae (1–3%), Ferdinandusa (1–4%), Myrtaceae (2–6%), Ormosia (2–8%), Shefflera (0–1%), Amanoa (1–4%), Virola (0–3%), and Alibertia edulis (1–3%), among others. Pioneer taxa were present in this interval with taxa such as Vismia (1–4%) and Cecropia (1–4%). Annona and Guarea were not represented toward the top. Sebastiania type (0–9%) decreased toward the top of the core. Lianas (2–9%) showed a moderate increase, dominated by Dicranostyles (1–4%). Microcharcoal influx oscillated between 290 and 2470 grains/cm2/yr, and the highest values are observed at 1400 calyrBP (35 cm depth). On the contrary, macrocharcoal had the lowest values of the record between (50 and 340 particles/cm2/yr).
INTERPRETATION AND DISCUSSION
The geochemical and sedimentologic data from Lake Acarabixi showed different phases of water flux pulses through the Holocene (Fig. 4). Despite this variability in river dynamics, the igapó forests were dominant through the early and late Holocene (Figs. 5–7). The continuous signal of fires reflected that charcoal particles deposited according to the river and lake dynamism. The vegetation reconstruction of Lake Acarabixi did not show direct evidence of human influence. Pollen grains of Zea mays or other agricultural crops were absent (Bush et al., Reference Bush, Dolores and Colinvaux1989). However, the detection of local fires during the late Holocene, which is known to be much wetter than the early Holocene (Apaéstegui et al., Reference Apaéstegui, Cruz, Sifeddine, Vuille, Espinoza, Guyot and Khofri2014; Wang et al., Reference Wang, Edwards, Auler, Cheng, Kong, Wang, Cruz, Dorale and Chiang2017), likely reflects human activity in the area (Ritter et al., Reference Ritter, Andretti and Nelson2012).
River dynamics
The early Holocene
Starting at 10,840 cal yr BP, Lake Acarabixi was characterized by the direct influence of water flux from the Rio Negro channel, which prevented the accumulation of organic matter and pollen into the lake (Fig. 4). The water flux deposited into the lake high amounts of coarse to medium sands with variable bulk organic matter of C/N and δ13C. The Rio Negro was probably a braided river with high flood discharge at that time. Starting at 10,790 cal yr BP (302 cm), forest taxa dominated, though with an open canopy and the presence of lianas (Fig. 5). Taxa indicative of open areas were growing in the area as well, such as Cyperaceae and Poaceae (Figs. 5 and 6). This kind of vegetation was detected earlier at 10,820 cal yr BP (320 cm) with high values of δ13C, which may indicate that grasses developed on the banks during low water periods (Martinelli et al., Reference Martinelli, Victoria, Camargo, Piccolo, Mertes, Richey, Devol and Forsberg2003; Meyers, Reference Meyers2003).
The heterogeneous landscape containing some open areas and the high floods can be attributed to a marked seasonality and a more variable climate at that time in the region (Latrubesse and Franzinelli, Reference Latrubesse and Franzinelli1998). During the early Holocene, the area could have been subject to strong seasonal contrasts of heavy rains, which was reflected in the sedimentologic, geochemical, and pollen analyses of the Lake Acarabixi record at that time (see the “Human disturbances” section).
During the early Holocene, high-altitude taxa such as Myrsine and Hedyosmum were present in the area as well (Bush et al., Reference Bush, De Oliveira, Colinvaux, Miller and Moreno2004; D’Apolito et al., Reference D’Apolito, Absy and Latrubesse2013, Reference D’Apolito, Absy and Latrubesse2017). These taxa may have been transported from the neighboring mountains of Pico Neblina (220 km) or Serra Imeri (120 km) during previous colder periods. Alternatively, it is possible that these species established themselves at lower elevations, as has been suggested for Hedyosmum in other Amazonian records (Van der Hammen and Hooghiemstra, Reference Van der Hammen and Hooghiemstra2000). However, as discussed by D’Apolito et al. (Reference D’Apolito, Absy and Latrubesse2017), Myrsine might have been adapted to the soil and geomorphological conditions at that time (Table 2 and Fig. 4). Moreover, the availability of nutrients was very low compared with younger periods (Fig. 4), which could have allowed edaphically constrained species like Myrsine to develop in the area. A long-distance transport from upstream could be also considered because of the direct riverine influence into the lake at that time (Figs. 5 and 7).
After 10,660 cal yr BP, the sediments in Lake Acarabixi became richer in silt and organic matter, probably because of a lateral migration of the river channel and the onset of a lacustrine phase from 10,590 to 8240 cal yr BP (201 to 45 cm). At the start of such phase, sediments had low δ13C and high C/N values, which indicated an organic matter origin from the Rio Negro podzols and their humic substances production and/or from the igapó forest organic matter degradation (Martinelli et al., Reference Martinelli, Victoria, Camargo, Piccolo, Mertes, Richey, Devol and Forsberg2003; Junk et al., Reference Junk, Piedade, Wittmann, Schöngart and Parolin2010). The highest maxima of carbon accumulation rate occurred at 10,590 cal yr BP (201 cm) as a result of the fining upward of the sediments that ended at 8240 cal yr BP (45 cm). As will be described in the following paragraphs, the pollen concentration reflected stability of the river after 10,590 cal yr BP, indicating that the sedimentation change was the result of not only channel migration but also a reduction of river dynamics.
The sedimentation rate started to slow down around 8970 cal yr BP (60 cm) when the last facies of the sequence (clayey silt sediments) were deposited (Figs. 3 and 4). Afterward, the deposition of sediments coming from Rio Negro stopped, probably because of the migration of the river channel from Lake Acarabixi, near its present-day position.
The development of the floodplains in the Lake Acarabixi sediments was the result of the filling up of the Rio Negro valley that began 14,000 yr ago (Latrubesse and Franzinelli, Reference Latrubesse and Franzinelli2005). According to Latrubesse and Franzinelli (Reference Latrubesse and Franzinelli2005), the Rio Negro was filled from the upper reaches to downstream, the former being the first to be filled by lateral erosion and active deposition on the floodplains. Sand dune formation was also reported in the region with an end of activity dated by thermoluminescence at 7800 ± 0.9 yr BP (Carneiro Filho et al., 2002). In the case of Lake Acarabixi (reach II in Latrubesse and Franzinelli, Reference Latrubesse and Franzinelli2005), the filling up ended around 8240 cal yr BP (44 cm) where the hiatus in sedimentation occurred.
From 10,660 cal yr BP onward, there was an increase of pioneer species such as Cecropia, Celtis, and Trema. The genus Cecropia is well known as shade intolerant and a colonizer of open and disturbed areas (Bush and Colinvaux, Reference Bush and Colinvaux1988; Ledru, Reference Ledru2001; Rodríguez-Zorro et al., Reference Rodríguez-Zorro, Enters, Hermanowski, Costa and Behling2015). Likewise, Celtis and Trema are indicators of disturbed environments (Gentry, Reference Gentry1996; Marchant et al., Reference Marchant, Almeida, Behling, Berrio, Bush, Cleef and Duivenvoorden2002; Rodríguez-Zorro et al., Reference Rodríguez-Zorro, Enters, Hermanowski, Costa and Behling2015). Several species found in the record during this period are tolerant of extended flooding, such as Eschweilera, Macrolobium, Myrtaceae, Swartzia, and Astrocaryum. Palms such as Astrocaryum commonly occur on riverbanks and islands in the igapó forests of Rio Negro and are able to tolerate flood conditions from 30 to 340 days (Piedade et al., Reference Piedade, Parolin and Junk2006).The presence of these taxa, combined with the sedimentologic and geochemical analyses, suggests a high flooding dynamism during the early Holocene (Figs. 4 and 5). On the other hand, regional fires, as seen in the Lake Acarabixi charcoal records (Fig. 6), occurred during this period of the early Holocene, confirming the contrasted seasonality and/or strong climate variability at that time.
From 10,590 to 8240 cal yr BP, the forest developed a closer canopy, and lianas and herbs were reduced (Figs. 5 and 6). Species common in river margins started to be dominant, like Mabea, Alibertia edulis, and Ormosia (Ferreira and Stohlgren, Reference Ferreira and Stohlgren1999; Montero, Reference Montero2012) (Fig. 7). At that time, the pioneer species were reduced, indicating that the forest recovered from the direct river influence recorded in the previous period. Astrocaryum, Iriartea, and Mauritia palms also grew around the lake during this time.
From 9870 to 8240 cal yr BP, a marked increase in the taxon Sebastiania type was noticed. The genus is not reported in the Amazon region in Brazil (REFLORA, 2016). Furthermore, the morphology of this pollen grain has been placed at the genus Symmeria in past paleoecological reconstructions in the Amazon region (Absy, Reference Absy1979; Behling et al., Reference Behling, Keim, Irion, Junk and Mello2001), but after literature and reference collection research, it is more probable that this pollen grain belongs to one of the taxa that are included into the tribe Hippomaneae, where the genus Sebastiania is located (Absy, Reference Absy1979; Colinvaux et al., Reference Colinvaux, De Oliveira and Moreno1999; Correa et al., Reference Correa, Barros, Silvestre-Capelato, Pregun, Raso and Cordeiro2010; Sales et al., Reference Sales, Barreto and Barth2011; reference collection at the Department of Palynology and Climate Dynamics, Goettingen, Germany). Considering that the taxonomy of the Hippomaneae tribe is not yet clear, we are not sure of the plant origin of the pollen grain of Sebastiania type, and therefore, its interpretation should be taken with caution (Esser, Reference Esser2012; Athiê-Souza et al., Reference Athiê-Souza, Melo, Silva, Oliveira and Sales2015).
The late Holocene
After the hiatus in the sedimentation, the deposition of sediments resumed at ca. 1600 cal yr BP with silty coarse to medium sands, which were very rich in leaves and bark fragments (Fig. 3). The supply of sediments into the lake might have come from intense discharge events from the small present-day tributaries. The variation on the bulk organic matter of C/N and δ13C and the high amount of leaves and bark fragments were the result of the organic matter degradation from the igapó forest in the surroundings of the lake (Fig. 4).
Forest vegetation predominated on either side of the hiatus (Figs. 5 and 6). From 1600 to 650 cal yr BP, pollen concentration decreased as a result of the new input of coarser sediments into the lake, but the richness and diversity had higher values than in the early Holocene (Fig. 6). The pollen signal showed less riverine influence, with dominant taxa such as Mabea, Swartzia, Eschweilera, and Alibertia edulis (Fig. 7) (Ferreira and Stohlgren, Reference Ferreira and Stohlgren1999; Montero, Reference Montero2012), which was also reflected with an increase in the palms Astrocaryum, Iriartea, and Mauritia.
Human disturbances
Today, the floodplains near Lake Acarabixi are highly used by fishermen, and fish is the only protein source for people in the region (Silva, Reference Silva2011). Their activities are developed in lakes and small river channels between the cities of Santa Isabel and Barcelos (Silva, Reference Silva2011) (Fig. 1). These fishing activities affect the igapó forests, especially during low water levels of the river. The camping areas of the fishermen are the main source of ignition in the igapós, which affects forest structure and favors the invasion of herbaceous vegetation (Ritter et al., Reference Ritter, Andretti and Nelson2012; Flores et al., Reference Flores, Fagoaga, Nelson and Holmgren2016). Some communities from the area of Barcelos also practice slash-and-burn agriculture, clearing areas of ~0.5 to 2.0 ha, primarily along small levees near riverbanks and in small patches of terra firma forest (Silva et al., Reference Silva, Tamashiro and Begossi2007).
Considering the geomorphological and hydrologic evolution of the floodplains of the middle-upper part of Rio Negro during the Holocene (Latrubesse and Franzinelli, Reference Latrubesse and Franzinelli2005), it is most probable that the human activities were only registered during the late Holocene at Lake Acarabixi. During the early Holocene, the direct influence of the main river channel and the high input of coarse sediments in the area could not have been suitable to inhabit or for agricultural activities. On the other hand, a more seasonal period with the driest climatic conditions during the last ca. 100,000 yr occurred at that time in the Amazon region (e.g., Behling and Hooghiemstra, Reference Behling and Hooghiemstra2000; Mosblech et al., Reference Mosblech, Bush, Gosling, Thomas, van Calsteren, Correa-Metrio, Valencia, Curtis and van Woesik2012; Cheng et al., Reference Cheng, Sinha, Cruz, Wang, Edwards, d’Horta, Ribas, Vuille, Stott and Auler2013; Rull et al., Reference Rull, Montoya, Nogué, Vegas-Vilarrúbia and Safont2013; Wang et al., Reference Wang, Edwards, Auler, Cheng, Kong, Wang, Cruz, Dorale and Chiang2017). In this context, the high signal of fires in Lake Acarabixi could be associated with long dry periods on a regional scale, because the igapó forests are very vulnerable to periods with reduced rain (Flores et al., Reference Flores, Piedade and Nelson2014, Reference Flores, Fagoaga, Nelson and Holmgren2016). Charcoal analyses from the upper part of Rio Negro revealed that natural fires are very common after 30 days without rain, because the dry seasons are more severe upstream (Clark and Uhl, Reference Clark and Uhl1987; INMET, Ministério da Agricultura, Pecuária e Abastecimento, http://www.inmet.gov.br. [accessed July 10, 2016]); thus the charcoal signal of Lake Acarabixi could reflect a riverine input from upriver because the lake had a direct influence from the main Rio Negro channel at that time (INMET, Ministério da Agricultura, Pecuária e Abastecimento, http://www.inmet.gov.br. [accessed July 10, 2016]). Therefore, the effect of fires around Lake Acarabixi points to a drier environment rather than human disturbances during the early Holocene.
During the late Holocene, Lake Acarabixi was already separated from the main river channel. Because of a more localized depositional environment, and the known increased precipitation levels during the late Holocene, the charcoal found in the record is likely attributable to human activity. Additionally, archaeological sites along the middle-upper part of the Rio Negro have been dated to the late Holocene (Neves et al., Reference Neves, Petersen, Bartone and Heckenberger2004; McMichael et al., Reference McMichael, Palace, Bush, Braswell, Hagen, Neves, Silman, Tamanaha and Czarnecki2014). In the upper part of the Rio Negro, at the Colombian and Venezuelan border, recovered pottery shreds were dated to 3750±10 yr BP (Saldarriaga and West, Reference Saldarriaga and West1986; Clark and Uhl, Reference Clark and Uhl1987). The increase of herbs and the presence of pioneer taxa, along with the presence of small pieces of charcoal (Table 2) that occurred in Lake Acarabixi from 1600 to 650 cal yr BP, may be associated with human activity (e.g., Berrío et al., Reference Berrío, Hooghiemstra, Behling, Botero and Van der Bog2002; Bush et al., Reference Bush, Silman, Toledo, Listopad, Gosling, Williams, De Oliveira and Krisel2007; da Silva Meneses et al., Reference da Silva Meneses, da Costa and Behling2013; Rull et al., Reference Rull, Montoya, Nogué, Vegas-Vilarrúbia and Safont2013; Cordeiro et al., Reference Cordeiro, Turcq, Moreira, Rodrigues, Simões Filho, Martins, Santos, Barbosa, Conceição and Rodrigues2014). Additionally, during the late Holocene an increase of disturbance indicators was detected in Lake Acarabixi by the presence of pioneer species such as Vismia, Celtis, and Cecropia trees (Marchant et al., Reference Marchant, Almeida, Behling, Berrio, Bush, Cleef and Duivenvoorden2002; Mesquita et al., Reference Mesquita, Massoca, Jakovac, Bentos and Williamson2015). As it is known, Cecropia and Vismia grow very fast after continuous pruning or fires (especially Vismia), and Celtis could indicate canopy turnover (Marchant et al., Reference Marchant, Almeida, Behling, Berrio, Bush, Cleef and Duivenvoorden2002; Mesquita et al., Reference Mesquita, Massoca, Jakovac, Bentos and Williamson2015). Consequently, the presence of these taxa could suggest a canopy turnover as a result of the eradication of forests and the ignitions made by humans. The fires that occurred during this period, however, did not affect the vegetation that grew in the area. Recent studies focused on ethnobotany in the region have reported that species like Margaritaria sp., Ocotea spp., Aniba sp., Genipa sp., and Miconia sp. are used for fishing (Silva et al., Reference Silva, Tamashiro and Begossi2007). Some of the taxa were found in the Lake Acarabixi record, but they did not change in abundance, indicating there was no sign of enrichment or depletion by human populations during this time (Figs. 5 and 6).
The stability of igapó forests
The paleoecological reconstruction from Lake Acarabixi shows that although the lake suffered different disturbances through time, the forest composition from the early and late Holocene periods did not change drastically; Alchornea, Mabea, Moraceae/Urticaceae, Melastomataceae, and Myrtaceae, among other lowland forest taxa, remained stable (Fig. 6). Similarly, the results from the region of the Hill of Six Lakes showed that forest taxa such as Alchornea, Myrtaceae, and Moraceae/Urticaceae remained with few variations during the Holocene as well (e.g., Bush et al., Reference Bush, De Oliveira, Colinvaux, Miller and Moreno2004; D’Apolito et al., Reference D’Apolito, Absy and Latrubesse2013).
We interpret the prevalence of fire events (high abundance of charcoal) during the early Holocene as a result of regional input from upstream, where the seasonality is stronger and forests are more sensitive to long dry periods (Clark and Uhl, Reference Clark and Uhl1987; Flores et al., Reference Flores, Piedade and Nelson2014, Reference Flores, Fagoaga, Nelson and Holmgren2016). During the early Holocene, the forest structure in the studied area seems not to have been affected by the fires (Ritter et al., Reference Ritter, Andretti and Nelson2012; Flores et al., Reference Flores, Piedade and Nelson2014, Reference Flores, Fagoaga, Nelson and Holmgren2016), but rather by the river dynamics, as is reflected by the presence of species that are tolerant to long periods of flood (see the “River dynamics” section). On the other hand, during the late Holocene the forest dominance prevailed, although species less tolerant to floods and pioneers expanded. An increase in diversity at that time might be related to the lacustrine conditions besides human influence in the surroundings of the lake (Fig. 6).
Comparing our results with the paleoecological reconstructions from Urrego (Reference Urrego1991) at the Mariñame Island in the Caquetá River in Colombia revealed that although both of the records showed the filling of two river valleys and forest dominance during the Holocene, the development of the forest was different. The forest in the Mariñame Island had a clearer successional development since the early Holocene. The succession started with a forest dominated by Cecropia trees and ended with a swampy forest dominated by Mauritia flexuosa. In contrast, the vegetation from Lake Acarabixi showed that the forest was very heterogeneous, and clear successional stages were not detected. Such differences between the two sites might be related to the river origin.
When comparing the Lake Acarabixi results with a nonriverine record like Lake Pata in the Hill of Six Lakes (e.g., Bush et al., Reference Bush, De Oliveira, Colinvaux, Miller and Moreno2004; D’Apolito et al., Reference D’Apolito, Absy and Latrubesse2013), it can be seen that forest was dominant in both of the studied sites. However, the effect of regional fires was not detected in Lake Pata. The later can be related to the fact that Lake Pata lays on an inselberg and the fire effect from the upper Rio Negro lowlands cannot be detected.
CONCLUSIONS
For the early and late Holocene, Lake Acarabixi is interpreted as a highly dynamic floodplain lake, in which forest vegetation persisted. Our record showed the development of a floodplain lake that was subject to a direct influence by a channel from the Rio Negro from 10,840 to 8240 cal yr BP. After 10,590 cal yr BP, palynological and sedimentologic data indicate a decrease in river dynamics. Later, the lake revealed more lacustrine phases from 1600 to 650 cal yr BP.
During the early Holocene (10,840 to 8240 cal yr BP) the forest had a more open canopy, the signal of regional and local fires was high, and species that tolerate long periods of flood developed. This conjunction of high floods and droughts indicates a climate with contrasted seasonality and/or strong interannual variability. Afterward in the late Holocene (1600 to 650 cal yr BP), the forest was composed of species that were less tolerant to longer periods of flooding with a decrease in the signal of fires.
The main finding of our record is the forest stability during the two analyzed periods, which is comparable to the results of Lake Pata records (Colinvaux et al., Reference Colinvaux, De Oliveira, Moreno, Miller and Bush1996; Santos et al., Reference Santos, Cordeiro, Silva-Filho, Turcq, Lacerda, Fifield, Gomes, Hausladen, Sifeddine and Albuquerque2001; Bush et al., Reference Bush, De Oliveira, Colinvaux, Miller and Moreno2004; Cordeiro et al., Reference Cordeiro, Turcq, Sifeddine, Lacerda, Silva Filho, Gueiros, Potty, Santelli, Pádua and Patchinelam2011; D’Apolito et al., Reference D’Apolito, Absy and Latrubesse2013). The early Holocene reflected the regional input coming from the discharges of the main channel of the Rio Negro. The huge amounts of charcoal particles are consistent with the early Holocene dry period detected along the basin. On the other hand, during the late Holocene, the lake reflected a more local signal in which forest was not drastically affected by the human disturbances that occurred in the surroundings.
In general, the extreme (geomorphology, water flux, and climate) conditions of the Rio Negro modeled the plasticity of forest species during the early and late Holocene. The low nutrient content, the dominance of quartz sediments, and the extreme changes in water flux between low and high river stands played an important role for vegetation to adapt in the studied area, but such an effect did not drastically affect forest development.
ACKNOWLEDGMENTS
This research was funded by the convention of the French Research Institute for Development (IRD) and the Brazilian National Council for Scientific and Technological Development (CNPq), The International mixed laboratory (LMI)-PALEOTRACES 2 and the BELMONT FORUM: Palaeo-Constraints on Monsoon Evolution and Dynamics (PACMEDY) - ANR-15-JCLI-0003-03. The DAAD-COLFUTURO scholarship is thanked for funding the first author. Catalina González and an unknown reviewer are thanked for their comments on an earlier version of this manuscript. We are grateful to the LMC14, Saclay in France for the AMS dates; Marcelo C. Bernardes and Arnaldo C. Filho for field trip assistance; Enrique Moreno and Daiana Fontes (Smithsonian Tropical Research Institute, Panamá) for helping on pollen identification; and Thomas Giesecke, Anggi Hapsari, and Vincent Montade (University of Goettingen) for stimulating discussions.