Between 1619 and 1865, slavery was an important feature of economic life in North America, with enslaved workers playing a crucial role in producing agricultural commodities for global markets – first tobacco, rice, indigo, and (some) sugar, then, in the nineteenth century, the vast quantities of cotton that fueled the Industrial Revolution in Europe and the United States. Ever more enslaved women, men, and children labored in American fields, supplied by the African slave trade (until 1808) and by natural population growth; by 1860, almost four million persons (including nonworking children) – the world’s largest enslaved workforce – produced tremendous wealth for planters, merchants, and industrialists (Beckert Reference Beckert2015; Tadman Reference Tadman1989).
Not only did ever more enslaved workers labor in agriculture in the decades before the US Civil War, but their per-person output also increased dramatically. The average amount of cotton picked per day by each enslaved worker, for example, more than quadrupled from 28.1 pounds in 1801 to 114.2 pounds in 1862 – an average annual productivity increase of 2.3 percent (Olmstead and Rhode Reference Olmstead and Rhode2008). This increase in productivity in the cotton fields of the South was on par with the increase in output per worker in Manchester cotton mills at the height of the Industrial Revolution in England (Baptist Reference Baptist2014: 128; Clegg Reference Clegg2015: 283). This is remarkable not least because, unlike in English textile production, cotton-picking in the antebellum period had no technological improvements.Footnote 1 Workers continued to sow cotton and harvest cotton bolls by hand, as they had for centuries.
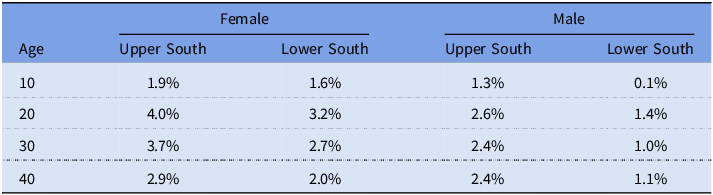
Between 1800 and 1860, there were also dramatic changes in output per enslaved worker in other agricultural goods. Corn production on southern slave plantations, for example, increased by more than 5.5 percent annually between 1849 and 1859 – a growth rate significantly higher than the change in the size of the enslaved population over the same period (Vedder et al. Reference Vedder, Klingaman and Gallaway1974: 37).Footnote 2 Even more generally, and as documented in Table 1, in the two decades before the Civil War, average growth in gross national product produced per enslaved worker of different ages, genders, and geographic profiles increased significantly. The yearly growth in real output per worker was largest in the upper South and for enslaved workers in their twenties and thirties. Between 1839 and 1859, for example, the output of 20- and 30-year-old enslaved women in the upper South increased, on average, by 3.8 and 3.4 percent per year, respectively. In the lower South, over the same period, the output of 20-year-old enslaved workers increased by 2.9 percent per year for women and 1.1 percent per year for men. While varied across gender and age profiles, these increases were significant (Stelzner and Beckert Reference Stelzner and Beckert2023).Footnote 3
Yearly increase in real gross national product by age between 1839 and 1859

Table 1 Long description
The table presents the yearly increase in real gross national product by age between 1839 and 1859, categorized by gender and region. It has four rows and five columns. The columns are labeled Age, Female Upper South, Female Lower South, Male Upper South, and Male Lower South. The row labels are ages 10, 20, 30, and 40. Row 1: Age 10, Female Upper South 1.9 percent, Female Lower South 1.6 percent, Male Upper South 1.3 percent, Male Lower South 0.1 percent. Row 2: Age 20, Female Upper South 4.0 percent, Female Lower South 3.2 percent, Male Upper South 2.6 percent, Male Lower South 1.4 percent. Row 3: Age 30, Female Upper South 3.7 percent, Female Lower South 2.7 percent, Male Upper South 2.4 percent, Male Lower South 1.0 percent. Row 4: Age 40, Female Upper South 2.9 percent, Female Lower South 2.0 percent, Male Upper South 2.4 percent, Male Lower South 1.1 percent.
Source: Calculation using Table 2 from Stelzner and Beckert (Reference Stelzner and Beckert2023). The upper South includes North Carolina, South Carolina, Maryland, Delaware, Tennessee, and Virginia; the lower South includes Alabama, Arkansas, Florida, Georgia, Louisiana, Mississippi, and Texas.
The higher rates of growth of output per enslaved person in the upper South were a result of lower overall values for output per worker in the upper South compared to the lower South and the fact that in this period the upper South was exporting hundreds of thousands of enslaved people to the lower South. In the decade before the Civil War, around a quarter of a million enslaved people were forced to migrate from the upper to the lower South.Footnote 4 Consequently, the reduction in the number of enslaved workers due to forced migration to the lower South increased the value of those that remained.
While these factors explain the higher productivity growth in the upper South, they do not explain why productivity increased in the lower South as well. In this article, we seek to explain the primary drivers of the productivity growth of enslaved workers in cotton production, a crop predominantly grown in the lower South. As we will see, a number of scholars have weighed in on this topic (Baptist Reference Baptist2014; David and Temin Reference David and Temin1979; Field Reference Field1988; Fogel and Engerman Reference Fogel and Engerman1974a, Reference Fogel and Engerman1974b, Reference Fogel and Engerman1977; Olmstead and Rhode Reference Olmstead and Rhode2008, Reference Olmstead and Rhode2020; Toman Reference Toman2005; Wright Reference Wright1978, Reference Wright2006; and Rosenthal Reference Rosenthal2018). Nonetheless, and despite claims to the contrary, the evidence presented thus far is inconclusive. To get to a better understanding of the problem, we explore the relevant literature, focusing on assessing the relative importance of biological innovation in cotton seeds on one side and the change in supervision of enslaved workers in order to force them to work harder on the other. While not the only factor, increased monitoring of workers to labor more intensely seems to have been a significant driver of the increase in cotton output per enslaved worker during the antebellum era.
The literature
From the late 1950s through the 1980s, economists debated the profitability of antebellum slavery and its productivity relative to free labor in the North and to slavery in the eighteenth century. These debates provide potential answers to the source of increased agricultural output per enslaved worker. For example, Fogel and Engerman (Reference Fogel and Engerman1974a, Reference Fogel and Engerman1974b) argued that cotton production, which became the dominant crop on slave plantations in the decades before the Civil War, was characterized by economies of scale derived from organizing enslaved workers into gangs that allowed for an increase in the intensity of work. In contrast, Wright (Reference Wright1978) argues that, after 1820, the increase in output per worker was largely the result of an increase in the degree to which small farms dedicated land and labor to planting and picking cotton.Footnote 5
More recently, the debate has focused on biological innovation in cotton seeds and the use of coercion by overseers and slave owners to push enslaved workers to labor more intensely. In a much-debated book, Baptist (Reference Baptist2014) contended that a major part of the increase in output per enslaved worker in cotton picking came from forcing workers to work harder, more efficiently, and for longer hours by increasing the application or threat of violence. Baptist largely built this argument using historical accounts by formerly enslaved persons and their contemporaries in the antebellum South, including accounts from those who escaped slavery and published autobiographies in the nineteenth century, like Fredrick Douglass and John Brown, who emphasized the importance of whipping and other forms of cruel treatment to extract work. Baptist (Reference Baptist2014: 139) claims that “[n]o one [in antebellum America] was willing … to admit that they lived in an economy whose bottom gear was torture.”
This line of argument has received considerable pushback. For starters, Baptist misrepresented some of the contemporary accounts he used to make his point.Footnote 6 And some scholars have argued that the sources he recounted accurately did not represent the whole body of sources available (Clegg Reference Clegg2015; Hilt Reference Hilt2017; Olmstead and Rhode Reference Olmstead and Rhode2018). Citing twentieth-century interviews with former enslaved workers, Clegg highlights that many ex-slaves expressed positive sentiments about their former masters.Footnote 7 In contrast, Baptist pulls from accounts written by individuals who escaped slavery and published through the abolitionist press, which cast slavery in a much more violent light. Clegg argues that as a result of this selective use of sources, Baptist “overestimated” the degree of extreme violence practiced by slave owners on their human property. Clegg thus claims that the possibility of pushing enslaved workers to labor more intensely through increased violence is not borne out by the historical record.Footnote 8
Yet, even in the testimonies of former enslaved workers conducted in the early twentieth century that Clegg and others present as painting a less horrendous picture, slightly over 60 percent of those interviewed had been whipped – and thus had been subject to acts of extreme brutality. Of these interviewees, 40 percent were under ten years old in 1865, and another 26 percent were from ten to fourteen years old at the end of the Civil War (Escott Reference Escott1979).
Moreover, the largest group of twentieth-century interviews of former enslaved workers was conducted by the federal government through the Works Progress Administration, which employed mostly white interviewers. The dynamics of this situation – only a little more than six decades after the end of slavery – affected what individuals said. We know, for example, that interviewee Reverend Ishrael Massie summarily stated that “I ain’t tellin’ white folks nutin’ ‘cause I’m skeer’d to make enemies” (Escott Reference Escott1979: 3–11). Interviewee Martin Jackson explained that “Lots of old slaves closes the door before they tell the truth about their days of slavery. When the door is open, they tell how kind their masters was and how rosy it all was” (Escott Reference Escott1979: 3–11). Indeed, in the interviews conducted under the aegis of the federal government, even when the interviewer was Black, former enslaved workers may not have felt comfortable recounting all the gruesome details of slavery to representatives of a government that supported Jim Crow in the South and systemic racism throughout the country. Consequently, these accounts, especially those conducted by the federal government, are biased in favor of presenting slavery in a more positive light.
To be sure, the centrality of discipline enforced by the lash does not necessarily mean that it increased over time, and, in contrast to Baptist’s argument, enforcing a higher intensity of work might not have entailed a continuous increase in the frequency of torture per enslaved worker. Pushing enslaved workers to labor more intensely could have occurred through increased monitoring, quotas for picking, threat of torture, or some combination of these strategies – all operating within an already long-established violent system of production. We know that over the same period, the masters of the loom in Lowell and Lawrence, Massachusetts, were able to extract more work effort from free labor through increased expectations and supervision of weavers but without bodily violence. And in non-mechanized factories in the North, productivity also increased without any changes in technology. These gains could have come from increased utilization of women and children and a more intense disciplinary regime.Footnote 9 We come back to this issue in later sections of the article to analyze the centrality of physical discipline on the plantation and the potential for extracting increasing work effort from enslaved workers through increased supervision.Footnote 10
The other recent explanation for the increase in productivity of enslaved workers in cotton production is that biological innovation allowed for improvements in cotton seeds that made picking easier and thus faster (Olmstead and Rhode Reference Olmstead and Rhode2008). New seed varieties yielded taller plants that reduced the need to bend down when picking. Other seed improvements led to greater lint content per boll and greater ease of picking the lint from the boll. Picking was the bottleneck in the cotton production process (for medium and large farms that produced cotton at capacity), so biological innovation that made picking easier would mean an increase in the amount of cotton produced per worker. Olmstead and Rhode (Reference Olmstead and Rhode2008: 1129) point to this biological innovation in cotton seeds when they imply that southern planters and plant breeders should be celebrated much like the inventors of the spinning and weaving machines that revolutionized cotton textile production in England in the late eighteenth and nineteenth centuries are.
Olmstead and Rhode support these claims using plantation-level data to test the degree to which the increase in cotton picking per worker was a result of economies of scale, learning by doing (which includes planters pushing enslaved workers to work harder), the movement to superior lands in the lower South, and biological innovation in cotton seeds. When they control for differences in output per worker stemming from factors specific to the plantation on which workers labored, they find no statistical support for economies of scale driving the increase in workers’ productivity. They create a proxy for learning by doing and find no statistical support for it as an explanatory variable. In contrast, they observe that the movement of cotton production to the lower South was statistically and economically significant in explaining some increase in fieldhand productivity. However, they argue that a part of the explanatory power of moving to more fertile lands stems from the adoption of new cotton seeds that were more adaptable to the conditions in the lower South. Additionally, they create a proxy for biological innovation in cotton seeds and find statistical support for it as an explanatory variable. Because new seed varieties were more suitable to the lower South, Olmstead and Rhode argue that their estimate of the economic importance of biological innovation represents a lower bound in explaining the increase in fieldhand productivity.
As a result of Olmstead’s and Rhode’s work, economists have accepted biological innovation in cotton seeds as the main explanation for the increase in cotton output per enslaved worker during the antebellum period.Footnote 11 Yet there are good reasons to question the strong version of their arguments. While biological innovation undoubtedly played a role, it was not the only factor increasing productivity. To start, Olmstead and Rhode’s regression results are only valid to the degree to which their proxies for biological innovation and pushing enslaved workers actually represent the explanations they are intended to. In terms of biological innovation, Olmstead and Rhode do not control for specific new strands of upland cotton (like Mastodon, Okra, Twin, Boyd’s Prolific, Vicks 100-Seed, Banana, Pomegranate, Hogan, etc.) used on a given plantation. They only control for upland cotton as a group and Sea Island cotton as a group. Nonetheless, despite these inherent limits in their data and mode of analysis, Olmstead and Rhode confidently argue that there was essentially continuous biological innovation in upland cotton. They aim to make up for the missing data by using a year trend variable as a proxy for biological innovation in upland cotton seeds – i.e., for the new varieties of upland cotton that they do not have data on. Thus, increases in productivity per worker over time that are not explained by their control variables, such as pushing workers to work harder, are – because of how this proxy is constructed – captured by the time trend Olmstead and Rhode used in their regression analysis and attributed to biological innovation in cotton seeds.
At the same time, Olmstead and Rhode fail to adequately control for the potential finding that enslaved workers were pushed to work harder through increased monitoring or another strategy. They have neither data on the intensity of the work regime on a given plantation in a given year nor data that could clearly serve as a proxy for it, like the degree of monitoring on the plantation. Instead, they use the year in which production took place times the log of the picking crew size as a proxy for managerial learning-by-doing and push workers to work harder but offer no discussion of why this proxy is appropriate or better than other possibilities. Potentially, irrespective of the number of enslaved workers that labored for them, planters could have learned how much to push workers and different strategies to ensure such output as time passed. Indeed, we will see evidence of such a dynamic later in the article. In which case, a year trend variable might be a better proxy for learning how to push enslaved workers to work harder. But using a year trend variable as a proxy for pushing enslaved workers to labor more intensely would be completely correlated with their proxy for biological innovation in cotton seeds, and thus their regression would not be able to determine which of the two factors was driving the increase in productivity per worker.
Consequently, their regression analysis only shows that the lower South was associated with higher cotton output per enslaved worker and that the average quantity of cotton picked per enslaved worker increased over time. This is still a very important finding. It shows, among other things, that something else was going on besides an increase in the amount of land and labor that small farms dedicated to cotton. In fact, the data Olmstead and Rhode used to identify the increase in cotton picked per fieldhand were predominantly pulled from medium-sized plantations that were unlikely to be risk-averse because of limited resources – as once argued by Wright (Reference Wright1978, Reference Wright2006).Footnote 12
Yet, this argument is also limited in terms of explaining productivity differentials between the upper and lower South. The possible source of that divergence could have been many factors, ranging from more fertile lands to new seeds better adapted to those lands to geographic differences in the structure of production or the degree of supervision of enslaved workers. Because other explanations are not adequately controlled for, there is no reason to believe that Olmstead and Rhode’s proxy for biological innovation captures only biological innovation in cotton seeds and not other factors as well.
In short, the existing literature does not clearly identify the sources of productivity gains of enslaved workers in the antebellum South. In the following sections, to better understand the growth in output per worker, we will look at contemporary evidence of biological innovation in cotton seeds, plantation records, and the 1850 and 1860 censuses to understand the relationship between biological innovation and increased monitoring of enslaved workers. As we will see, while new varieties of cotton played a role in accelerating production, pushing workers to labor more intensely through increased monitoring was an important driver of the increase in agricultural output per enslaved worker over the antebellum era.
Innovation in cotton seeds
The evidence produced thus far by scholars in support of biological innovation in cotton seeds as the root cause for increased efficiency of labor in cotton production has come from regression analysis of plantation-level data and contemporary commentary. As highlighted above, the evidence from regression analysis does not provide any direct support for biological innovation in cotton seeds, because it does not adequately control for other potential drivers. The other evidence comes mainly from contemporary agricultural journals and newspapers, for example, from the American Mercury, which reported in 1826 that David Moore, an Alabaman planter, caused “unusual excitement” when his enslaved workers picked “the enormous quantity of 8921 pounds of seed cotton, being an average of 330 to the hand for two days … It was Mexican cotton, which bears very large bolls, and was beautifully opened.”Footnote 13
Yet, a closer look at the agricultural press’ touting of biological innovation sows doubts about these arguments. For sure, the agricultural press and newspapers in the antebellum North and South were a major form of communication during the period, and planters needed to procure seeds from a distance to secure them against the deterioration of their crop (Gray Reference Gray1933). At the same time, from at least the 1830s on, advertisements for new seeds were a significant source of revenue for contemporary agricultural journals and newspapers (Rhode Reference Rhode2021). Consequently, it is possible that the agricultural press and newspapers covering the new seed varieties were biased in favor of supporting the new seeds.
As one planter explained, occasionally seeds bought from planters from afar would, due to favorable circumstances, cause “the cotton plant to yield more than the usual amount to the planted acre, and instantly it is announced that a new variety of cotton has made its advent upon the earth, and the local newspapers teem with advertisements, and the commission houses are filled with magic seed.” “The “White Seed,” “the Petite Gulf,” “the Multibolled,” “the Mastodon,” “the Sugar-loaf,” and “the Prolific,” continued the planter, “are the fanciful names of these wonderful germinators, which have for a time commanded admiration, and then sunk into obscurity.”Footnote 14
In fact, some antebellum planters and newspaper readers went further, underscoring press bias. In 1855, Fair Forest, a South Carolinian planter, asserted that “[i]t is the duty of the agricultural press to expose all manner of humbug. A press which plays into the hands of speculators, and panders to the appetite of ignorance, is not a proper organ for our interests, and should be abandoned. The northern agricultural press, in a great degree, has become one vast advertising sheet for the propagation of humbug.”Footnote 15
Out of ignorance or hubris, some agricultural journals were surprisingly open in their bias. For example, sometime before 1848, a cotton seed called Banana was introduced with claims that it was superior to its predecessors. In 1849, General G. D. Mitchell announced another new seed variety – Pomegranate – with great fanfare from multiple agricultural journals. In early December of the same year, the Vicksburg Whig published two articles stating that Pomegranate was an “eminently superior variety of Cotton Plant” and that “its singular fruitfulness … [is] at once bewildering and delightful to the eye.Footnote 16 ” A few months later, by the end of 1849, however, prominent agricultural reformists were already asserting that Pomegranate was just Banana under a new name. In early 1851, having promoted Pomegranate extensively, William Jones, the publisher and proprietor of the Southern Cultivator, confronted Mitchell about these accusations, and Mitchell “admitted that he had obtained seeds from his neighbor Gibson” (Jones Reference Jones1852: 105) Jones later explained “that his and G’s cotton were the same; that G. called his Banana; that he, M., called his Pomegranate; and that they both originally obtained their seed from the same source.Footnote 17 ” (This seems to have also occurred with other varieties; a prominent agricultural reformer and proponent of biological innovation in the antebellum South, Martin W. Philips, for instance, contended that another strand, Hogan, was also identical to Banana.Footnote 18 )
Making this worse (and clearer for our purposes), Jones kept this crucial piece of information from the readers of the Southern Cultivator (1850: 8) for more than a year, revealing it only after a much larger controversy around the seed had developed. “At first, we thought of exposing him [Mitchell] promptly, through this journal,” Jones explained in his defense in the same issue, “but after deliberation, in consideration of the fact that he had then only a few sacks of seed, we concluded to suspend any publication on the subject.” Jones then defended Mitchell. “That the Pomegranate and Banana Cotton are the same variety, there is no doubt, and this fact Gen. M. admitted to us. The only deception he has practiced was in changing the name and denying that it was the Banana Cotton … we consider the name a matter of little consequence.”
Other agricultural periodicals also suppressed information to help new cotton seed varieties sell. In the mid-1840s, for example, Richard Abbey of Yazoo City, Mississippi, introduced what he called Mastodon cotton seed – which Rhode described as “the most celebrated new seed” of the period (Rhode Reference Rhode2021). Indeed, in 1845, A. B. Allen, the editor of the American Agriculturalist, described Mastodon as “never before grown in the United States” and “indeed remarkable.” In 1846, Abbey published two in-depth accounts of Mastodon cotton in the American Agriculturalist. “The introduction of this variety of cotton,” he stated confidently, “into the United States forms a new era in their history.” “It is the decided opinion of many well-informed persons,” Abbey added, “that it [Mastodon] will in a few years entirely supersede the cultivation of all other cotton in this country, except perhaps, the Sea Island.”
Despite this sanguinity, in a small note squeezed at the end of a subsequent issue published over a year later, A. B. Allen explained that “[s]ince the appearance in our pages of Mr. Abbey’s articles on this subject [of Mastodon cotton seeds], we have received several communications from planters in Mississippi, saying that they have tried this cotton in different kinds of soil, highlands, swamp, alluvions, and creek-bottoms, and that it has not answered their expectations. Indeed, they say it is not equal to common Mexican [cotton], and very plainly pronounce it a ‘gross humbug on the planting interest’” (American Agriculturalist 1847). Allen went on to say they were awaiting further tests and as a result declined to publish the communications of the discontented planters, imploring readers to “not condemn [Mastodon] too hastily.” In the following three years, the American Agriculturalist published no articles on Mastodon – despite additional indications of its fraudulence.Footnote 19 Thus, this wasn’t learning by doing but suppressing information to sell seeds and advertisements.
In a letter to the US Commissioner of Patents in 1848, Martin W. Philips confirmed Allen’s failure: “In your report you allude to Mastodon cotton as promising something. I regret to say that you were mistaken, and that, like other bubbles, it burst.” Philips claims that Mastodon received the prominence it did because of the agricultural press: “It never would have done more than excite some attention in this country had it not been for the press. The introducer of that seed puffed them so much that many were deceived.” When he tried to expose Mastodon as a fraud, Philips was censured: “After trying them one season,” continued Philips, “I put them down as unfit, and so worded a report to a public journal. The editor thought me wrong, and would not publish” – another indication of the press’ dependence on revenue generated by advertisements for seeds (Philips Reference Philips1848: 506).
Given the bias in favor of new cotton varieties, it is notable that some editors criticized the process by which new seeds were introduced and hyped up. In 1839, for instance, Edmund Ruffin (Reference Ruffin1839: 253), the editor and proprietor of the Farmer’s Register, stated that “there is no mode so effectual to introduce a new thing, whether it be of the most valuable kind, or the most palpable humbug and cheat, as to ask for it a price of the most unheard of enormity … it has come to be considered that the high price asked for new seeds, &c., is alone sufficient evidence of their intrinsic value; and hence dupes are continually made by the vilest and grossest impositions that can be imagined”
In a letter to the editor of the Southern Cultivator in 1853, cotton grower John Farrar (Reference Farrar1853: 108–9) stated that “I, fool like, went in for enough [Mastodon seeds] one year to plant 12 acres; and as the Devil said when he sheared the hog, ‘a great cry for a little wool.’” Farrar explained that some of the new cotton seeds, including Banana, Pomegranate, Sugar Loaf, Texan Burr, Silk, Brown, and Jethro, were good. However, even for those, “there has been more said in the papers, in the way of puffing, than was justifiable.” Farrar’s contentions sparked a heated response from others, and eventually the editors of the Southern Cultivator, Daniel Lee and D. Redmond, responded by saying, “We have always maintained that humbuggery and charlatanism have done more to retard the progress of Southern Agriculture than anything else. If every planter had the courage to come down upon it, like Mr. Farrar, there would be some hope of reform. Albeit, our experience does not extend to that period ‘whereunto the memory of man runneth not.’ We have still been here long enough to outlive many a theory endorsed by great names; and now and then, to pay too dear a price for our whistle” (Farrar Reference Farrar1853: 108–9).
Rhode (Reference Rhode2021) documents the price trajectory of new cotton seeds in the antebellum South, finding that the seeds for which he documented more critical commentary had the same price trajectory as seeds for which he found little or no critical commentary. In both cases, new cotton seeds were initially offered at a very high price, with prices plummeting in subsequent years. Somewhat puzzlingly, Rhode concludes that the seed varieties that contemporaries identified as humbugs were not frauds and the common trajectory of prices was the market functioning properly in a period without intellectual property rights, which did not exist in the United States for biological innovation in seeds until the twentieth century. Cotton seeds had to have been increasing in productivity, asserts Rhode in a tautological argument, because fieldhand productivity continued to grow throughout the antebellum period.
The evidence from agricultural journals casts significant doubt on the proposition that biological innovation in cotton seeds was almost continuous and that these improvements explain most of the increase in cotton output per enslaved worker during the antebellum period in the United States. More plausible is a different interpretation, namely that there were some instances of genuine improvement in seed variety – for instance, in the early 1800s, when cotton seeds were smuggled out of Mexico into the United States and crossed with local varieties. In this case, the biological innovation in what was called Mexican cotton occurred over centuries of farming by the indigenous people of Mexico that was only later appropriated by cotton planters in the United States (Beckert Reference Beckert2015). At the same time, many instances of purported biological innovation in cotton seeds were not actually such, as we saw with Pomegranate and Hogan cotton seeds. It also seems that some supposedly new cotton varieties were worse than generic Mexican cotton, as in the case of Mastodon and other cotton seed varieties like Okra.Footnote 20 At the very least, we can conclude that claims in the agricultural press for the miraculous properties of new cotton strains were frequently overblown or outright false.
Forcing workers to work harder
If biological innovation cannot fully explain the remarkable productivity increases on cotton plantations, what other factors might have been at play? We know these productivity gains were not due to changes in machine technology since there was almost no mechanical innovation in cotton picking during this period. But what about labor effort? In this section, we investigate the possibility that workers were made to work harder by analyzing labor management on plantations. To see if enslaved workers were pushed to increase output per worker through increased supervision, we explore commentary in agricultural journals and other contemporary sources on the dynamic in the South between slave owners, overseers – the managers of enslaved production – and enslaved workers. We next look at plantation data from the 1850 and 1860 censuses to analyze the relationship between output per worker, the number of improved acres on a farm, soil quality, the number of free and enslaved workers, and the ratio of overseers to enslaved workers. Finally, we look at how the degree of monitoring of enslaved workers changed over time. As we will see, there is significant evidence that more intense supervision of enslaved workers and the social dynamic in the overseer job market would have increased pressure on enslaved workers to labor more intensely as the antebellum period progressed.
Plantation management – contemporary evidence
Supervision and discipline were of the utmost importance on Southern plantations because enslaved workers were expected to labor intensely, receiving in return nothing but a subsistence allotment of housing and food. These workers had already received one of the most intense punishments possible – a life sentence of bondage. The main role of the overseer, the slave owner, or one of the slave owner’s adult sons was thus to push enslaved workers to engage in a certain level of work, make sure they achieved it, and punish them if they did not.
Virginia planter John Hartwell Cocke, for example, instructed his overseer, “You are expected to have learned by your own experience what is a day’s work for a hand in every variety of Plantation Business, & daily compare what your people do with what they ought to do & thus perfect your judgement in such matters, enabling you to calculate beforehand what can be performed” (Cocke Papers, Reference Cocken.d.). Supervision was central to ensuring the work was done. In instructions to his overseers, George Washington made exactly this point: “When an overlooker’s back is turned, the most of them [the enslaved workers] will slight their work, or be idle altogether” (Randolph Reference Randolph1852: 4). On departing from a plantation in the interior cotton districts of the lower South, Fredrick Law Olmsted (Reference Olmsted1860: 176) observed, “I passed the hoe-gang at work in the cotton-field, the overseer lounging among them carrying a whip; there were ten or twelve of them [enslaved workers]; none looked up at me. Within ten minutes I passed five who were plowing, with no overseer or driver in sight, and every one stopped their plows to gaze at me.” In lamenting his inability to leave the planation, Moore Rawls, an overseer on Lewis Thompson’s plantation stated that “[t]he truth is no man can begin to attend to such a business with any set of negros, without the strictest vigilance on his part” (Lewis Thompson Papers 1858).
Supervision was always coupled with intense punishment when an enslaved worker subverted or was perceived to subvert the overseer’s authority. For example, in the early 1800s, F. Cuming of Mississippi noted that “the overseers of plantations in this whole territory, are for the most part a rough, unpolished, uncouth class of people, which perhaps proceeds from their being made use of literally as negro drivers, to keep those unfortunate wretches to their work in the field, and to correct them for all real or supposed offences” (Thwaites Reference Thwaites1904: 328). Thomas Ruffin of North Carolina thought a new overseer should start by handing out strict punishments to make enslaved workers “fear him at the beginning” of his tenure, which would help him maintain better discipline thereafter (Scarborough Reference Scarborough1966: 75). Overseers who were unable to enforce strict discipline were fired and often had trouble finding a new job. In a letter from one planter to another about a prospective overseer, for example, the former employer stated, “I objected to his [the overseer’s] want of authority among the negroes … I expressed the opinion that he would probably succeed very well with a set of well-trained hands, accustomed to stand in fear of their overseer, & execute their work well, but thought with my hands, who knew him, he never could” (Francis Terry Leek Diary 1854). Unsurprisingly, given the centrality of discipline, the overseer was not hired by the inquiring planter.
Multiple elements in the structure of the employment market for overseers in the antebellum South created incentives for them to push the enslaved workers under their charge to labor more intensely. First, the overseer was responsible for the output of the plantation – even when he did not control all decisions about planting. Many in the antebellum South took this as a given. One overseer from Burnsville, Alabama, wrote to The American Cotton Planter in 1854: “The cotton must be made, regardless of seasons, or worms, or the overseer must suffer the consequences.Footnote 21 ” And a slave-owning cotton farmer wrote that “a very skillful and energetic planter told me that he would dismiss his overseer for a failure in plants as surely as for any other cause … I agree with him” (Ibid. 1853, Vol. VI, January, p. 216). Many elements of crop production were not under the overseer’s control, but one that was was the intensity of work he could attempt to extract from the enslaved workers in his charge. Thus, the overseer often relied on pushing workers to meet a stipulated output.
The overseer pay structure often created incentives to push enslaved workers to labor more intensely. During the colonial period, it was common for overseers to get paid a share of the net output they produced.Footnote 22 In the nineteenth century, this method of payment was less frequent, but it existed into at least the 1840s. In 1834, William Radford, president of the New London Agricultural Society in Georgia, argued that an “obstacle to improvement … is the habit of giving a share of the crop, instead of a fixed salary, to the overseer or manager. When a part of the crop is given, it is the interest of the overseer (and we are all guided by our interest,) to make the highest product on the farm for one year … He does not know that he will be employed longer than one year; and the largeness of his crop for that year, not only advances his present interests, but is his best recommendation for employment elsewhere.”Footnote 23 In 1844, a planter complained in the Southern Cultivator about the continuing payment of overseers through shares: “There are also some proprietors of considerable property and pretension to being planters, who give their overseer a proportion of the crop for his wages; thus bribing him by the strongest inducements of self-interest, to overstrain and work down everything committed to his chargeFootnote 24 , .”
In the antebellum period, it became more common to pay overseers a fixed wage. But even then, and especially in the lower South, many overseers received a bonus if the crop was larger than some stipulated amount (Scarborough Reference Scarborough1966: 30–31). In 1847, for example, Dr. Walter Wade, the proprietor of “Ross Wood” in Natchez, Mississippi, gave his overseer a base wage of $350 for the year plus a bonus of $25 if the plantation produced 150 or more bales of cotton and one of $50 if it produced 175 or more bales. In 1848, Dr. Wade changed the scale by which the bonus was calculated, making it $1 for each bale of cotton over 150.Footnote 25 In 1845, Mississippi planter Francis Terry Leak implemented a fixed bonus system like Wade’s 1847 system. In 1860, Leak changed his bonus so that it was based on the size of the crop, offering J.C. Smith, his overseer in that year, $1 per bale for every bale over 300.Footnote 26
Even overseers without incentives in their pay structure to push enslaved workers to labor more intensely worked under a system in which decisions about retaining and hiring rested, to a large degree, on the amount of cotton that overseers could extract from enslaved workers. One Georgian planter wrote that “[i]t is too often true, that they [overseers] are encouraged, by the owner or employer to glide over the farm as rapidly as possible, either directly by words, or by the conduct which is unequivocal in its meaning – in bestowing praise when much work has been done, and in maintaining profound silence as to its quality.Footnote 27 ” Another planter explained that “the universal custom [is to look] … only to the result of the crop as the sole test of good management,” while a third stated that “a planter usually rates the merits of the overseer exactly in proportion to the number of bags of cotton he makes, and of course the overseer cares for nothing but to make a large crop.”Footnote 28
Because there were very high turnover rates in the overseer market (Genovese Reference Genovese1974), all overseers, whether paid a fixed wage, bonuses for crops above a certain amount, or a share, had strong incentives to push enslaved workers due to the centrality of output per worker in finding and retaining a post.
But planters were, after all, the employers of their overseers, and contemporaries frequently noted that planters were ultimately at fault for the focus on how much cotton an overseer could produce. In an address to the Agricultural Society of Barbour County, Alabama, in 1846, John A. Calhoun stated, “It is too commonly the case that masters look only to the yearly products of their farms, and praise or condemn their overseers by this standard alone, without ever once troubling themselves to inquire into the manner in which things are managed on their plantations, and whether he may have lost more in the diminished value of his slaves by overwork than he has gained by his large crop … if masters would lay less stress on the mere crop results of the plantation, and place more stress on the proper treatment of their slaves, and the systematic management of their plantation,” many of the evils attributed to the overseer system would be alleviated.Footnote 29
Other scholars have also pointed to planters’ focus on yearly output. Rosenthal (Reference Rosenthal2018: 94) analyzed plantation account books in antebellum America, concluding that “[d]etermining how much cotton an enslaved man or woman could pick was a near obsession among southern planters, and they used careful records to help determine this maximum.” Many of the account books planters used, including those created by Thomas Affleck that became popular toward the end of the antebellum era, had pre-designed pages that facilitated calculations of depreciation and net rates of return. However, most planters who used such account books ignored these pages and just kept detailed records of the cotton each enslaved worker picked per day. In an analysis of 65 plantations that used Affleck’s record books, Beamish (Reference Beamish2021: Table 2, 43) points out that only 18 percent of the planters he examined filled out forms on expenses, depreciation, and net profit. This focus does not seem to have been exclusive to farmers who hired overseers. Scarborough (Reference Scarborough1966: 6) asserts that all farms, even those without overseers, suffered from soil wastage and deterioration of stock.
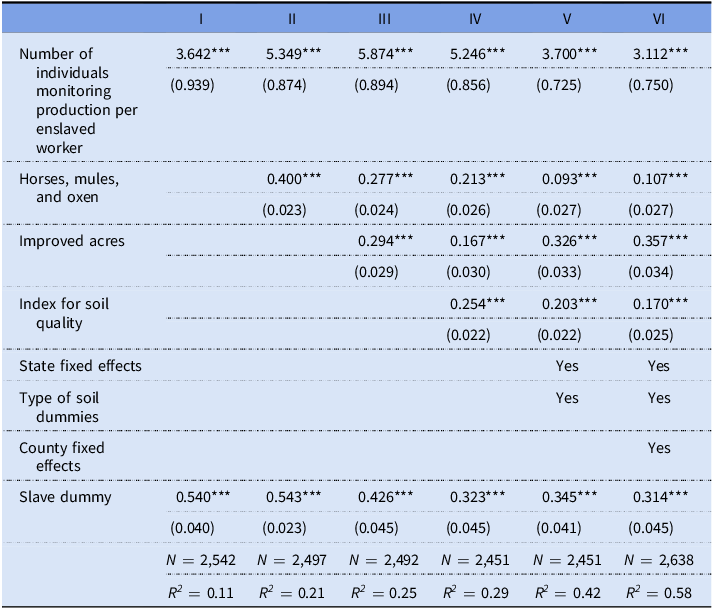
The effect of supervision on cotton output per hand

Table 2 Long description
The table presents data on the effect of supervision on cotton output per hand. It has six columns labeled I, II, III, IV, V, and VI, and multiple rows with specific variables. The first row shows the number of individuals monitoring production per enslaved worker with values and standard errors. The second row lists the number of horses, mules, and oxen with corresponding values and standard errors. The third row indicates improved acres with values and standard errors. The fourth row provides an index for soil quality with values and standard errors. The table also includes state fixed effects, type of soil dummies, and county fixed effects. The last row shows the slave dummy with values and standard errors. The table includes the number of observations (N) and the R-squared values for each column.
Source: Regression analysis of Parker-Gallman sample of Census of 1860. A number in parentheses represents robust standard errors. ‘*’, ‘**’, and ‘***’represent statistical significance at the 10, 5, and 1 percent level, respectively.
Rivalry between planters seems to have played a role in perpetuating a focus on output per enslaved worker. Planters “are always bragging – you must have heard them,” an Alabama tradesman told Fredrick Olmsted (Reference Olmsted1860: 56–7), “how many bales their overseer has made, or how many their plantation has made to a hand. They never think of anything else.” The tradesman went on to explain that this social dynamic pressured other masters to follow the same strategy. “You see, if a man did like to have his n****** taken care of, he couldn’t bear to be always hearing that all of the plantations round had beat his. He’d think the fault was in his overseer. The fellow who can make the most cotton always gets paid the best.” Such a dynamic would be consistent with a desire to show social status through income or wealth. Given that cotton output per enslaved worker was a common unit of measurement that implied a general level of revenue, bragging among planters about output per hand was a way to show relative income.
The focus of planters on yearly output per worker seems to have made many overseers opposed to producing other crops like corn and the very crop experimentation that is central to biological innovation in cotton seeds. “We often hear planters boasting of having made six, eight, and sometimes ten bags of cotton to one hand,” explained another planter, “and when one speaks of making a ‘fine crop,’ it is understood that he has turned out five or six bags or more per hand. Occasionally, an old planter will take the liberty of inquiring of one of these fine croppers how much corn he has made, but seldom venture furtherFootnote 30 .” “No wonder he [the overseer] opposes all experiments,” concluded the planter, “or, if they are persisted in, neglects them; presses everything at the end of the lash; pays no attention to the sick, except to keep them in the field as long as possible, and drives them out again at the first moment, and forces sucklers and breeders to the utmost. He has no other interest than to make a big cotton crop. And if this does not please you and induce you to increase his wages, he knows men it will please, and secure him a situation with.”
Martin W. Philips, a proponent of biological innovation in the antebellum South, made the same point. “Overseers are not interested in raising children, or meat, in improving land, or improving productive qualities of seed, or animals. Many of them do not care whether property has depreciated or improved, so they have made a crop [of cotton] to boast of” (Olmsted Reference Olmsted1860). In the same letter to the US Commissioner of Patents where he argued that Mastodon cotton seeds were frauds, Philips also highlighted, disapprovingly, the centrality of pushing enslaved workers to increase output per worker in the South: “The south will not resort to labor-saving implements,” Philips argued, “nor to permanent improvements, until, like our brethren at the north, we are forced to exertion and to economise. It requires no skill, no knowledge, no science, to make five or six, or eight or ten, bales per hand … all that is required is to plant enough, and then to push everything to keep the crop above grass. There are many who rate themselves as very superior planters, because by working 14 to 16 hours per day they make more bales than their neighbors who work only 10 to 13 hours.Footnote 31 ” (US Commissioner of Patents 1848).
Plantation management – a statistical test
The labor market dynamics highlighted in the previous section meant that enslaved workers were likely pushed more intensely. To support the strong qualitative evidence presented above, in this section we look at quantitative data to illuminate the relationship between cotton output per enslaved worker and the degree of monitoring on the farm. We do so while controlling for other factors relevant to productivity. To start, we use data from Parker and Gallman (Reference Parker and Gallman1992): a sample from the 1859 census containing statistics on 5,228 southern farms in 405 major cotton-producing counties. It includes data on farm location, soil type and quality, quantity of production, number of free and enslaved workers, number of adult white males on the farm, if the slave owner was present on the farm, number of horses, oxen, mules, and cows, the farm’s value, and more.
To look at the importance of monitoring in extracting more output from enslaved workers, we regress the log of cotton output per worker on the number of individuals supervising production per enslaved worker and a number of other important controls:
 ${\rm{ln}}{\left( {{Y \over L}} \right)_i} = \alpha + \beta {S_i} + \sum\nolimits_{k = 1}^2 {{\gamma _k}} {\rm{ln}}\left( {{F_{ki}}} \right) + \sum\nolimits_l {{\delta _l}} {D_{li}} + \sum\nolimits_m {{\theta _m}} {T_m} + \sum\nolimits_n {{\rho _n}} {C_n} + {\varepsilon _i}$
 ${S_i}$
represents the degree of supervision on plantation
 $i$
. While the Parker and Gallman data set has variables for male and female overseers of different age groups, it only includes those who specified to census field agents that they were overseers. However, many white adult males, including potentially the slave owner or his adult sons, who lived on plantations have no profession listed in the census long forms and were likely supervising the production of enslaved workers. For example, in his multi-volume history of agriculture in the United States, Lewis Gray (Reference Gray1933: 548) writes, “After the close of the colonial period there were few white employees on Southern plantations except overseers and, on Louisiana sugar plantations, engineers and sugar makers.” Indeed, the individuals who tabulated the census in Washington, DC, in 1850 and 1860 made the same assumption that white individuals living on slave plantations in 1859, even when their profession wasn’t specified, were likely overseers, whose role was strictly limited to supervising enslaved workers, production of the crop, and maintenance of livestock and other holdings of their employer.Footnote
32
We thus construct a variable for the degree of supervision using the number of white adult males listed as overseers, wage laborers, or those who did not have another, non-farming profession listed and divide this by the number of enslaved workers of working age on the plantation.Footnote 33
 ${F_{ki}}$
are the factor inputs – number of livestock and acres of improved land – per units of labor on a given plantation. Here we are envisioning a Cobb-Douglass production function where the coefficients for the factor inputs represent their output elasticity.
The summation in the middle of Equation (1)
 $\mathop \sum \nolimits_l {\delta _l}{D_{li}}$
represents the other potential factors that contribute to cotton output per worker. They include 28 dummy variables that control for the type of soil on the plantation and an index for the quality of soil and, finally, a dummy variable for if the plantation had one or more enslaved workers of working age. The second to last summation in Equation (1),
 $\mathop \sum \nolimits_m {\theta _m}{T_m}$
, represents 11 dummy variables for the state in which the plantation is located, and the last term in Equation (1),
 $\mathop \sum \nolimits_n {\rho _n}{C_n}$
, encompasses 363 dummy variables for the county in which the farm was located.
For the number of individuals monitoring production and enslaved workers on the farm, the dataset provides values for males and females of different age cohorts – from less than six months of age to 90 years of age or older. For workers pulled from the farm owner’s family, wage laborers, and enslaved workers, we use the total number of those between 10 and 59 years of age. For farms without enslaved workers, the total number of laborers is the total number of family members and wage laborers between 10 and 59 years of age. For farms with enslaved workers, the total number of laborers is the number of enslaved workers between 10 and 59 years of age. For the number of individuals monitoring production, we use the total number of overseers, wage laborers, and free males between 20 and 49 years of age on farms with enslaved workers.
In Table 2, we display the results. The estimates for state-fixed effects show that, on average, plantations in the upper South produced less cotton per worker than similar plantations in the lower South. For example, plantations in North and South Carolina produce, on average, only 78 percent of the cotton output per worker of a similar farm in Alabama. However, not all states follow this simple logic. For example, the coefficient for Florida is more negative than that of North and South Carolina and is statistically significant.
Many social scientists have highlighted that the lower South had higher output per worker compared to the upper South.Footnote 34 But this increased productivity in the lower South could stem from different sources, for instance, more fertile lands or the combined effect of more fertile lands and the increased adaptability of new seed varieties to this region – as Olmstead and Rhode (Reference Olmstead and Rhode2008) argued.
However, the increased labor productivity could also stem from different labor regimes in the different regions. Indeed, we found some evidence of this in the previous section: Pay structures for overseers that incentivized increasing output per worker were more common in the lower South. Below we look at several subsections of the dataset to check the robustness of our results and analyze differences in labor regimes across regions. We find statistical evidence that corroborates that the effect on cotton output per worker from increased supervision in the lower South is significantly larger than in the upper South, and the difference is statistically significant.
The string of dummies for soil types also has significant explanatory power. For example, the soil type for 15 plantations was “costal marshes.” All these plantations were in Beaufort County, South Carolina. The estimate for this soil type is consistently statistically and economically significant and highly negative – meaning, everything else being equal, those 15 plantations on average produced less cotton per worker. This makes sense, as the plantations in Beaufort County planted Sea Island cotton, which was more difficult to pick than upland cotton – but also finer and more valuable.
Potentially, some of the new upland seed varieties that were more productive fared better in specific soil types. Thus, this string of dummies also potentially controls for the variety of upland cotton used on the plantation. At the same time, the index for soil quality, which is constructed using data on the value of the farm, is positive and statistically significant. If there is any correlation between seed varieties and use of fertilizers or other implements that increases the value of the farm, this variable also potentially picks up the use of different upland cotton seed varieties.
As we can see from regressions I through VI in Table 2, increased supervision of enslaved workers led to an economically and statistically significant increase in cotton output per worker. Even after controlling for the number of livestock, improved acres, soil type and quality, county and state fixed effects, and whether the farm had at least one enslaved worker, increasing the number of individuals monitoring production from one per one hundred enslaved workers to two per one hundred enslaved workers increased output per worker by 3.3 percent.
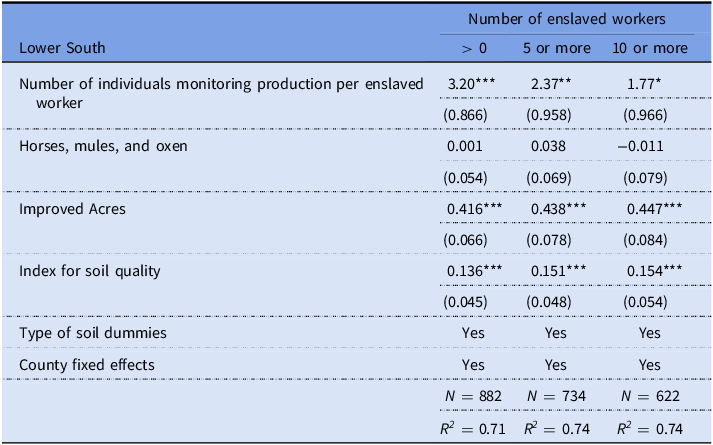
To check for robustness, in Table 3 we re-ran the regressions on several subsets of the data – looking at the effect of increased supervision on farms in the upper and lower South individually and for farms with one or more, five or more, or ten or more enslaved workers. In Table 3, we display the results for the lower South.
The effect of supervision on cotton output per hand

Table 3 Long description
A table with four rows and five columns comparing the effect of supervision on cotton output per enslaved worker in the Lower South. The columns are labeled as follows: Number of enslaved workers with sub-columns for greater than 0, 5 or more, and 10 or more. The rows are labeled as follows: Number of individuals monitoring production per enslaved worker, Horses, mules, and oxen, Improved Acres, Index for soil quality, Type of soil dummies, and County fixed effects. Each cell contains numerical values and standard errors in parentheses. Notable trends include higher values for the number of individuals monitoring production per enslaved worker and improved acres across all columns. The table also includes the number of observations (N) and the R-squared (R2) values for each column.
Source: Regression analysis of Parker-Gallman sample of Census of 1860. The lower South includes Alabama, Arkansas, Florida, Georgia, Louisiana, Mississippi, and Texas. A number in parentheses represents robust standard errors. ‘*’, ‘**’, and ‘***’represent statistical significance at the 10, 5, and 1 percent level, respectively.
As we can see, in the lower South, increased supervision of enslaved workers is associated with an economically large and statistically significant increase in cotton output per worker on farms with one or more, five or more, or ten or more enslaved workers. When looking only at farms with ten or more enslaved workers, for example, increasing the number of individuals monitoring production from one per one hundred enslaved workers to two per one hundred enslaved workers increased output per worker by 1.8 percent.
In contrast, when looking only at farms in the upper South, we find that an increase in supervision of enslaved workers does not have a statistically significant effect on cotton output per worker – no matter what subset of data is used.Footnote 35 Thus, there is empirical evidence of a difference in labor regimes in the upper and lower South. This difference in labor regimes could be related to the slightly different focus on plantations in these two regions. The upper South was a net exporter of enslaved workers during the antebellum years, and there is evidence that plantation owners in the upper South systematically interfered in the sexual life of their enslaved workers to increase fertility and sell their surplus laborers to plantations in the lower South (Sutch Reference Sutch1972).Footnote 36 As a result of this difference in focus, plantation owners in the upper South might have put more limits on overseers and others supervising production or communicated a different role for overseers than did slave owners in the lower South.
The data we use to calculate the effect of supervision on output seems to confirm that plantations in the upper and lower South had different focuses.Footnote 37 Two thirds of the plantations in the upper South that had an individual specifically listed as an overseer in our sample have more female enslaved workers than males. Half of the plantations in the upper South with an overseer have 17 percent more enslaved women than men, and almost 30 percent of the plantations with an overseer in the upper South have 50 percent more enslaved adult women than men. In contrast, in the lower South, 50 percent of plantations have more male enslaved workers than females, and 13 percent of plantations have an equal male-to-female ratio.Footnote 38
These results are robust to how we define supervision. For example, if the degree of supervision is changed to a dummy for whether the farm had an individual who specifically listed his profession as an overseer, we see the same outcome in terms of increase in output per worker, differences in the upper and lower South, and robustness to subsets of farms with different numbers of enslaved workers.
From the above results, it is statistically possible that the increase in supervision stemmed from relatively prosperous farms using their extra income to hire people to supervise production. In that case, the causality would move in the opposite direction. While a theoretical possibility, we have already seen evidence that these are not likely the determining dynamics. For example, we saw in the previous section that planters were driven to increase output through monitoring enslaved workers and maintaining a strict disciplinary regime and that they conveyed this message to the individuals they hired to oversee production. Additionally, in Table 3, we specifically look at plantations with 10 or more enslaved workers of working age. In this case, all farms would be relatively prosperous, but we still find evidence that increased monitoring was associated with increased output per worker compared to other prosperous plantations.
To be even more sure, we checked the robustness of our results with panel data. This data comes from the 1850 and 1860 censuses, for which IPUMS has completely digitalized the population censuses. Because farms are not linked between 1850 and 1860, we have to analyze production at the county level. As a result, we look at the average degree of monitoring by overseers of enslaved production in a given county.
To look at the importance of overseers in monitoring production and extracting more work, we want to identify the independent effect of the number of individuals supervising production per enslaved worker on the log of cotton output per worker.Footnote 39 We construct a variable for the number of overseers monitoring enslaved production by counting all white males from the age of 20 to 49 whose occupation was “farm and plantation overseer,” “illegible,” “agricultural laborer,” or “laborer” who lived on farms engaged in production using enslaved workers.Footnote 40
As mentioned above, the IPUMS data on the 1850 and 1860 censuses is complete – meaning it contains data on all 19,981,435 free individuals in 1850 and all 27,451,053 free individuals in 1860 and data on the number of enslaved people attached to each household in both years (Ruggles et al. Reference Ruggles, Nelson, Sobek, Fitch, Goeken, Hacker, Roberts and Warren2024). To estimate the degree of monitoring, we start at the household level and count all individuals in the above categories for each household in 1850 and 1860. We then divide the total number of individuals who are potentially overseers of enslaved production in a household by the number of slaves in the household. In the regression below, we use four different thresholds – if the farm had 5 or more, 10 or more, 25 or more, and 50 or more enslaved workers – to determine if we keep the household observation for constructing county averages. Then, for 1850 and 1860, we take the average monitoring of enslaved production across the remaining households in the county.
To estimate the importance of overseers in extracting more output from enslaved workers, we regress the log of cotton output per worker,
 ${\rm{ln}}{\left( {{Y \over L}} \right)_i},$
in county,
 $i$
, on a cross-term,
 $L{S_i}x{S_i}$
, for if the county was in the lower South and the average degree of monitoring by overseers of enslaved production in the county,
 ${S_i}$
, and a number of other important controls:
 ${\rm{ln}}{\left( {{Y \over L}} \right)_i} = \alpha + \sum\nolimits_j {{\beta _j}} L{S_{ji}}x{S_i} + \sum\nolimits_j {{\beta _j}} L{S_{ji}}x{M_i} + \sum\nolimits_{k = 1}^3 {{\gamma _k}} {\rm{ln}}\left( {{F_{ki}}} \right) + \sum\nolimits_l {{\delta _l}} {C_{li}} + {\varepsilon _i}$
Our interaction variable is crossed with
 $L{S_i}$
to allow the estimates for the coefficients of the effect of supervision of enslaved production to differ in the upper and lower South, given the potential for differences in the labor regimes in the two regions.
 ${M_i}$
represents the ratio of masters on the plantation with a profession listed as “farmer” or “planter” to the number of enslaved workers.Footnote
41
We calculate this term in the same way we do the ratio of outside overseers per enslaved worker (i.e., through using IPUMS complete count for 1850 and 1860) and include this term to see if there was a difference if the enslaved production was supervised by the owner or his sons or an outside overseer. As with the main interaction term, we cross this term with a dummy for if the county was in the upper or lower South.
 ${F_{ki}}$
are the factor inputs – number of livestock, value of farms, and value of equipment in the county in total – and are in log form. As in the previous regressions, we are envisioning a Cobb-Douglass production function where the coefficients for the factor inputs represent their output elasticity. The summation at the end of Equation (2),
 $\mathop \sum \limits_l {\delta _l}{C_{li}}$
, represents the other potential factors that contribute to cotton output per worker, which include county and year fixed effects.Footnote
42
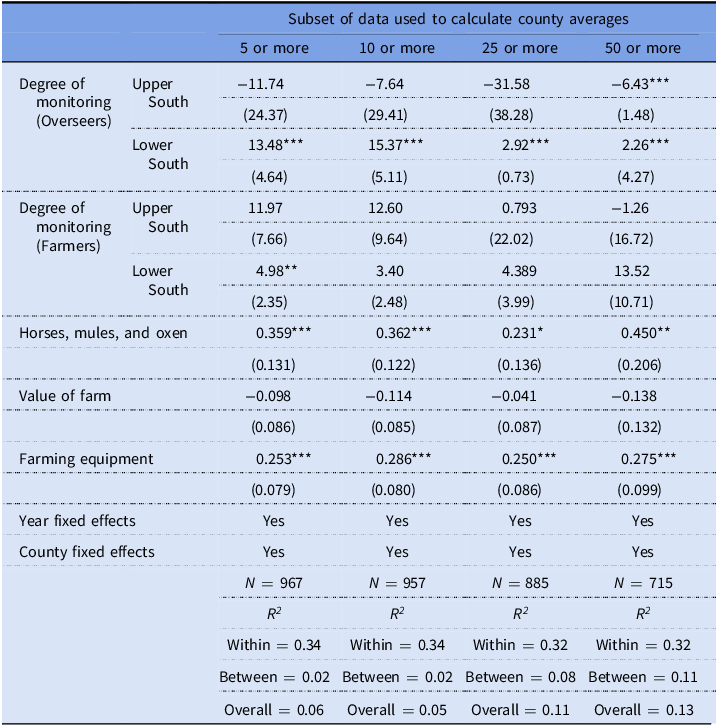
In Table 4, we run panel regressions for each of the four thresholds for calculating county-level averages for supervision of enslaved production. For all the subsets of the data analyzed, we can see that an increase in the number of outside overseers per enslaved worker in counties in the lower South is associated with an economically and statistically significant increase in cotton output per worker in the same county. For example, from looking at the final column of Table 4, increasing the average number of overseers monitoring production at the county level from one per one hundred enslaved workers to two per one hundred enslaved workers increased output per worker at the county level by 4.6 percentage points.Footnote 43
The effect of overseers on cotton output per hand at the county level between 1850–1860

Table 4 Long description
The table presents panel regressions for four thresholds of county-level averages for supervision of enslaved production. It includes data on the degree of monitoring by overseers and farmers, the number of horses, mules, and oxen, the value of the farm, and farming equipment. The table is divided into columns for different thresholds: 5 or more, 10 or more, 25 or more, and 50 or more. Each row represents a different variable or region, with corresponding values and standard errors. The table also includes year and county fixed effects, the number of observations (N), and R-squared values for within, between, and overall. Row 1: Degree of monitoring (Overseers), Upper South, -11.74, -7.64, -31.58, -6.43. Row 2: Degree of monitoring (Overseers), Lower South, 13.48, 15.37, 2.92, 2.26. Row 3: Degree of monitoring (Farmers), Upper South, 11.97, 12.60, 0.793, -1.26. Row 4: Degree of monitoring (Farmers), Lower South, 4.98, 3.40, 4.389, 13.52. Row 5: Horses, mules, and oxen, 0.359, 0.362, 0.231, 0.450. Row 6: Value of farm, -0.098, -0.114, -0.041, -0.138. Row 7: Farming equipment, 0.253, 0.286, 0.250, 0.275. The table also includes standard errors for each value.
Source: Regression analysis of the censuses of 1850 and 1860 utilizing both IPUMS complete count and Haines and Inter-University Consortium for Political and Social Research (Reference Haines2010). The number in parentheses represents robust standard errors. ‘*’, ‘**’, and ‘***’represent statistical significance at the 10, 5, and 1 percent level, respectively.
It should be noted that this outcome is slightly downwardly biased, because the ratio of overseers to enslaved workers is calculated using households with 5 or more, 10 or more, 25 or more, and 50 or more enslaved workers for the respective regression. In contrast, output per worker looks at overall cotton output in the county from farms with any number of workers, enslaved or free. This county-level output is then divided by the number of enslaved people in the county between the ages of 10 and 59. As a result of the inability to capture just the output from farms of the same type as used to create the interaction term, the outcome variable is slightly diluted.
That said, it is meaningful that even with this bias, we identified such a large effect and that the results are highly statistically significant no matter what subset of plantations is used to calculate the ratio of overseers to enslaved workers.
In contrast, in counties in the upper South, we find that an increase in supervision of enslaved workers does not have a statistically significant effect on cotton output per worker – no matter what subset of data is used. Thus, there is empirical evidence of differences in labor regimes in the upper and lower South, which, as we discuss below, could be related to differences of focus in the two regions. As has been said, the lower South had more fertile land than the upper South. The difference could also reflect the new seed varieties being more suitable for adoption in the lower South. However, even if either more fertile lands or new seed varieties were the driving factor behind our findings, it would mean that more intense monitoring of enslaved workers was central to realizing the increase in output per worker from the more fertile lands or the new seed varieties.
At the same time, as a result of having a monetary incentive in increasing the fertility of enslaved women, plantation owners in the upper South might have put more limits on overseers or communicated a different role for overseers compared to slave owners in the lower South. Indeed, we noted in the previous section that bonuses for overseers if cotton output increased above some stipulated amount were more common in the lower South and that overseers were often unsupportive of experimentation in seed varieties.
At the same time, we find that the ratio of slave owners and their adult sons to enslaved workers did not have the same effect on output per worker in the upper or lower South – no matter what subset of data we use. In the previous section, we saw that the dynamic of outside overseers pushing enslaved workers to labor more intensely through increased monitoring was communicated to the overseer by the planter employing him. Despite this, we see here that the increase in output per worker did not result from increased supervision by the slave owner himself and his adult sons, at least on average.
Plantation management – change over time
How did supervision of plantation production change over time in the antebellum South? We can look at this by analyzing change in the total number of overseers by state as calculated by the federal government in 1849 and 1859.
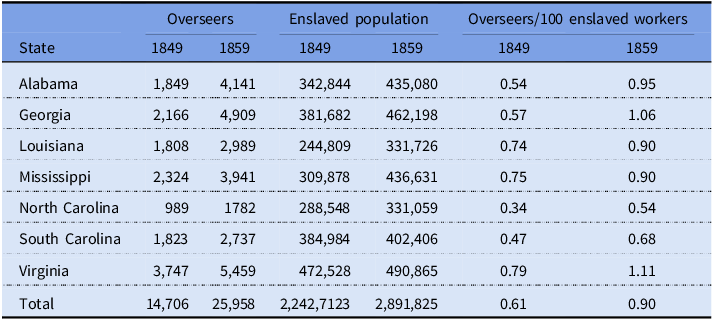
Because census data did not specifically record professions before 1849, we are only able to examine the change in the use of overseers over the decade before the Civil War. In Table 5, we present data from the Seventh and Eighth Censuses on the number of overseers and enslaved workers by southern state for 1849 and 1859. As we see, the number of overseers in all southern states increased dramatically in that decade. If we look at the last two columns of Table 5, we see that the number of overseers increased faster than that of the enslaved population. For example, in Alabama, the ratio of overseers to 100 enslaved workers went from 0.54 in 1849 to 0.95 in 1859 – almost doubling.
Overseers in the South

Table 5 Long description
A table comparing the number of overseers and enslaved population in southern states between 1849 and 1859. The table has 8 rows and 4 columns. The columns are labeled Overseers, Enslaved population, and Overseers/100 enslaved workers. The rows are labeled with the names of the states: Alabama, Georgia, Louisiana, Mississippi, North Carolina, South Carolina, Virginia, and Total. Each row contains data for the years 1849 and 1859. Row 1: Alabama, 1849 Overseers: 1,849, 1859 Overseers: 4,141, 1849 Enslaved population: 342,844, 1859 Enslaved population: 435,080, 1849 Overseers/100 enslaved workers: 0.54, 1859 Overseers/100 enslaved workers: 0.95. Row 2: Georgia, 1849 Overseers: 2,166, 1859 Overseers: 4,909, 1849 Enslaved population: 381,682, 1859 Enslaved population: 462,198, 1849 Overseers/100 enslaved workers: 0.57, 1859 Overseers/100 enslaved workers: 1.06. Row 3: Louisiana, 1849 Overseers: 1,808, 1859 Overseers: 2,989, 1849 Enslaved population: 244,809, 1859 Enslaved population: 331,726, 1849 Overseers/100 enslaved workers: 0.74, 1859 Overseers/100 enslaved workers: 0.90. Row 4: Mississippi, 1849 Overseers: 2,324, 1859 Overseers: 3,941, 1849 Enslaved population: 309,878, 1859 Enslaved population: 436,631, 1849 Overseers/100 enslaved workers: 0.75, 1859 Overseers/100 enslaved workers: 0.90. Row 5: North Carolina, 1849 Overseers: 989, 1859 Overseers: 1,782, 1849 Enslaved population: 288,548, 1859 Enslaved population: 331,059, 1849 Overseers/100 enslaved workers: 0.34, 1859 Overseers/100 enslaved workers: 0.54. Row 6: South Carolina, 1849 Overseers: 1,823, 1859 Overseers: 2,737, 1849 Enslaved population: 384,984, 1859 Enslaved population: 402,406, 1849 Overseers/100 enslaved workers: 0.47, 1859 Overseers/100 enslaved workers: 0.68. Row 7: Virginia, 1849 Overseers: 3,747, 1859 Overseers: 5,459, 1849 Enslaved population: 472,528, 1859 Enslaved population: 490,865, 1849 Overseers/100 enslaved workers: 0.79, 1859 Overseers/100 enslaved workers: 1.11. Row 8: Total, 1849 Overseers: 14,706, 1859 Overseers: 25,958, 1849 Enslaved population: 2,242,712, 1859 Enslaved population: 2,891,825, 1849 Overseers/100 enslaved workers: 0.61, 1859 Overseers/100 enslaved workers: 0.90.
Source: Seventh and Eighth Census of the United States.
To some degree, the ratios in Table 5 underestimate the degree of outside supervision of enslaved production. First, the figures overestimate the number of slaves per overseer in agricultural production, as not all slaves worked on the plantation or in the fields. Likewise, overseers sometimes lived in a separate dwelling rather than with the owners (Scarborough, Reference Scarborough1966: 36, 38).Footnote 44 If census field agents counted individuals in these dwellings as a separate household from those at the plantation house, census officials in DC would likely have missed them in estimating the total number of overseers.
In addition, these figures do not provide a complete picture of how much enslaved workers were monitored, as overseers were not the only managers of agricultural production. Often, an enslaved worker would be enlisted as a driver, adding another level of supervision on the plantation, but since enslaved workers would not be listed as overseers in the census, they are not represented in Table 5.
At the same time, the figures above potentially overstate the number of overseers on the plantation. As noted by Fogel and Engerman (Reference Fogel and Engerman1974b), the word “overseer” in antebellum America was a synonym for “supervisor.” Massachusetts had 450 overseers in 1849 and 1,098 in 1859, and New York had 322 in 1849 and 1,018 ten years later. These northern overseers most likely managed production in mechanized and non-mechanized factories – where direct supervision of work was more common. While the South had less industrial production, at least some of the overseers in columns one and two in Table 5 probably represent individuals supervising work beyond the plantation.
To get a better idea of how the use of overseers changed on plantations, we ran a regression on the number of overseers per state in both the North and South, controlling for the development of mechanized and non-mechanized factories and of plantation slavery production for 1850 and 1860:
 ${O_i} = \alpha + \mathop \sum \nolimits_j {\beta _j}{P_{ji}} + \mathop \sum \nolimits_j {\gamma _j}{I_{ji}} + {\varepsilon _i}$
 ${O_i}$
represents the number of overseers per state
 $i$
.
 ${P_{ji}}$
represents the development of the plantation system for which we use the number of enslaved people as a proxy.
 ${I_{ji}}$
represents the development of the factory system for which we use the number of manufacturing workers times the percent urban of the state as a proxy. Sokoloff (Reference Sokoloff1984) shows that non-mechanized factories had more substantially replaced artisanal production, which would not have had an overseer, in more urban areas where the development of the market was greater. Both the coefficients for the plantation and factory systems are allowed to change over time,
 $j$
. Indeed, the change in the coefficient
 $\beta $
from 1849 to 1859 is the main variable of importance in this regression analysis.
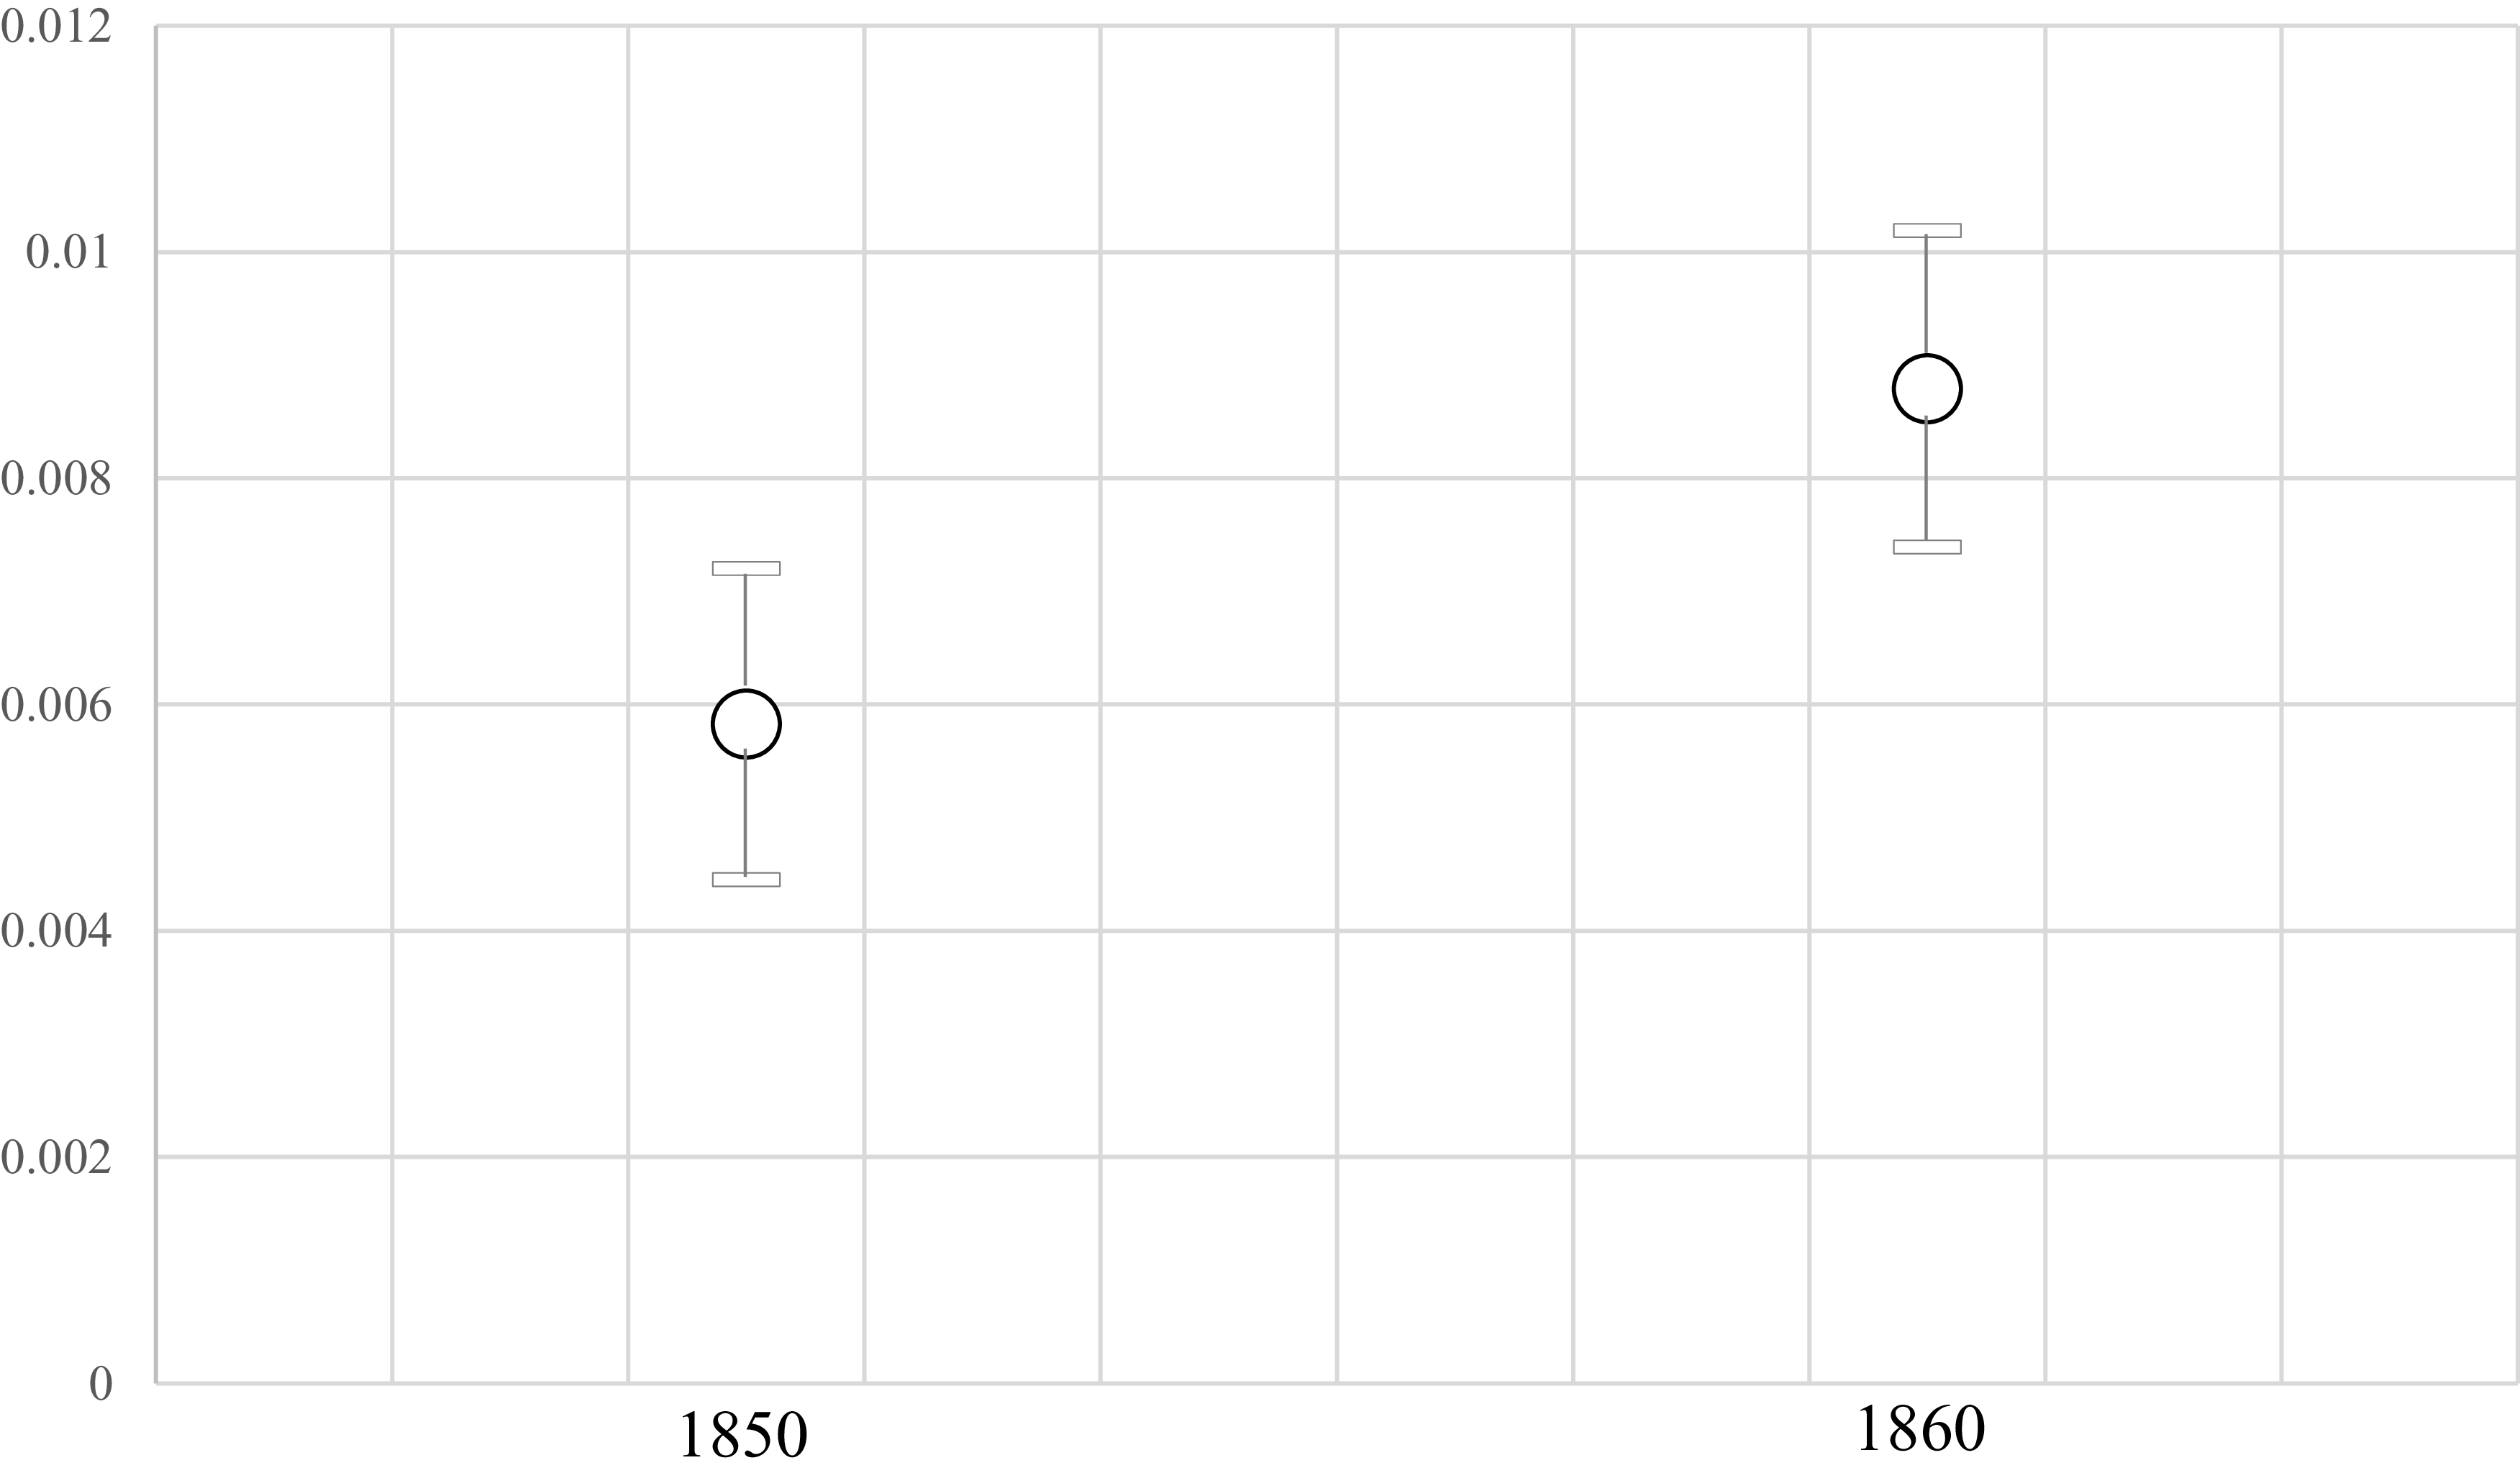
In Figure 1, we display the estimates for
 $\beta $
for 1849 and 1859. The bars above and below each estimate represent the 95 percent confidence intervals. Each of the estimates is statistically significant at the one percent level, and the two coefficients are statistically different. In terms of the latter point, the confidence intervals for the two coefficients do not overlap, and an F-test on the two coefficients shows their statistical difference is significant at the one percent level.
Thus, even after controlling for overseers potentially working as supervisors in mechanized and non-mechanized factory production rather than on plantations, the estimates displayed in Figure 1 show that there was a large and statistically significant increase in the use of overseers on plantations in the South in the decade before the Civil War. In 1850, there were around 0.58 overseers per one hundred enslaved workers. In 1860, the number of overseers per one hundred enslaved workers jumped to 0.88 – a 52 percent increase. These results are robust to different specifications of factory and plantation production. For example, if we use the number of factory workers and percent urban as separate independent variables, the results still hold. The same is true if we break up factory workers between male and female workers by state or use any combination of the above variables.
Estimation of overseers per enslaved worker.
Source: authors.

Consequently, we can confidently state that the use of outside overseers in plantation production increased significantly between 1849 and 1859, and since it increased faster than the enslaved population, there was an increase in monitoring of enslaved workers. The estimates for the degree of monitoring by outside overseers highlighted in Figure 1 are downwardly biased as they control for the factor that might lead them to be upwardly biased and not for those, discussed above, that would have the opposite effect.
Summary remarks
Given our examination of agricultural journals, plantation records, and census data, it seems that biological innovation in cotton seeds was not as large a factor in increasing the productivity of enslaved workers as has been claimed. Many of the new seeds were not actually new or any better than previous varieties. That said, it seems that biological innovation in cotton seeds played a role. For example, we find evidence that monitoring of enslaved production had a differential effect in the two regions. This could be a result of more frequent usage of new seed variants in this sub-region due to the soil being more suitable for their adoption. However, if this was the case, it would also mean that more intense monitoring of enslaved workers by outside overseers was central to capturing the increase in output per worker from the new seed varieties. This is a different explanation than that currently put forward by proponents of biological innovation as the source of increases in productivity of enslaved workers. It would mean that biological innovation, monitoring, and pushing enslaved workers went hand in hand, each enabling the other.
At the same time, there is considerable evidence that planters sought to push enslaved workers to labor more intensely and that they conveyed this message to those they hired to oversee production. After controlling for a range of important factors, we find that in the lower South increased supervision of enslaved workers by outside overseers increased output per enslaved worker substantially. Finally, we find that the degree to which slave owners hired overseers to monitor enslaved workers increased in the last decade before the Civil War. Consequently, the differential effect of monitoring in the upper and lower South could be a result of a more intense labor regime in the latter region. Indeed, we explored substantial qualitative evidence that supports this understanding.
To be sure, the productivity of enslaved workers was increasing over the entire antebellum period. In this article, we could only statistically analyze the final decade due to data on professions being less detailed or non-existent in earlier censuses. However, at the very least, our analysis shows that monitoring of enslaved workers should not be discarded as an explanation for increases in productivity prior to 1850. More research is needed for the earlier period to extend the argument to the years between about 1790 and 1865.
During the final decade of the antebellum period, we see that the rise of industrial capitalism in the United States and Europe intensified slavery in the southern United States – not just in terms of the number of enslaved workers it encompassed and slavery’s geographic expansion from the upper to the lower South – but also in terms of the intensity with which enslaved workers were forced to toil. In many ways, this increase in exploitation of enslaved workers in the cotton South paralleled the increase in intensity of work extracted from those pushed into the growing factory system in the North and across the Atlantic. Discipline and monitoring were central to both.Footnote 45 However, because of enslaved workers’ severely limited access to economic and political power, they faced much greater pressure and much steeper intensification of labor compared to their counterparts in the industrializing sectors of the northern economy and across the Atlantic.
Acknowledgments
We would like to thank the blind reviewers and editors at Social Science History, Peter Coclanis, Thomas Piketty, Pierre-Cyrille Hautcoeur, and the rest of the participants at the Paris School of Economics economic history seminar for their feedback on the article, Melissa Avilez Lopez for her work as a research assistant, and Andrew Lopez for his help tracking down data.