Introduction
A growing number of studies have demonstrated how cognitive reserve can influence the rate of cognitive decline. Individuals with higher cognitive reserve, i.e. higher educational and occupational attainment, higher levels of intelligence, and cognitive lifestyles, have consistently shown resilience to various brain pathologies (Hall et al., Reference Hall, Derby, LeValley, Katz, Verghese and Lipton2007; Garibotto et al., Reference Garibotto, Borroni, Sorbi, Cappa, Padovani and Perani2012; Amieva et al., Reference Amieva2014). In AD, higher cognitive reserve has been associated with higher cognitive and functional levels, regardless of disease severity (Liu et al., Reference Liu2012; Osone et al., Reference Osone, Arai, Hakamada and Shimoda2014). A similar concept is brain reserve.
Brain reserve is a term used to describe the resilience of the brain, the factors that enable it to maintain functional integrity under increasing damage (Stern, Reference Stern2009). Premorbid brain volume, which is often represented by intracranial brain volume (ICV) or head circumference, is considered an effective measure of reserve (Skoog et al., Reference Skoog, Olesen, Blennow, Palmertz, Johnson and Bigler2012; Guo et al., Reference Guo, Alexopoulos, Wagenpfeil, Kurz and Perneczky2013).
Evidence concerning the relationship between ICV, as a proxy of premorbid brain volume, and AD has been mixed, although some recent reports have shown that large ICV may act as a protective factor against the development of AD. However, confirmatory longitudinal studies have been scarce, as well as reports on how ICV may influence the trajectory of disease progression. In two older cross-sectional studies investigating head circumference, one found an association between smaller ICV and AD, although one did not (Schofield et al., Reference Schofield, Logroscino, Andrews, Albert and Stern1997; Mielke et al., Reference Mielke, Vemuri and Rocca2014). Among more recent studies using the same measurement, two studies reported that smaller head circumference was associated with worse cognition (Perneczky et al., Reference Perneczky2010; Reference Perneczky, Alexopoulos, Wagenpfeil, Bickel and Kurz2012). There have also been several studies using volumetric measurements from magnetic resonance imaging (MRI). Two cross-sectional studies reported a direct association between small ICV and AD (Wolf et al., Reference Wolf, Julin, Gertz, Winblad and Wahlund2004; Skoog et al., Reference Skoog, Olesen, Blennow, Palmertz, Johnson and Bigler2012), while another two reported only indirect effects (Jenkins et al., Reference Jenkins, Fox, Rossor, Harvey and Rossor2000; Guo et al., Reference Guo, Alexopoulos, Wagenpfeil, Kurz and Perneczky2013). Still other studies reported that they were unable to observe any relationship between ICV and AD (Edland et al., Reference Edland2002; Tate et al., Reference Tate2011). Of these studies, only one was based on longitudinal follow-up data (Guo et al., Reference Guo, Alexopoulos, Wagenpfeil, Kurz and Perneczky2013). Longitudinal studies examining this matter would provide a clue as to how brain reserve influences disease progression. This knowledge could also aid clinicians when assessing the prognosis of individual patients, perhaps more so when evaluating those with MCI.
The interaction of ICV with gender and APOE4 genotype is another topic that could aid clinicians, but has not received much scrutiny. Female gender and the presence of an APOE4 allele are well known major risk factors for AD (Farrer et al., Reference Farrer1997; Mielke et al., Reference Mielke, Vemuri and Rocca2014). Knowing how they interact with ICV could further aid clinicians during prognostic assessments.
Through this study, we aimed to determine the association between ICV and progression to AD in subjects with MCI, and differences in this association according to gender and APOE4 genotype. Rates of cognitive decline and brain atrophy around the time of conversion to AD were further investigated.
Methods
Data used for this study were obtained from the Alzheimer's Disease Neuroimaging Initiative (ADNI) database (adni.loni.usc.edu) in Aug, 2014 (Weiner et al., Reference Weiner2015b). The ADNI was launched in 2003 by the National Institute on Aging (NIA), the National Institute of Biomedical Imaging and Bioengineering (NIBIB), the Food and Drug Administration (FDA), private pharmaceutical companies, and non-profit organizations, as a $60 million, five-year public-private partnership. The primary goal of ADNI has been to test whether serial MRI, positron emission tomography (PET), other biological markers, and clinical and neuropsychological assessment can be combined to measure the progression of MCI and early AD. Determination of sensitive and specific markers of very early AD progression is intended to aid researchers and clinicians to develop new treatments and monitor their effectiveness, as well as lessen the time and cost of clinical trials.
The Principal Investigator of this initiative is Michael W. Weiner, MD, VA Medical Center and University of California, San Francisco. ADNI is the result of efforts of many co-investigators from a broad range of academic institutions and private corporations, and subjects have been recruited from over 50 sites across the USA and Canada. The initial goal of ADNI was to recruit 800 subjects, but ADNI has been followed by ADNI-GO and ADNI-2. To date these three protocols have recruited over 1,500 adults, with ages of 55–90 years, to participate in the research, consisting of cognitively normal (CN) older individuals, people with early or late MCI, and people with early AD. For up-to-date information, see www.adni-info.org (Weiner et al., Reference Weiner2015b).
Participants
The inclusion and exclusion criteria for ADNI subjects have been published elsewhere (Weiner et al., Reference Weiner2015a; Reference Weiner2015b). In brief, subjects between 55 and 90 years of age, with or without memory complaints, were rated using the Wechsler Memory Scale (Revised)-Logical Memory III subscale and various other instruments, diagnosed based on the National Institute of Neurological and Communicative Disorders and Stroke and the Alzheimer's Disease and Related Disorders Association (NINCDS-ADRDA) criteria, and categorized into one of three groups: CN, MCI, and AD. Participants with other significant neurological or psychiatric diseases were excluded from the study. Detailed assessments were performed at baseline, and annually or biannually thereafter. MRI and neuropsychological tests were performed at each visit, and PET and cerebrospinal fluid (CSF) collection was done biennially.
Subjects with a baseline diagnosis of MCI, and at least two visits (N = 838) were selected. Those who subsequently progressed to AD were defined as “converters.” (N = 202) Among the converters, those who (1) converted back to MCI or CN levels (N = 64), or (2) had not been observed within a year before conversion (N = 137) were excluded, yielding a total of 637 subjects.
MRI and biomarker data acquisition and analysis
Clinical and neuropsychological assessments, MRI measurements from the University of San Francisco, and CSF biomarker analysis results from the University of Pennsylvania were obtained from the ADNI database and used in analysis. The specifics of each lab's analysis protocols have been published (Schuff et al., Reference Schuff2009; Jack et al., Reference Jack2015; Kang et al., Reference Kang2015).
Among various MRI measurements, intracranial, whole brain, medial temporal lobe, and hippocampal volumes were used for the analysis. The T1 image processing protocols concerning these data has been published elsewhere (Schuff et al., Reference Schuff2009). In brief, cortical reconstruction and volumetric segmentation was performed using the FreeSurfer image analysis suite. Images went through the basic correction processes, including motion correction, averaging, removal of non-brain tissue, a Talairach transformation, subcortical white matter and deep gray matter volumetric segmentation, intensity normalization, gray matter and white matter boundary tessellation, topology correction, and surface deformation. Detailed information about this process can be freely found online (http://surfer.nmr.mgh.harvard.edu/). As data were collected longitudinally, a within-subject template space and an average image, unbiased toward the chronological scan order (Reuter and Fischl, Reference Reuter and Fischl2011), were created using robust inverse consistent registration (Reuter et al., Reference Reuter, Rosas and Fischl2010). Information from each subject's template was used to initialize the longitudinal image processing to increase reliability and statistical power (Hartig et al., Reference Hartig2014). The size of voxels used in calculation was 1 mm3. Estimated total ICV calculated by Freesurfer, which is basically the sum of gray matter, white matter, and CSF measurements, was used as an estimate for ICV (Graves et al., Reference Graves, Mortimer, Larson, Wenzlow, Bowen and McCormick1996). Intracranial and whole brain volumes were converted to liters, while volumes of the medial temporal lobe and the hippocampus were converted to milliliters (ml). Since ICV does not change substantially with age, measurements of each subject were averaged into a single mean value.
Among CSF biomarker data, baseline Aß1–42 and t-tau concentrations from the University of Pennsylvania were used in analysis. The protocols of each lab have been published (Shaw and Trojanowski, Reference Shaw and Trojanowski2010; Guzman et al., Reference Guzman2013).
Neuropsychological and functional assessments
Alzheimer's Disease Assessment Scale-Cognitive subscale (ADAS-Cog) scores were used as an indicator of cognitive function. The ADAS-Cog is a widely-used assessment tool specially designed for AD (Rosen et al., Reference Rosen, Mohs and Davis1984). It includes 11 subtests, with a combined score ranging from 0 to 70. Higher scores indicate worse cognitive function.
The Functional Activities Questionnaire (FAQ) was used as an indicator of function. The FAQ evaluates everyday activities such as preparing meals or handling financial affairs, and has 10 items. Scores range from 0 to 30, with lower scores representing better functional ability (Pfeffer et al., Reference Pfeffer, Kurosaki, Harrah, Chance and Filos1982).
Determination of a comparable time point in disease progression
For an accurate comparison of progression rates between each individual, we first needed to determine a comparable point in time, at which all individuals would be at a similar stage in disease progression. For such a reference point, we decided to use the time of conversion. All converters were selected, and measurements from one year and two years before conversion, to one year and two years after conversion, were plotted. The time of conversion also had the additional benefit of being a significant milestone in the progression of the disease.
Statistical analysis
Analysis was carried out in two stages, using ICV as a proxy of premorbid brain volume, and ultimately, brain reserve. In the first stage, the independent contribution of ICV to the risk of progression to AD was determined. ICV was entered as a continuous variable in this stage. Premorbid brain size and ICV have been used as un-modifiable factors in previous studies (Wolf et al., Reference Wolf, Kruggel, Hensel, Wahlund, Arendt and Gertz2003), and may be considered similar to factors such as age, gender, years of education, height, smoking history, family history of dementia, and APOE4 genotype. Hence, these factors were included together in various cox proportional hazard models. We initially considered including measurements of current disease state, such as CSF Aß1–42 and t-tau concentrations, or neuropsychological measurements. However, they were not included in the final models, as they could be considered the results of the influence of the various un-modifiable factors mentioned earlier, and their inclusion could confound the results. Separate models were constructed for ICV and each measurement of baseline brain volume. ICV was included to control for premorbid brain size when appropriate. Censoring was used for subjects who did not convert to dementia by the time of their last visit. To reduce variability and inaccuracy, subjects who had not been observed within one year before conversion were excluded. Kaplan–Meier curves were plotted for illustrative purposes.
The second stage was focused on differences in trajectory. We aimed to demonstrate how the rate of cognitive decline and brain atrophy differs according to ICV at a specific fiducial point, which in our study was the time of conversion, under the assumption that all individuals would be at a similar disease stage at that time. All converters were selected and grouped by either gender or APOE4 status. Afterwards, they were further divided into the large ICV group and small ICV group, using the median ICV value as a cut-off point. ICV was used as a categorical value in this stage. ADAS-Cog scores and brain measurements from visits one year and two years before conversion, and one year and two years after conversion were plotted, and the rates of cognitive decline and brain atrophy around the time of conversion were compared using linear mixed-effect models. This analysis method was used as not all subjects had full data sets for all five time points. ADAS-Cog scores were log-transformed prior to analysis.
All analyses were performed using Predictive Analytics Software (PASW) version 21.0 and R statistics version 3.1.2. Two-sided tests were used, and p < 0.05 was considered significant.
Results
Baseline demographic, clinical, and MRI morphometric characteristics
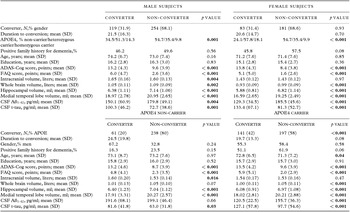
Baseline demographic, clinical, MRI morphometric, and biomarker characteristics of our study subjects are presented in Table 1. Surprisingly, male converters had significantly larger ICVs than non-converters, and this difference was not observed in females (males, t[195] = −2.89, p = 0.004; females, t[262] = 0.04, p = 0.97). Proportion of subjects who converted (χ2 [1] = 0.02, p = 0.93), and mean time to conversion (t[200] = −0.39, p = 0.70) did not differ between males and females. In both gender groups, converters had a higher proportion of subjects who were APOE4 heterozygous/homozygous carriers (males, χ2 [2] = 13.34, p = 0.001; females, χ2 [2] = 21.60, p < 0.001), higher ADAS-Cog scores (males, t[371] = −8.06, p < 0.001; females, t[262] = −10.09, p < 0.001), smaller brain volumes (males, whole brain, t[206] = 3.20, p = 0.002; hippocampus, t[371] = 6.35, p < 0.001; medial temporal lobe, t[371] = 6.62, p < 0.001; females, whole brain, t[262] = 5.26, p < 0.001; hippocampus, t[218] = 7.64, p < 0.001; medial temporal lobe, t[262] = 7.90, p < 0.001), higher CSF Aß1–42 (males, t[145] = 2.96, p = 0.004; females, t[49] = 6.49, p < 0.001) and lower t-tau (males, t[144] = −3.55, p = 0.001; females, t[103] = −3.93, p < 0.001) concentrations.
Baseline demographic, clinical, magnetic resonance imaging morphometric, and biomarker characteristics between converters and non-converters in subjects with mild cognitive impairment, grouped according to gender and APOE status

SD, standard deviation; APOE, Apolipoprotein E; ADAS-Cog, Alzheimer's Disease Assessment Scale-Cognitive subscale; FAQ, functional activities questionnaire; CSF Aß1–42, Cerebrospinal Fluid Amyloid-beta 1–42 concentration; CSF t-tau, Cerebrospinal Fluid total tau protein concentration.
Significant findings (p < 0.05) are indicated in bold.
When subjects were grouped according to APOE4 status, mean ICV was again significantly larger in converters than in non-converters, but only in the APOE4 non-carrier group and not in the APOE4 carrier group (non-carrier, t[77] = −2.47, p = 0.016; carrier, t[336] = −0.72, p = 0.47). Other results were similar to those of the previous analyses. APOE4 carriers had a higher proportion of converters (χ2 [1] = 33.29, p < 0.001), although the mean time to conversion did not differ among the two groups (t[84] = 1.75, p = 0.08). Hippocampal (non-carrier, t[297] = 3.89, p < 0.001; carrier, t[327] = 8.16, p < 0.001) and medial temporal lobe volumes were smaller (non-carrier, t[80] = 5.17, p < 0.001; carrier, t[336] = 6.95, p < 0.001), ADAS-Cog scores were higher (non-carrier, t[83] = −7.04, p < 0.001; carrier, t[336] = −8.89, p < 0.001), and CSF t-tau concentrations (non-carrier, t[134] = −2.21, p = 0.029; carrier, t[113] = −2.71, p = 0.008) were lower in converters, regardless of APOE status.
Large intracranial volume as a predictive factor for progression from mild cognitive impairment to Alzheimer's disease
We then determined whether the association we observed between large ICV and diagnostic progression was independent of other factors. The results from Cox proportional hazard models and the Kaplan–Meier curves are presented in Table 2 and Supplementary Figure S1 (available as supplementary material attached to the electronic version of this paper at www.journals.cambridge.org/jid_IPG). In males, a larger ICV was predictive of conversion from MCI to AD (372 subjects, HR: 4.24, 95% CI: 1.17–15.40, p = 0.028). Smaller hippocampal (HR: 0.55, 95% CI: 0.46–0.66, p < 0.001) and medial temporal lobe volume (HR: 0.74, 95% CI: 0.69–0.80, p < 0.001) at baseline also increased the risk of conversion.
Adjusted hazard ratios for conversion from mild cognitive impairment to Alzheimer's disease according to intracranial volume and specific brain volumes

CI, confidence interval.
Models in the two left columns (males and females) were adjusted for age, years of education, height, history of smoking, family history of dementia, and apolipoprotein E4 (APOE4) genotype. Models in the two right columns (APOE4 non-carriers and carriers) were adjusted for age, gender, years of education, height, smoking history, and family history of dementia. Models including hippocampal and medial temporal lobe volumes were further controlled for intracranial volume.
Intracranial volume was measured in liters, and hippocampal and medial temporal lobe volumes were measured in milliliters (ml).
Significant findings (p < 0.05) are indicated in bold.
Similar findings were observed in APOE4 non-carriers. A larger ICV (297 subjects, HR: 10.00, 95% CI: 1.34–74.53, p = 0.025), a smaller baseline hippocampal volume (HR: 0.51, 95% CI: 0.40–0.66, p < 0.001), and medial temporal lobe volume (HR: 0.68, 95% CI: 0.61–0.75, p < 0.001) significantly increased the risk of conversion. However, none of these factors were significant in females or APOE4 carriers. These results show that large ICV is an independent risk factor for progression from MCI to AD, but only in males and APOE4 non-carriers.
The trajectories of cognitive decline and brain atrophy around the time of conversion
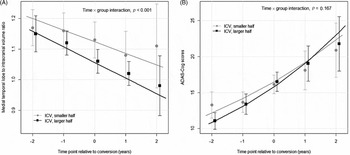
To explain these results, we focused on differences in trajectory. We hypothesized that changes in the rate of disease progression differ according to ICV. Among brain measurements, medial temporal lobe volume to ICV ratio was used, as it showed comparatively less variation. The results are presented in Figure 1 and Supplementary Figure S2 (available as supplementary material attached to the electronic version of this paper at www.journals.cambridge.org/jid_IPG). In males, two trends were notable. First, the rate of brain atrophy was faster in the large ICV group (estimate −0.039, standard error [SE] 0.002, p < 0.001) than in the small ICV group (estimate −0.027, SE 0.002, p < 0.001), and this difference was statistically significant (time × group interaction, p < 0.001). In addition, by the time of conversion, medial temporal lobe atrophy had progressed comparatively further. Second, cognitive decline also seemed to deteriorate more rapidly in the large ICV group (large ICV, estimate 0.168, SE 0.014, p < 0.001, vs. small ICV, estimate 0.139, SE 0.015, p < 0.001). However, this difference was not statistically significant (time x group interaction, p = 0.167). These findings suggest that, in subjects with larger premorbid brains, the rate of brain atrophy may accelerate during the MCI stage. Significant between-group differences in the rate of decline were not observed in females, or in APOE4 carriers and non-carriers. Also, the overall rate of decline was faster in females than in males, and the main difference seemed to be in subjects with a smaller ICV.
Rates of cognitive decline and brain atrophy in male converters around the time of conversion. The rate of brain atrophy, measured by medial temporal lobe volume and intracranial volume ratio, declined faster in males with large intracranial volume, compared to those with small intracranial volume. (A) The difference in rate was statistically significant (time × group interaction, p < 0.001). The rate of cognitive decline, measured by Alzheimer's disease assessment scale – cognitive subscale (ADAS-Cog) scores was also different between the two groups, but this was not statistically significant. (B) (time × group interaction, p = 0.167) Circles, squares and error bars are mean values and 95% confidence intervals. Lines are results of linear mixed-effects model analysis.

Discussion
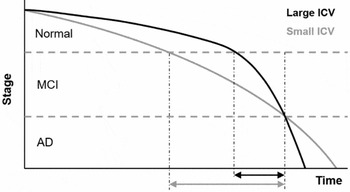
Our results show that in males and APOE4 non-carriers in the MCI stage, large ICV may increase the risk of conversion to AD, contrary to some previous reports (Tate et al., Reference Tate2011; Perneczky et al., Reference Perneczky, Alexopoulos, Wagenpfeil, Bickel and Kurz2012; Guo et al., Reference Guo, Alexopoulos, Wagenpfeil, Kurz and Perneczky2013). The cognitive reserve hypothesis postulates that higher levels of cognitive reserve may delay the onset of cognitive impairment in subjects with AD pathology, but once symptoms are manifest, they may progress more rapidly (Stern, Reference Stern2009). Based on our findings, we report that this may be true in regard to ICV. The rate of brain atrophy was significantly faster in converters with large ICV than in those with small ICV around the time of conversion, and the rate of cognitive decline was similar between the two groups. When the existing evidence regarding the protective effect of large ICV and our results are considered, a plausible explanation is as follows; although the progression of brain atrophy and subsequent cognitive decline is initially more slower in subjects with a large ICV than in those with a small ICV, it accelerates more rapidly in the former group during the MCI stage, so that it eventually “catches up” with that of the latter group around the time of conversion. Our proposed model is presented in Figure 2. This model explains why a large ICV may be a protective factor in the earlier stages, but may act as a risk factor for progression to AD at a later time. Quickened disease progression may shorten the duration of the MCI stage in subjects with a large ICV. Therefore, within a group of MCI subjects, it would seem as if they progress to AD more rapidly than their counterparts.
A theoretical model of disease progression in Alzheimer's disease. Our model explains why large intracranial volume may be a risk factor for diagnostic progression in the mild cognitive impairment stage. Although rates of decline accelerate in both groups, the increase is more significant in the group with large intracranial volume. This shortens the duration of time spent in this stage (black arrows vs. gray arrows), and thus increases the chances of a conversion being “observed.”

A notable aspect of our results is that the effects of ICV were observable in men and not women. Gender differences in cognitive and brain reserve have been examined in detail, and reports concerning education, occupation, genes, and hormones have showed disadvantages in women compared to men (Jenkins et al., Reference Jenkins, Fox, Rossor, Harvey and Rossor2000). In older adults, women are usually more likely to have had lower levels of education and simpler jobs than men, leading to lower levels of cognitive reserve (Jenkins et al., Reference Jenkins, Fox, Rossor, Harvey and Rossor2000). Also, large-scale studies have shown that APOE4 genotypes have a more pronounced effect in women (Skoog et al., Reference Skoog, Olesen, Blennow, Palmertz, Johnson and Bigler2012). Evidence on the effects of hormonal changes is less consistent; however, in general, the loss of estrogen may be considered to be deleterious (Jenkins et al., Reference Jenkins, Fox, Rossor, Harvey and Rossor2000). The combined effect of these factors may have been enough to override the influence of ICV. Two aspects of our results support this explanation; one, baseline ADAS-Cog scores were similar between genders, although brain atrophy (measured as percentage of ICV) was more progressed in males compared to females suggesting lower levels of cognitive reserve in females (Supplementary Table S1, available as supplementary material attached to the electronic version of this paper at www.journals.cambridge.org/jid_IPG). Two, the overall rate of decline was faster in females compared to males, which may reflect the deleterious effect of the various factors explained above.
The effects of ICV were also observed only in APOE4 non-carriers and not in carriers. A possible explanation is that the presence of an APOE4 allele was sufficient to override the effect of ICV. The linear mixed-effects model was unable to find a significant difference; thus further studies will be needed to verify this.
As ICV measurements included gray matter, white matter, and CSF volumes, the question remains as to how each volume contributed to the effect of ICV we observed. We believe this is an interesting topic for future studies.
A recent study that was also based on ADNI data reported that a larger ICV may attenuate the impact of AD pathology (Guo et al., Reference Guo, Alexopoulos, Wagenpfeil, Kurz and Perneczky2013). The results were somewhat different from ours, and we think this may be due to two factors. The first is differences in outcome variables. In the previous study, longitudinal clinical and volumetric measures were used as outcome variables, which may reflect disease progression per se. In our study, diagnostic conversion was used, as we felt it showed the current status of a subject more comprehensively, and can be more meaningful in actual clinical situations. Although neuropsychiatric and MRI assessments are an important part of any diagnostic work-up, the diagnosis itself is always a clinical one. The second is a difference in the study population. Our main results were centered on males and APOE4 non-carriers with MCI, and the secondary results were focused on subjects who converted from MCI to AD. In the previous study, measurements from normal controls and subjects with MCI and AD were all included in the analysis. Thus, the subjects in our study may have been more homogenous with respect to time (a high proportion of subjects were within a few years of converting to AD). Also, our study was based on a larger study group, which may have enabled us to discover significant bivariate interactions that included ICV. In the aforementioned paper, all bivariate interactions were not significant. These two factors may have enabled us to discern more clearly how ICV influences the overall cognitive and functional state of an individual within a specific time frame.
This study has several limitations. First, all patients were recruited from specialized memory clinics. Thus, these findings may not be applicable to the general population. Second, many subjects had missing data. This may have affected our results, but as a sizeable number of subjects were analyzed, the influence of this limitation was probably not significant. Third, the interval between visits was six months or one year. This is somewhat longer than some studies, and may have had some effect. However, considering the chronic course of AD, we think the effect probably has been minor. Fourth, in the last analysis, while trajectories of medial temporal lobe atrophy to ICV ratios were significantly different, the ADAS-Cog score trajectories were not. This indicates that the utility of ICV may be limited in relating to cognition or function. Fifth, the cut-off point of ICV was arbitrary. We were unable to find a satisfactory reference; further studies examining this will be needed.
In conclusion, we discovered that the effect of large ICV is not always protective, and that it may even be disadvantageous in males and APOE4 non-carriers with MCI. Thus, when treating such patients, clinicians should warn them of the risk of a faster decline, and observe and evaluate them more frequently.
Conflicts of interest
None.
Description of author's roles
H. AN designed the study, analyzed the data and wrote the paper. S. J. Son assisted in study design, statistical analysis, and with writing the paper. S. Cho assisted in data collection and statistical analysis pertaining to MRI measurements. E. Y. Cho assisted in study design and statistical analysis. B. Choi assisted in data collection and with writing the paper. S. Y. Kim supervised study design, data collection, statistical analysis and writing the paper.
Acknowledgments
Data used in the preparation of this article were obtained from the ADNI database (adni.loni.usc.edu). As such, the investigators within the ADNI contributed to the design and implementation of ADNI and/or provided data, but did not participate in the analysis or writing of this report. A complete listing of ADNI investigators can be found at: http://adni.loni.usc.edu/wp-content/uploads/how_to_apply/ADNI_Acknowledgement_List.pdf. Data collection and sharing for this project was funded by the ADNI (National Institutes of Health Grant U01 AG024904) and DOD ADNI (Department of Defense award number W81XWH-12-2-0012). ADNI is funded by the NIA and the NIBIB, and through generous contributions from the following: Alzheimer's Association; Alzheimer's Drug Discovery Foundation; Araclon Biotech; BioClinica, Inc.; Biogen Idec Inc.; Bristol-Myers Squibb Company; Eisai Inc.; Elan Pharmaceuticals, Inc.; Eli Lilly and Company; EuroImmun; F. Hoffmann-La Roche Ltd and its affiliated company Genentech, Inc.; Fujirebio; GE Healthcare; IXICO Ltd.; Janssen Alzheimer Immunotherapy Research & Development, LLC.; Johnson & Johnson Pharmaceutical Research & Development LLC.; Medpace, Inc.; Merck & Co., Inc.; Meso Scale Diagnostics, LLC.; NeuroRx Research; Neurotrack Technologies; Novartis Pharmaceuticals Corporation; Pfizer Inc.; Piramal Imaging; Servier; Synarc Inc.; and Takeda Pharmaceutical Company. The Canadian Institutes of Health Research is providing funds to support ADNI clinical sites in Canada. Private sector contributions are facilitated by the Foundation for the National Institutes of Health (www.fnih.org). The grantee organization is the Northern California Institute for Research and Education, and the study is coordinated by the Alzheimer's Disease Cooperative Study at the University of California, San Diego. ADNI data are disseminated by the Laboratory for Neuro Imaging at the University of Southern California.
This study was supported by the Korean Alzheimer's Disease Neuroimaging Initiative (K-ADNI), which is funded by a grant of the Korea Healthcare technology R&D Project, Ministry of Health and Welfare, Republic of Korea (HI12C0713).
Supplementary Material
To view supplementary material for this paper, please visit http://dx.doi.org/10.1017/S104161021500229X.