
I. INTRODUCTION
Cu(In,Ga)Se2-(CIGS) or Cu(In,Ga)(S,Se)2-(CIGSS)-based solar cell devices achieve laboratory scale conversion efficiencies up to 22.6% Reference Jackson, Wuerz, Hariskos, Lotter, Witte and Powalla1 for small-area cells and 19.2% 2 for 30 × 30 cm2 submodules. On the industrial scale, commercial full-size modules reach efficiencies up to 17% 3 based on the total area of around 1 m2.
Several methods have been developed for deposition of the chalcopyrite thin-film absorber layer. However, two approaches have become established for commercial manufacturing: the simultaneous evaporation of the elements (co-evaporation process) and the selenization or sulfoselenization of metallic precursor layers in a sequential two-step process (sequential process). The historical development of the CIGS technology and comparisons of different technologies and material properties is described in detail in different review articles Reference Singh and Patra4–Reference Niki, Contreras, Repins, Powalla, Kushiya, Ishizuka and Matsubara6 and books. Reference Shafarman, Siebentritt, Stolt, Luque and Hegedus7–Reference Scheeer and Schock9
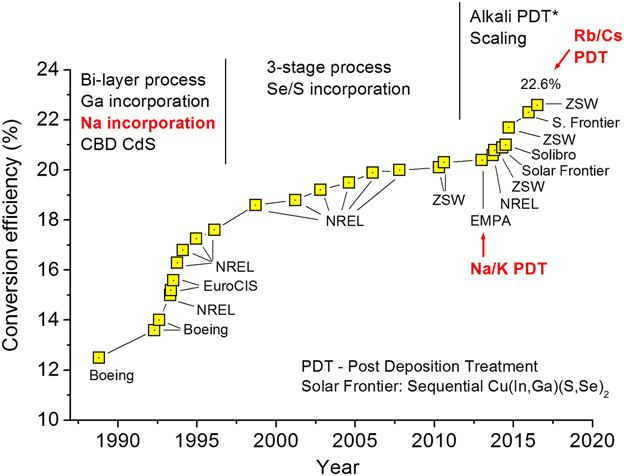
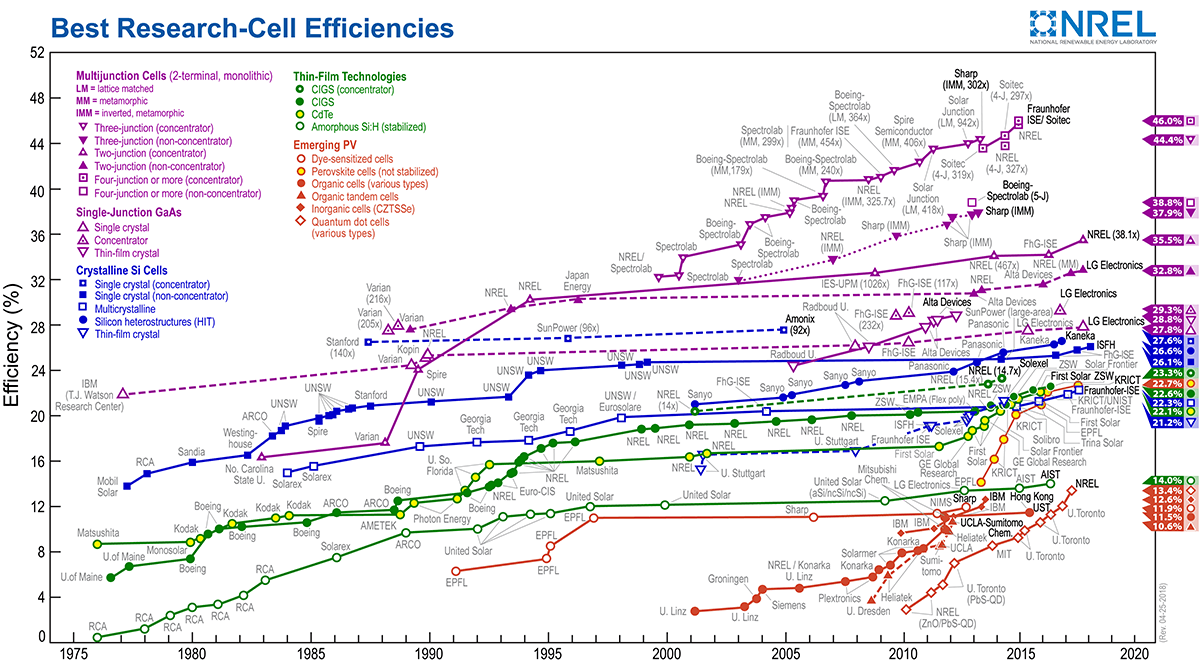
The efficiency evolution of small-area devices since 1989 as extracted from the NREL’s efficiency chart 10 is presented in Fig. 1. The progress made in the last three decades can be roughly divided into three periods.
Efficiency evolution of Cu(In,Ga)Se2- or Cu(In,Ga)(S,Se)2-based solar cells correlated with different development stages.
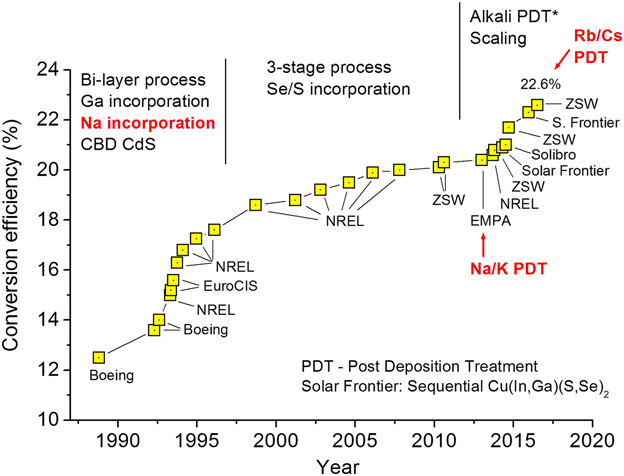
In the first half of the 1990s, the developments in the co-evaporation process were dominated by a bilayer growth process Reference Mickelsen and Chen11,Reference Klenk, Walter, Schock and Cahen12 and the incorporation of Ga Reference Chen, Stewart, Stanbery, Devaney and Mickelsen13 for increasing the energy band gap for better adjustment to the solar spectrum. At the same time, the sequential process was generally based on the ARCO Solar process Reference Kapur, Choudary and Chu14,Reference Mitchell, Eberspacher, Ermer and Pier15 by selenization of metallic precursors, which leads to an accumulation of Ga at the back side of the absorber layer and thus reduces the energy band gap at the absorber surface region. Reference Jensen, Tarrant, Ermer and Pollock16 Both technologies discovered that the incorporation of Na as a dopant from the substrate by using soda-lime glass is beneficial. Reference Mitchell, Eberspacher, Ermer, Pauls and Pier17,Reference Hedström, Ohlsén, Bodegård, Kylner, Stolt, Hariskos, Ruckh and Schock18 A thin chemical-bath-deposited CdS Reference Potter19,Reference Kessler, Velthaus, Ruckh, Laichinger, Schock, Lincot, Ortega, Vedel, Das and Singh20 or CdZnS Reference Deveney, Chen, Stewart and Gilette21,Reference Ahrenkiel, Kazmerski, Matson, Osterwald, Massopust, Mickelsen and Chen22 buffer layer in combination with a mainly sputtered ZnO/ZnO:Al transparent conducting oxide bilayer replaced the previously used evaporated thick indium-doped CdS Reference Mickelsen and Chen11 or CdZnS Reference Mickelsen and Chen23 window layer. The CIGS bilayer process itself was realized by varying the fluxes of the elements so that the layer grows Cu-rich at the beginning and is inverted to a slightly Cu-poor composition at the end of the process, i.e., the preparation of the absorber layer was performed by approaching the photovoltaic active α-phase [near stoichiometric Cu-poor chalcopyrite Cu(In,Ga)Se2] from the Cu-rich side as dictated by the pseudo-binary or -ternary phase diagram. Reference Goedecke, Haalboom and Ernst24–Reference Stanbery26
In the next development stage starting in the late 1990s, the bilayer process was gradually replaced by the so-called three-stage process, Reference Contreras, Tuttle, Gabor, Tennant, Ramanathan, Asher, Franz, Keane, Wang, Scofield and Noufi27,Reference Repins, Contreras, Egaas, DeHart, Scharf, Perkins, To and Noufi28 cracking the efficiency mark of 20% Reference Jackson, Hariskos, Lotter, Paetel, Wuerz, Menner, Wischmann and Powalla29 for the first time in 2010. The three-stage process is characterized by a Cu-poor/Cu-rich/Cu-poor growth sequence during deposition, initially approaching the photovoltaic relevant α-phase material from the Cu-poor side according to the phase diagram. In parallel, the sequential two-step process was further optimized by the incorporation of sulfur, forming CIGSS to increase the surface band gap due to the Ga accumulation at the back side. Reference Tanaka, Akema, Morishita, Okumura, Kushiya, McNelis, Palz, Ossenbrink and Helm30,Reference Palm, Probst and Karg31 Both approaches now have a double-graded band gap structure with increased band gap toward the front and back contacts.
In the last 5 years, the solar cell efficiency has again been significantly improved by means of a postdeposition treatment (PDT) after the CIGS deposition. The PDT process is now most commonly realized by the evaporation of alkali fluorides in selenium atmosphere on the CIGS surface. The method was first developed in the early 2000s Reference Rudmann and Tiwari32 but attracted renewed attention after the realization of a 20.4%-efficient cell on a flexible polyimide substrate at a low CIGS deposition temperature by applying a potassium/sodium PDT. Reference Chirilă, Reinhard, Pianezzi, Bloesch, Uhl, Fella, Kranz, Keller, Gretener, Hagendorfer, Jaeger, Erni, Nishiwaki, Buecheler and Tiwari33 The potassium PDT process was also successfully tested on high-temperature CIGS thin-film layers in different laboratories, promoting the cell efficiency up to 21%. Reference Jackson, Hariskos, Wuerz, Wischmann and Powalla34,Reference Lundberg, Wallin, Gusak, Södergren, Chen, Lotfi, Chalvet, Malm, Kaihovirta, Mende, Jaschke, Kratzert, Joel, Skupinski, Lindberg, Jarmar, Lundberg, Mathiasson and Stolt35 In a further development, the heavier alkali metals rubidium Rb and cesium Cs were also implemented, and the highest CIGS cell efficiency could be further improved, first to 21.7% Reference Jackson, Hariskos, Wuerz, Kiowski, Bauer, Friedlmeier and Powalla36 and later to 22.6%. Reference Jackson, Wuerz, Hariskos, Lotter, Witte and Powalla1 The potassium PDT was proven to also be effective on S-containing sequentially deposited CIGSS layers, leading to certified conversion efficiencies up to 22.3%. Reference Kamada, Yagioka, Adachi, Handa, Tai, Kato and Sugimoto37,Reference Kato38
In all development stages, Na played an important role for improving the CIGS or CIGSS material properties and thereby increasing the power conversion efficiency of small-area cells and commercial full-size modules. Different methods have been developed for the incorporation of sodium. The various incorporation strategies, detection methods, and the different interpretations of the positive electronic and structural effects of sodium as reported in the literature were summarized and discussed in a recent review article by Salomé et al. Reference Salomé, Rodriguez-Alvarez and Sadewasser39 The concentration and distribution of sodium in the chalcopyrite absorber layer is influenced by the type of substrate, the Mo back contact, the deposition temperature, and the composition of the absorber layer during the deposition process, i.e., the Cu/(Ga + In) and Ga/(Ga + In) ratios. In addition, a combination of barrier layers and alkali precursor layers can be used for substrate-independent manipulation of the presence of alkali elements during CIGS growth. It has been repeatedly demonstrated that the distribution of Na is not homogeneous; it preferably segregates at grain boundaries and exhibits a much lower concentration inside the grains. Reference Cojocaru-Mirédin, Choi, Wuerz and Raabe40,Reference Cadel, Barreau, Kessler and Pareige41
The applicability of the heavier alkali homologues for further optimization of the absorber quality was first properly recognized only after implementation of the PDT method. New findings indicate a similar distribution behavior also for the higher homologues K, Rb, and Cs. Reference Vilalta-Clemente, Castro, Raghuwanshi, Duguay, Cadel, Pareige, Jackson, Hariskos, Wuerz and Witte42
In this contribution, we discuss thermodynamic limitations for alkali metals in CIGS and show how they can influence secondary phase formation. We suggest the concept of immiscibility of phases as a tool for interpreting alkali segregation at grain boundaries, formation of clusters in CIGS grains, sporadic formation of microstructures in the CIGS layer (hotspots, nodules), and formation of secondary phases with ordered structures.
II. THERMODYNAMIC ASPECTS
Thermodynamic quantities of chemical reactions related to the CIGS system have been summarized, Reference Cahen and Noufi43 stability issues discussed, Reference Guillemoles, Kronik, Cahen, Rau, Jasenek and Werner Schock44–Reference Guillemoles46 and formation energies for point defects calculated from first principle methods. Reference Wei, Zhang and Zunger47–Reference Malitckaya, Komsa, Havu and Puska50 In this contribution, we focus on thermodynamic aspects particularly with respect to the interchangeability of Cu and Na in the CIGS system and extend this consideration to the heavier alkali metals K, Rb, and Cs.
To describe the interaction between Cu and Na in Cu(In,Ga)Se2 or CuInSe2, we refer to the article of Wei et al., Reference Wei, Zhang and Zunger47 who formulated the following two reactions (1) and (2) and calculated the reaction enthalpy ΔHR and the mixing enthalpy ΔH mix for them, respectively.
 $${\rm{Na}} + {\rm{CuInS}}{{\rm{e}}_{2\left( {{\rm{chalcopyrite}}} \right)}} \mathbin{\lower.3ex\hbox{$\buildrel\textstyle\leftarrow\vskip 2pt\over{\smash{\rightarrow}\vphantom{_{\vbox to.5ex{\vss}}}}$}} {\rm{NaInS}}{{\rm{e}}_{{\rm{2}}\left( {{\rm{layered}}} \right)}} + {\rm{Cu}}$$
 $$\left( {1 - x} \right){\rm{CuInS}}{{\rm{e}}_2} + x{\rm{NaInS}}{{\rm{e}}_2} \mathbin{\lower.3ex\hbox{$\buildrel\textstyle\leftarrow\vskip 2pt\over{\smash{\rightarrow}\vphantom{_{\vbox to.5ex{\vss}}}}$}} {\rm{N}}{{\rm{a}}_x}{\rm{C}}{{\rm{u}}_{1 - x}}{\rm{InS}}{{\rm{e}}_2}$$
One can expect the interaction between sodium and CuInSe2 to be much more complicated than that described by the two reactions (1) and (2). Nevertheless, it will turn out that they represent a useful approximation.
Reaction (1) describes the case that atomic Na substitutes for Cu in CuInSe2, forming NaInSe2. The reaction is calculated to be exothermic with a negative reaction enthalpy of ΔH R = −1.9 eV, i.e., the substitution of Cu by Na is a spontaneous process and can easily take place. On the other hand, for the reverse direction, the enthalpy must be positive (ΔH R = +1.9 eV) and the reaction will therefore be endothermic, i.e., the replacement of Na by Cu in NaInSe2 is no longer a spontaneous process and will require higher energetic effort. We therefore conclude that it is easier to form NaInSe2 from CuInSe2 than to regenerate CuInSe2 once NaInSe2 has formed.
These findings are in good agreement with experimental observations reported by Rudmann, Reference Rudmann51 indicating that sodium acts as a barrier for copper diffusion during the second step of the CIGS 3-stage growth process (see Sec. V) at low deposition temperatures below 450 °C. This inhibited diffusion leads to an inhomogeneous Cu distribution in the absorber layer, with excess Cu in the upper and Cu deficiency in the lower part of the layer and disturbed CIGS phase formation which has a detrimental influence on the cell’s performance. In contrast, the presence of sodium at higher deposition temperatures in the second stage does not hinder a more homogeneous Cu distribution and enhances absorber properties (although grain sizes are smaller).
An explanation for the experimental observation that the presence of Na decreases copper diffusion at lower temperatures is given by Oikonnen et al. Reference Oikkonen, Ganchenkova, Seitsonen and Nieminen52 by using density-functional-theory-based calculations. They demonstrated that Na reduces copper mass transport due to the occupation of copper vacancies by NaCu defects and that this mechanism can also impede VCu-related cluster formation and lead to measurable effects on defect distribution within the material.
Reaction (2) describes the case that both components, CuInSe2 and NaInSe2, react to form a single-phase compound Na x Cu1−x InSe2. For this chemical conversion, a mixing enthalpy of ΔH mix = x (1 − x)·Ω with Ω = 0.67 eV was calculated. Reference Wei, Zhang and Zunger47 This value is positive for every x = 0–1, i.e., the reaction is endothermic for every Na/(Na + Cu) ratio. Endothermic does not mean that reaction (2) is impossible from left to right but that a higher temperature is required for the formation of the quaternary single-phase compound.
To better quantify these findings, it is necessary to consider the Gibbs function of mixing, ΔG mix, which is a measure of the spontaneity of a reaction. For instance, for a generalized reaction (1 − x)A + xB → C, the Gibbs function of mixing ΔG mix = ΔH mix − T·ΔS mix = G C – (1 − x)G A − xG B, where ΔS mix is the entropy. Since the entropy is always positive, Reference Alling, Högberg, Armiento, Rosen and Hultman53 as are T and ΔH mix, the algebraic sign of the Gibbs function will depend on the quantitative relationship between ΔH mix and T·ΔS mix. Higher temperatures will eventually lead to negative ΔG mix values. ΔG mix = 0 describes a reaction in equilibrium; For ΔG mix < 0, the reaction is exergonic, i.e., spontaneous from A + B → C; and for ΔG mix > 0 the reaction is endergonic, i.e., spontaneous in reverse direction A + B ← C.
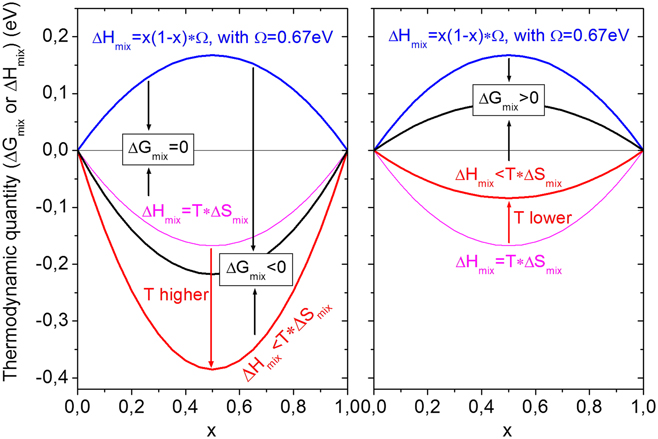
Accordingly for reaction (2), the dependence of ΔG mix on the temperature and the calculated ΔH mix can be graphically represented as shown in Fig. 2.
Gibbs function ΔG mix for reaction (2) in dependence on composition and temperature.
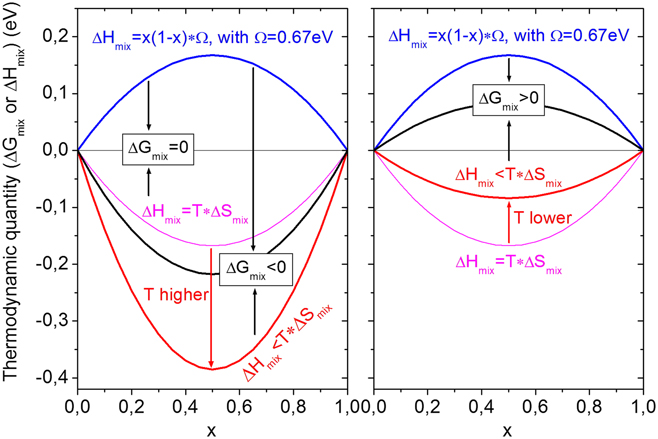
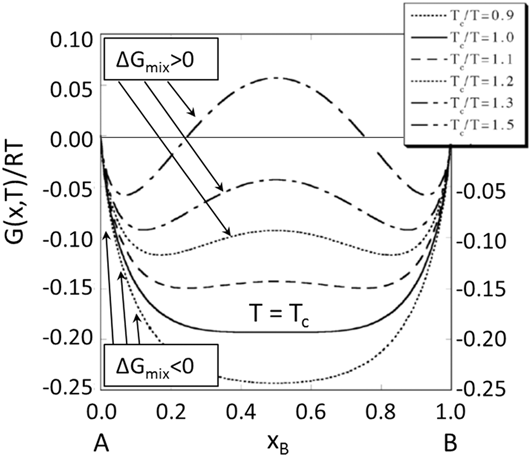
If the temperature is high enough so that T·ΔS mix > ΔH mix, then ΔG mix < 0 (ΔS mix always positive), and the mixing of CuInSe2 and NaInSe2 to a single-phase compound Na x Cu1−x InSe2 would be a spontaneous process. In contrast, at lower temperatures with TΔS mix < ΔH mix, ΔG mix > 0 results and the reverse reaction, i.e., the decomposition to the single compounds CuInSe2 and NaInSe2, would be spontaneous. The lowest required temperature for a single-phase formation is the so-called critical temperature T C. For ideal binary systems, the influence of the temperature on the curvature of the Gibbs function Reference Provatas and Elder54 is described in Fig. 3.
Curvature of the Gibbs function G for an ideal binary system in dependence on the composition x and the temperature T. T c is the critical temperature, above which only single phase material exists.

Figure 3 shows the transition from negative ΔG mix values at higher temperatures for an exergonic reaction to positive ΔG mix values at lower temperatures for an endergonic reaction. It is remarkable that for compositions with x close to 0 or to 1, the Gibbs function ΔG mix can assume negative values, even at lower temperatures. This suggests that an extremely small amount of component B can always be dissolved in component A and vice versa.
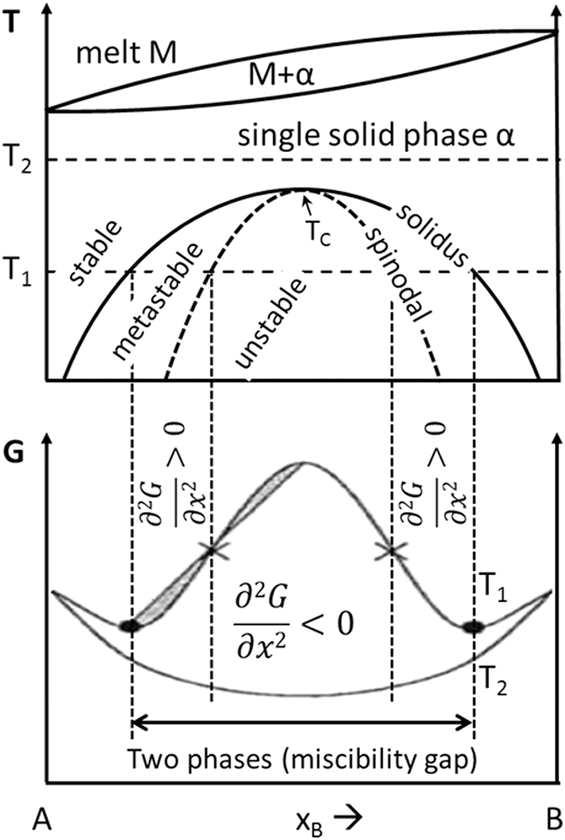
The translation of the G values from Fig. 3 to a binary phase diagram provides us with the concept of the immiscibility of phases or spinodal decomposition. Reference Balluffi, Allen and Carter55–Reference Holder, Siol, Ndione, Peng, Deml, Matthews, Schelhas, Toney, Gordon, Tumas, Perkins, Ginley, Gorman, Tate, Zakutayev and Lany58 The model can best be illustrated by Fig. 4. It shows the course of the Gibbs function G at two different temperatures and the correlation to the phase diagram of an ideal binary system.
Concept of spinodal decomposition: Gibbs function and phase diagram with a miscibility gap.

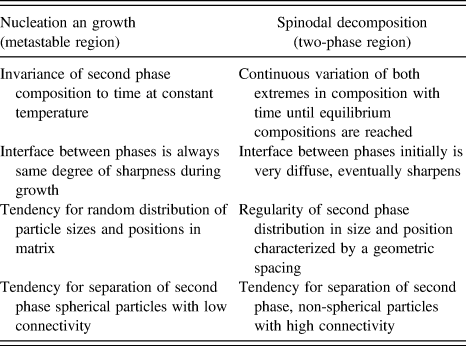
At the higher temperature T 2, ΔG mix is negative for every composition x leading to the formation of a stable single phase. At lower temperature T 1, ΔG mix becomes positive for every x between the minima of the G function, leading under equilibrium conditions to the spontaneous decomposition of the material system in two phases (miscibility gap) according to the lever rule as dictated by the binary phase diagram. Outside the miscibility gap, ΔG mix remains negative and allows the existence of a stable single-phase material. The border line is defined by the solidus curve, which corresponds to the minima of the G function with the first derivative ∂G/∂x = 0. The second derivative at the saddle points of the G function ∂2 G/∂x 2 = 0 defines the spinodal line in the binary phase diagram. Since the second derivative can take positive or negative values within the miscibility gap, this results in a metastable region between the solidus and the spinodal line and in an unstable region under the spinodal line. The two regions are characterized by different decomposition mechanisms (nucleation and growth versus spinodal decomposition) and the separation of different phase morphologies as described in Table I after Chan and Charles. Reference Chan and Charles59
Some factors which differentiate between nucleation and growth and spinodal mechanisms during isothermal phase separations (after Chan and Charles Reference Chan and Charles59 ) (Reprinted with permission from Ref. Reference Chan and Charles59, Society of Glass Technology, 1965).

A positive mixing enthalpy is calculated for reaction (2) between CuInSe2 and NaInSe2. This leads to the situations that, depending on temperature, the Gibbs function ΔG mix can take negative or positive values. The necessary condition where both compounds are stable and can coexist under thermal equilibrium is fulfilled as demonstrated by the calculated stability triangles of the Na–In–Se and the Cu–In–Se system. Reference Wei, Zhang and Zunger47 This allows us to apply the model of spinodal decomposition for the system CuInSe2/NaInSe2. We can expect that under thermal equilibrium, sufficient solubility of NaInSe2 in CuInSe2 to form a quaternary single-phase material would be feasible at low NaInSe2 concentrations and can be increased at higher temperatures (see Fig. 4). For higher NaInSe2 concentrations, we can expect the formation of randomly distributed particles in the metastable region between the spinodal and solidus curve and a two-phase separation in the region under the spinodal curve, according the information in Table I.
III. APPLICABILITY OF THE MODEL FOR FABRICATION OF CIGS THIN FILMS
The model of immiscibility of phases requires equilibrium conditions and stability of the involved compounds. However, the deposition of CIGS or CIGSS thin-film layers is a complicated dynamic nonequilibrium process, which can be carried out by the co-evaporation or the sequential process as described above. The composition of the layer can vary in the Cu/(In + Ga), Ga/(Ga + In), and S/(S + Se) ratio at different locations. CIGS or CIGSS layers are preferentially prepared with element concentration gradients through the layer thickness rather than with a homogeneous element distribution.
The concentration of sodium or other heavier alkali elements (potassium, rubidium, and cesium) in the chalcopyrite absorber layer can be influenced by the substrate, the use of alkali-containing precursors, the application of an alkali PDT, deposition temperature profiles, evaporation rates, or partial pressures of the different elements.
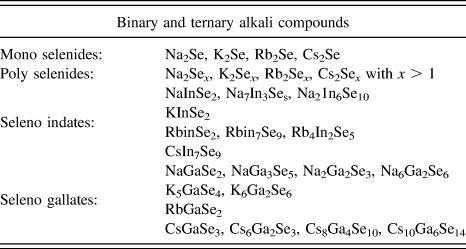
Depending on the incorporation methods and the alkali elements used, a variety of binary or ternary alkali metal compounds can theoretically be formed during the chalcopyrite layer processing. Some binary alkali mono or poly selenides (Na2Se x , Reference Sangster and Pelton60 K2Se x , Reference Sangster and Pelton61 Rb2Se x , Reference Sangster and Pelton62 Cs2Se x Reference Sangster and Pelton63 ; with x ≥ 1) and ternary alkali metal seleno indates Reference Hoppe, Lidecke and Frorath64–Reference Huanga, Denga, Ellis and Ibers68 or gallates Reference Krebs67,Reference Do and Kanatzidis69,Reference Friedrich, Schlosser and Pfitzner70 which are well known from the literature are summarized in Table II. Most of them have layered structures, i.e., they are rather soft materials and show a limited chemical stability at ambient conditions. For instance, NaInSe2 Reference Hoppe, Lidecke and Frorath64 has a layered α-NaFeO2 structure and can be synthesized by the reaction of Na2Se and In2Se3 at 280–300 °C/1.3 × 10−4 mbar. The material has a red color and decomposes in humid air (quicker in acidic solutions) to a gray product under the formation of H2Se or elemental Se.
Some known alkali metal selenides and alkali seleno indates or gallates.

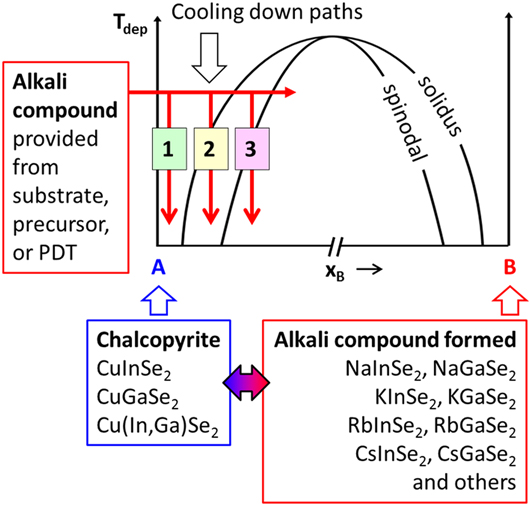
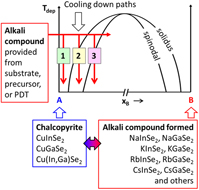
Under the assumption that some of the alkali compounds from Table II can be formed during the CIGS process and interact locally with the chalcopyrite in quasi-equilibrium with a positive mixing enthalpy ΔH mix, even for a while, we can expect scenarios as schematically indicated in Fig. 5 for our system. Since the incorporation of alkali elements in CIGS only aims at doping-level concentrations, only the left side of the binary phase diagram is of interest, i.e., for x B values close to zero. As mentioned above, according to the calculated stability triangles of the Na–In–Se and the Cu–In–Se system, Reference Wei, Zhang and Zunger47 the only Na compound that can coexist under thermal equilibrium with CuInSe2 is NaInSe2. The binary NaSe2 is excluded. Therefore, for Fig. 5, only the ternary alkali compounds were considered as the possible component B. The alkali elements can diffuse into the CIGS layer from the glass substrate at elevated temperatures or can be provided in Se atmosphere from a precursor layer or by PDT as an alkali fluoride. Selenium is needed for the removal of fluoride as gaseous selenium fluoride during the PDT process. The alkali receptivity of the CIGS layer will be limited by the solidus curve and the deposition temperature. On exceeding the solidus or spinodal curve toward a higher alkali concentration, x B, during the alkali supply or toward a lower temperature during cooling down, alkali-rich secondary phase separation will result according to the lever rule as dictated by the phase diagram. As shown in Table I, depending on the alkali concentration and the temperature, the separation of the secondary phases will be influenced by different mechanisms (metastable or two-phase region). However, to be able to make qualitative or quantitative assessments for the CIGS deposition process according to the model, it is important to have the information about the alkali compounds which are actually formed in CIGS as determined by the kinetics and to know the Gibbs function G(x,T) of the defined equilibria.
Schematic representation for interaction scenarios between chalcopyrite and alkali compounds during Cu(In,Ga)Se2 processing. Cooling down paths: [1] single phase formation, [2] formation of randomly distribution of particles, and [3] secondary phase separation.
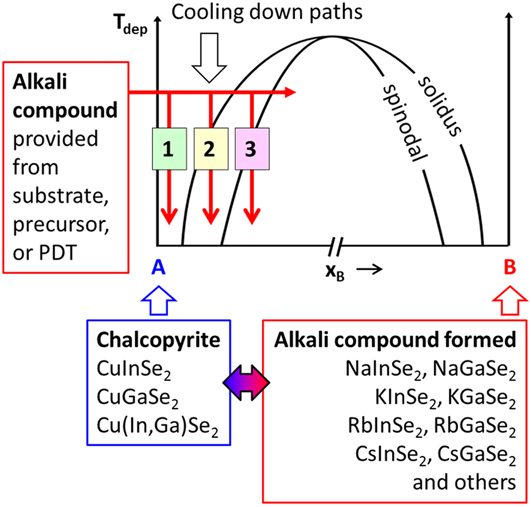
In the following, we refer to examples from the literature for inhomogeneous alkali distribution, segregations at grain boundaries, formation of clusters or microstructures, and the separation of secondary phases with ordered structures as observed in CIGS layers, and correlate them with the model as schematically represented by Fig. 5. We will focus on the coevaporation technology.
Of course, the distribution of alkali metals in CIGS cannot be only interpreted as a result of phase separation according to the model but also as a consequence of diffusion processes from the substrate Reference Zellner, Birkmire, Eser, Shafarman and Chen71,Reference Yoon, Seong and Jeong72 during the CIGS layer growth or after a PDT, Reference Laemmle, Wuerz, Schwarz, Cojocaru-Mirédin, Choi and Powalla73 in particular for the extremely low alkali concentrations desired for CIGS doping. Other models that could explain these phenomena as well as the influence of kinetic aspects are not discussed in this article.
IV. EXAMPLES FOR ALKALI SEGREGATIONS IN CIGS FROM THE LITERATURE
Atom Probe Tomography (APT) measurements have shown that the distribution of sodium in the bulk of polycrystalline thin-film CIGS layers is not homogeneous. The concentration inside the grains is much lower than that on the grain boundaries. Inside the grains, sodium atoms were found to be distributed homogeneously with concentrations in the range of 20 ppm (0.002 at.%) for CuInSe2 Reference Cojocaru-Mirédin, Choi, Wuerz and Raabe40 and 85 ppm (0.0085 at.%) for Cu(In,Ga)Se2. Reference Cadel, Barreau, Kessler and Pareige41 However, it is not statistically validated that the solubility of sodium in Cu(In,Ga)Se2 is principally higher than that in CuInSe2 grains. In contrast, sodium concentrations up to 50 at.% were detected on grain boundaries. Reference Abou-Ras, Schmidt, Caballero, Unold, Schock, Koch, Schaffer, Schaffer, Choi and Cojocaru-Mirédin74 The measured concentrations in the grains may correspond to the solubility limit of sodium in the chalcopyrite after cooling down from the high-process temperature (∼600 °C) to a lower temperature (Fig. 5, cooling down path 1). According to the model, the accumulation of sodium at the grain boundaries may be interpreted as the first indication for the beginning of a phase separation in the metastable region very close to the solidus curve (Fig. 5, cooling down path 2).
The formation of randomly distributed particles with low connectivity in the metastable region or separation of the regular secondary phase with high connectivity in the two-phase region (see Table I) can be expected for higher sodium concentrations. We can find many examples in the literature which can be correlated to a phase separation in the miscibility gap of the metastable as well as the unstable region.
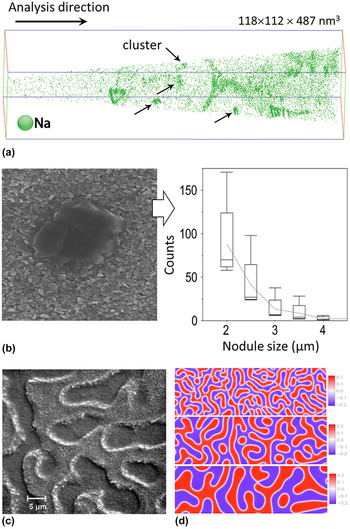
In a comparative study, as reported by Choi et al. Reference Choi, Cojocaru-Mirédin, Wuerz and Raabe75 CIGS was deposited by a single-stage co-evaporation process on glass and steel substrates, both with an NaF precursor layer on the Mo back contact, and the distribution of Na in CIGS was analyzed by APT and other methods. The Na dopant concentration was varied until the CIGS layer contained a significant amount of Na impurities. It was found that Na is inhomogeneously distributed and is segregated at GB’s and clusters inside the grains. At grain boundaries, sodium partly occupies Cu vacancies, compensating the formation of InCu point defects and thus contributing to the enhanced cell efficiency. The formation of clusters is explained by the limited solubility of Na in CIGS and can be interpreted according the model as a “phase” separation in the metastable region close to the solidus curve. The average Na concentration in the clusters is found to be 14.0 ± 0.5 at.%. Figure 6(a) shows a three-dimensional 118 × 112 × 487 nm3 sodium elemental map in the absorber film of the sample on glass as determined by APT. Several Na-rich clusters are resolved as marked by the arrows.
Examples of secondary phase separation: (a) Formation of Na-rich clusters in the grains of Cu(In,Ga)Se2 layers containing a significant amount of sodium, as detected by atom probe tomography by Choi et al., Reference Choi, Cojocaru-Mirédin, Wuerz and Raabe75 (b) formation and size distribution of nodules in Cu(In,Ga)Se2 layers prepared on stainless steel substrate with NaF precursor at high substrate temperatures in the 1st stage of the three-stage process (according to Lee et al. Reference Lee, Kaczynski, Van Alsburg, Sang, Schoop and Britt79 ), (c) scanning electron micrograph of a Ga-rich CuGaSe2 thin film on the Na-containing Mo-coated glass substrate showing secondary phase structures with reduced Cu and increased Na content (according to Nadenau et al. Reference Nadenau, Lippold, Rau and Schock80 ), and (d) example of phase separation during spinodal decomposition according to the Cahn-Hilliard model Reference Provatas and Elder54 (Adapted with permission from Ref. Reference Choi, Cojocaru-Mirédin, Wuerz and Raabe75, AIP Publishing LLC, 2011; Ref. Reference Lee, Kaczynski, Van Alsburg, Sang, Schoop and Britt79, IEEE, 2016; Ref. Reference Nadenau, Lippold, Rau and Schock80, Elsevier, 2001; Ref. Reference Provatas and Elder54, John Wiley and Sons, 2010).

Contreras et al. Reference Contreras, Egaas, Dippo, Webb, Granata, Ramanathan, Asher, Swartzlander and Noufi76 reported on the characterization of CIGS polycrystalline thin films on substrates which were coated with thin precursor layers (∼200 Å) of NaF, KF, and CsF prior to ClGS deposition and their growth by coevaporation from elemental sources. The precursor layers provided an impurity molar concentration of ∼3% with respect to the ∼2 µm thick ClGS layers. In samples grown with excessive Na (>400 Å NaF in the precursor film), formation of secondary phases were observed. In CIGS absorbers with Ga/(Ga + ln) ∼0.3, such secondary phases were characterized by three strong diffraction lines at 2θ ∼12.4, ∼24.8, and ∼37.6. Similar secondary phases were also detected in CuInSe2 and CuGaSe2. All these secondary phases were not identified but assumed to be a form of Cu u Na y (ln,Ga) w Se z compounds. A comparison of the X-ray diffraction (XRD) peaks of the unknown secondary phase formed in CuInSe2 with the database of the International Center for Diffraction Data (ICDD or JCPDS) 77 shows that the unknown phase corresponds to the peaks of NaInSe2 that was synthesized and characterized by Hoppe et al. Reference Hoppe, Lidecke and Frorath64
Lin et al. Reference Lin, Shi, Shen and Chen78 reported on the deposition of CIGS thin films on Mo/SiO x /stainless steel substrates by magnetron sputtering. The Na was supplied to the CIGS layer through a Mo:Na/Mo back contact layer that was sputtered from a metallic Mo–5%Na target. It was found that excess of the Na dopant in CIGS arising from an Na content in the Mo layer above 2.8% does not contribute to the phase crystallization of CIGS and leads to the formation of the NaInSe2 secondary phase. The formation of secondary phases increases the number of In vacancies and reduces the grain size of the chalcopyrite layer, compromising crystallinity.
Lee et al. Reference Lee, Kaczynski, Van Alsburg, Sang, Schoop and Britt79 reported on the formation of nodules in CIGS layers prepared by a roll-to-roll three-stage coevaporation process. The CIGS layers were grown with a Ga/(In + Ga) ratio of ∼0.37 on Mo-coated stainless steel substrates. Na was provided to the CIGS material by an NaF precursor evaporated onto the Mo-coated stainless steel substrate prior to CIGS deposition. The final Cu-poor CIGS composition was realized via an intermediate phase transformation to Cu-rich CIGS from a (In,Ga)2Se3 composition in the first stage of the process. It was observed that nodule formation was induced by a higher temperature in the first stage of the evaporation process. By controlling the growth of the (In,Ga)2Se3 film at low substrate temperatures, nodule formation could be eliminated, and the open circuit voltage V OC and the efficiency of cells significantly improved. The nodules were found to have a reduced Cu content and a sodium concentration higher than 0.2 at.% (>2000 ppm) as measured by energy-dispersive X-ray spectroscopy (EDS). A size distribution of 2–4 µm was found by high-resolution electroluminescence imaging [Fig. 6(b)]. Without the NaF precursor, no sign of nodule formation was observed even at a higher temperature in the first step. The effect of nodule formation in the CIGS layer can be correlated to the model since increased sodium diffusion in the (In,Ga)2Se3 layer will form thermodynamically stable Na–In/Ga–Se compounds, which cannot be dissolved in the chalcopyrite phase or will separate after cooling down in the metastable region of the binary phase diagram (compare Fig. 5 and Sec. V).
Nadenau et al. Reference Nadenau, Lippold, Rau and Schock80 reported on sodium-induced secondary phase segregation in CuGaSe2 layers which were grown by simultaneous multi-source evaporation of the elements on soda-lime glass at substrate temperatures of approximately 600 °C. The segregations were regularly structured with typical dimensions in the order of 5 µm and covering more than half of the film area. The secondary structures were characterized by a reduced thickness and an increased Ga/(Ga + Cu) ratio of approximately 0.75, correspondingly a reduced copper concentration, as well as an increased sodium content by a factor of seven compared to the surrounding material. The density of secondary structures increased with increasing the Ga content, i.e., with a reduced Cu content. A scanning electron microscopy (SEM) micrograph of a Ga-rich CuGaSe2 thin film including a high density of secondary phase structures is shown in Fig. 6(c). Micro-Raman spectroscopy analysis revealed a nonchalcopyrite phase with a structure very similar to that of CuGa3Se5. The authors suggested the formation of a quaternary Na–Cu–Ga–Se compound with the defect-chalcopyrite structure CuGa3Se5, but with the Cu-vacancies partially filled by Na atoms. According to the information in Table I, the effect of separation of regular secondary Cu-poor/Na-rich phases in CuGaSe2 can be correlated to a phase separation in the unstable region of the miscibility gap (Fig. 5). The regularity and connectivity of the secondary phase structures resemble the phase separation during spinodal decomposition according to the Cahn–Hilliard model Reference Provatas and Elder54 [Fig. 6(d)].
Similar Na-rich aggregates were reported by Balboul et al., Reference Balboul, Turcu, Kötschau, Rau, Schock, McNelis, Palz, Ossenbrink and Helm81 also for the case of CuInSe2 polycrystalline thin-films but only in early stages of film formation. By varying the Se activity during the absorber deposition, it was found that the formation of sodium-induced secondary phases is inhibited at high Se rates.
Segregation of Cu-poor/Na-rich species in CIGS is a phenomenon that was also observed at the surface of thin-film layers contained a higher Na concentration. Song et al. Reference Song, Caballero, Félix, Gerlach, Kaufmann, Schock, Wilks and Bär82 studied the impact of Na on the chemical and electronic surface structure of CIGS absorbers with various Cu-contents deposited at comparatively low temperatures in the range of 420 °C by using X-ray photoelectron and X-ray excited Auger electron spectroscopy. Sodium was incorporated into the CIGS chalcopyrite thin-film absorbers deposited on Mo-coated polyimide flexible substrates by adding differently thick layers of NaF in-between the CIGS absorber and Mo back contact. It was found that the CIGS surface composition of all samples independently on the bulk composition (Cu rich or Cu poor) or the content of segregated Na from bulk to the surface is in accordance with the Cu-depleted 1:3:5 composition as earlier reported. Reference Schmid, Ruckh, Grunwald and Schock83–Reference Mönig, Fischer, Grimm, Johnson, Kaufmann and Caballero85 However, besides this general behavior, for the highest Na contents, authors found clear indications for the formation of a (Cu,Na)–(In,Ga)–Se-like surface compound, such as Cu2Na3(In,Ga)5Se10.
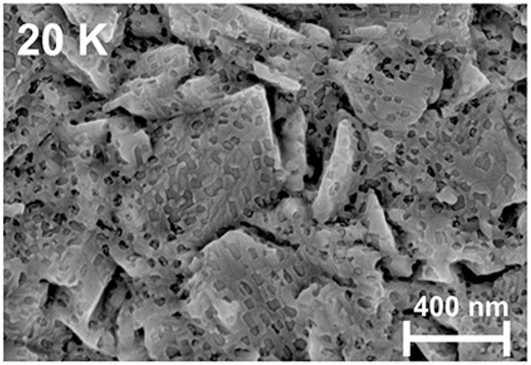
Heavier alkali metal dopants (K, Rb, and Cs) are most typically deposited on the surface of the CIGS layer by a PDT and can be incorporated into the CIGS layer depending on the substrate temperature. Similar to the alkali supply from the substrate, secondary phase segregation can also be induced by the heavier alkali element after the PDT. The prerequisite for this is that the provided amount exceeds the solubility limits as dictated by the solidus curve. The formation of the secondary phase on the CIGS surface after a NaF/KF PDT was reported by Reinhard et al. Reference Reinhard, Bissig, Pianezzi, Hagendorfer, Sozzi, Menozzi, Gretener, Nishiwaki, Buecheler and Tiwari86 A composition analysis was performed by inductively coupled plasma mass spectrometry (ICP-MS) after dissolving the surface material in H2O or diluted HCl. It was found to consist of the elements Na/K/In/Ga/Se with an insignificant amount of Cu (Fig. 7).
Formation of microstructures on the Cu(In,Ga)Se2 surface after a Na/K post deposition treatment with a Na/K/In/Ga/Se composition according to Reinhard et al. Reference Reinhard, Bissig, Pianezzi, Hagendorfer, Sozzi, Menozzi, Gretener, Nishiwaki, Buecheler and Tiwari86 (Reproduced with permission from Ref. Reference Reinhard, Bissig, Pianezzi, Hagendorfer, Sozzi, Menozzi, Gretener, Nishiwaki, Buecheler and Tiwari86, ACS Publications, 2015).

The influence of the NaF/KF PDT on the chemical surface structure of Cu(In,Ga)Se2 was also investigated by Handick et al. Reference Handick, Reinhard, Wilks, Pianezzi, Félix, Gorgoi, Kunze, Buecheler, Tiwari and Bär87 by using synchrotron-based hard X-ray photoelectron spectroscopy (HAXPES) and SEM. With increasing amounts of alkali fluorides, the surface structure was found to contain more potassium combined with a higher degree of Cu and Ga depletion, indicating the formation of a K–In–Se-type surface layer.
The distribution of heavier alkali metals in CIGS is the subject of very recent investigations. First results with APT Reference Vilalta-Clemente, Castro, Raghuwanshi, Duguay, Cadel, Pareige, Jackson, Hariskos, Wuerz and Witte42 show that the solubility in CIGS grains strongly decreases with the increasing size of the alkali element and drops below the detection limit. Heavier alkali metals accumulate at grain boundaries and displace the lighter alkali element Na.
The solubility limit of all alkali elements (Li, Na, K, Rb, and Cs) in CuInSe2 was determined by first principle calculations depending on the temperature by Malitckaya et al., Reference Malitckaya, Komsa, Havu and Puska88 and mechanisms for the secondary phase formation following the PDT process were suggested. Based on the calculated reaction enthalpies and migration considerations, they found that mixed phases are more likely in the case of LiInSe2 and NaInSe2, while formation of segregated phases are expected for KInSe2, RbInSe2, and CsInSe2.
V. CORRELATION OF THE CIGS 3-STAGE PROCESS WITH THE ALKALI METAL SUPPLY
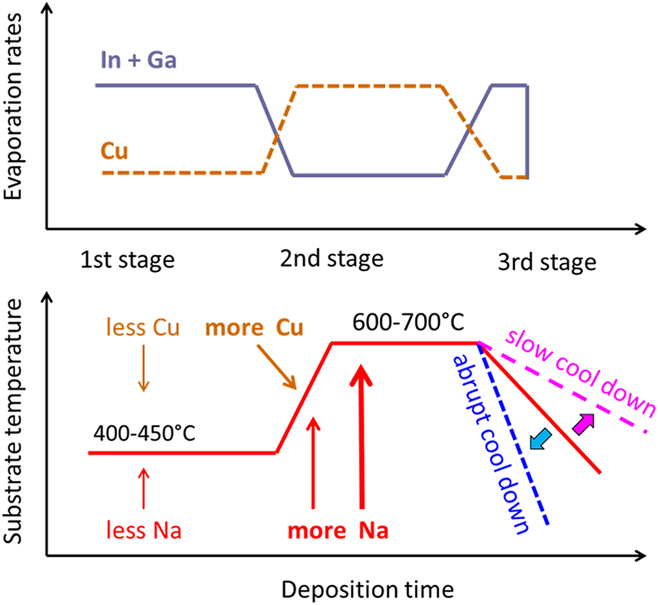
The three-stage process was empirically developed with the aim to approach the photovoltaic active α-phase initially from the Cu-poor side of the phase diagram. Typical profiles for temperatures and relative evaporation rates of Cu, In, and Ga during the CIGS three-stage process are demonstrated in Fig. 8.
Evaporation rates for Cu versus In/Ga and substrate temperature profiles during the Cu(In,Ga)Se2 three-stage process.
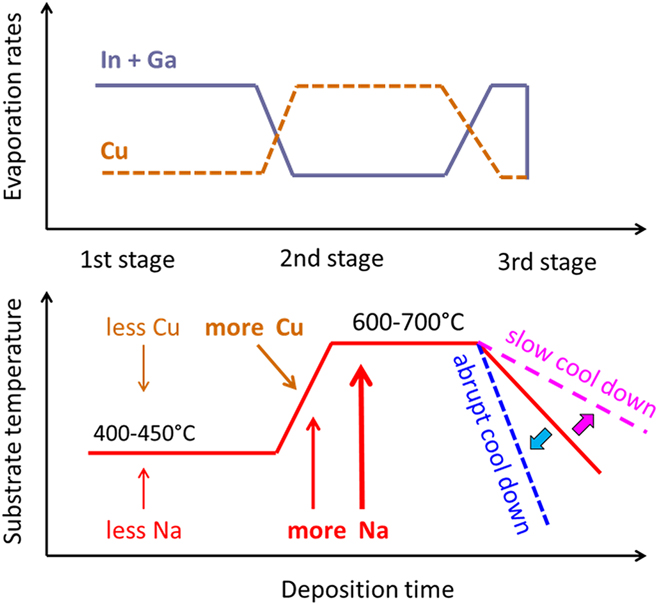
In the 1st stage, a Cu-free or Cu-poor (In,Ga) x Se y layer is deposited at relatively low substrate temperatures of 400–450 °C. In the 2nd stage, the evaporation rate of Cu is increased, whereas the In and Ga rates are reduced. The incorporation of Cu is performed at elevated process temperatures up to 600–700 °C and leads to the transformation of the Cu-poor precursor to Cu-rich Cu(In,Ga)Se2. In the 3rd stage, the desired final Cu-poor CIGS composition is realized by reducing the evaporation rate of Cu and simultaneously increasing the evaporation rates of In and Ga. The process ends after cooling down to room temperature.
But how can we interpret the necessity of a lower temperature at the 1st and a higher one at the 2nd stage and the influence of an abrupt or a slow cooling down phase on the chalcopyrite layer properties, and how does this correlate with the sodium content in the chalcopyrite layer?
Couzinie-Devy et al. Reference Couzinie-Devy, Cadel, Barreau, Arzel and Pareige89 analyzed the sodium concentration in CIGS at key points of the 3-stage process by atom probe tomography. 3D atom distributions were reconstructed for three samples namely A, B, and C which originated from the 1st stage (T = 400 °C, Cu poor), the 2nd stage (T = 630 °C, Cu rich), and the 3rd stage (T = 630 °C, completed CIGS layer, slightly Cu poor), respectively. Different sodium concentrations inside the grains were detected for the different stages of the evaporation process: for sample A ∼300 at. ppm, for sample B <10 at. ppm (below the detection limit), and for sample C ∼50 at. ppm. These findings show that the sodium concentration in CIGS during processing is not constantly at the same level but fluctuates depending on the temperature and the composition of the layer. The highest sodium concentration in the layer was detected during the first stage (when the material composition is Cu poor) although the temperature is lowest.
In the 1st stage, a higher temperature would stimulate enhanced sodium diffusion from the glass substrate Reference Hanna90 into the Cu-poor (In,Ga)2Se3 layer, easily forming stable Na(In,Ga)Se2 phases. Considering the thermodynamic limitations for the exchangeability of Na by Cu according reaction (1), we can expect that the dissolution of these alkali phases would be difficult and will require an increased energetic effort. A low temperature in the first step is therefore beneficial.
In the second stage, the increased temperature facilitates higher sodium diffusion from the substrate. However, the formation of secondary Na-rich phases like seleno indates or gallates is compensated by the simultaneous Cu diffusion. The mid–stage transition of CIGS to a Cu-rich composition further reduces the material’s capacity for sodium incorporation. The high temperature in the second stage thus supports the reduction of the sodium concentration in CIGS by evaporation and is also advantageous for the dissolution of the remaining secondary sodium-rich phases. Sodium evaporation from the CIGS layer during deposition is experimentally confirmed. Colombara et al. Reference Colombara, Berner, Ciccioli, Malaquias, Bertram, Crossay, Schöneich, Meadows, Regesch, Delsante, Gigli, Valle, Guillot, Adib, Grysan and Dale91 reported on sodium transport by evaporation from the CIGS layer matrix into the deposition system, which caused incidental gas-phase alkali doping on other chalcopyrite layers prepared on sodium-free substrates.
In the 3rd stage, the cooling down temperature gradient will determine the grain size and the sodium concentration ratio between grains and grain boundaries. An abrupt cooling down will lead to the formation of smaller grains, which, however, contain a higher amount of Na and a reduced sodium segregation at grain boundaries (quenching effect, kinetical limitation). In contrast, a slower cooling down will lead to the formation of larger grains containing lower amounts of sodium, accompanied with an increased accumulation of sodium at grain boundaries (thermodynamic limitation). Influencing the amount of sodium in the grains or in the grain boundaries provides an extra leverage for further influencing the electrical properties of CIGS layers. Reference Yuan, Chen, Xie, Park, Xiang, Gong and Wei92
VI. CONCLUSION
Consequences of the positive mixing enthalpy of the CuInSe2/NaInSe2 system on the processing of CIGS thin films were presented. The concept of immiscibility of phases (spinodal decomposition) was suggested as a tool for the interpretation of secondary phase formation. However, additional work is needed to determine realistic dynamic equilibria and associated thermodynamic quantities. Examples from the literature were presented indicating that higher amounts of alkali dopants in CIGS induce the formation of secondary phases as particles or regular phases with an alkali-rich and Cu-poor composition. The 3-stage process was analyzed with respect to the sodium content in CIGS during the layer growth.
ACKNOWLEDGMENTS
This work was financially supported by the German Federal Ministry of Economic Affairs and Energy (BMWi) within different projects. Authors would like to thank the ZSW team for valuable literature references and discussions, Rommel Noufi for constructive discussions, and Theresa Magorian-Friedlmeier for reviewing the manuscript.