Introduction
Lichens produce a great diversity of fungal secondary metabolites. There are more than 800 of these substances known (Huneck & Yoshimura Reference Huneck and Yoshimura1996; Huneck Reference Huneck, Herz, Falk, Kirby and Moore2001), and many of them are unique to lichens and synthesized by the mycobiont. About 60 of these substances occur in other fungi or even in higher plants, for example, the anthraquinones emodin and parietin (Elix & Stocker-Wörgötter Reference Elix, Stocker-Wörgotter and Nash2008; Stocker-Wörgötter Reference Stocker-Wörgötter2008). Some of the main roles that have been proposed for these secondary lichen compounds are to protect thalli from bacteria and viruses, to absorb UV light protecting algae against intensive irradiation, and to act as antiherbivorous agents against insects and other animals, as shown and discussed recently for some of these compounds by Nimis & Skert (Reference Nimis and Skert2006). Lichens are also considered to be a potential source of pharmaceutically useful chemicals (Müller Reference Müller2001; Takahashi et al. Reference Takahashi, Kinoshita, Yamamoto, Koyama and Yoshimura2005; Muggia et al. Reference Muggia, Schmitt and Grube2009) because they produce a diverse array of bioactive metabolites. Their potential applications, however, are limited by their finite sources and the slow-growing nature of lichens and their isolated symbionts. As the demand for novel chemical entities in medicine and other applications continues to grow, different approaches have been developed to obtain interesting pure substances, such as searching for high yield producing strains, with a faster growth rate by culturing aposymbiotic mycobionts in the laboratory. Mycobiont culture experiments demonstrated that some strains produce all the major natural lichen secondary metabolites, or only some of them, or accumulate primary lipids only or mixed with lichen secondary metabolites, whereas some strains produce substances not detected in the natural lichen thalli (Hamada et al. Reference Hamada, Tanahashi, Miyagawa and Miyawaki2001), many of them new to science. Some of these novel metabolites have interesting biological activities, such as cytotoxic hybocarpone, produced by the Lecanora hybocarpa mycobiont (Ernst-Russell et al. Reference Ernst-Russell, Elix, Chai, Willis, Hamada and Nash1999), which has proved to be active against the murine P815 mastocytoma cell line. Mycobiont cultures are an exceptional way to obtain compounds in sufficient quantities for bioactivity assays, both novel ones and those already known but with potential activities that are yet to be identified.
Mycobiont culture experiments are usually developed in different conditions: a) stable, as incubation in the dark (Hamada et al. Reference Hamada, Miyagawa, Miyawaki and Masakane1996) or with continuous light (Fazio et al. Reference Fazio, Bertoni, Adler, Ruiz, Rosso, Muggia, Hager, Stocker-Wörgötter and Maier2009), without changes of temperature, or b) introducing changes which presumptively could induce the synthesis of the lichen secondary metabolites, for example incubation with changes of temperature correlated with a light and dark regime (Stocker-Wörgötter & Elix Reference Stocker-Wörgötter and Elix2004), or incubation with low temperature treatment and successive desiccation periods (Stocker Wörgötter & Elix Reference Stocker-Wörgötter and Elix2009).
Recently, molecular investigations on polyketide synthase (PKS) genes have begun to develop a molecular approach to investigate these genes in lichens or in cultures, with the ultimate goal of providing a sustainable source of lichen natural products to support the applications. These researches try to obtain the PKS genes either from lichen material (Chooi Reference Chooi2008) or from cultured mycobionts (Brunauer et al. Reference Brunauer, Muggia, Stocker-Wörgötter and Grube2009; Wang et al. Reference Wang, Kim, Cheong, Koh and Hur2012). One of the main final objectives is to achieve the heterologous expression of these genes by a fast-growing transformant, for example a free living fungus such as Aspergillus spp, (Chooi Reference Chooi2008; Chooi et al. Reference Chooi, Stalker, Davis, Fujii, Elix, Louwhoff and Lawrie2008) or to develop a PKS gene library.
Polyketides comprise the greater part of the functionally diverse group of lichen secondary metabolites, the anthraquinones being a remarkable group of these compounds (Stocker-Wörgötter Reference Stocker-Wörgötter2008). Anthraquinones have been frequently reported as bioactive compounds (Manojlovic et al. Reference Manojlovic, Solujic, Sukdolak and Milosev2005; Fazio et al. Reference Fazio, Adler, Bertoni, Sepulveda, Damonte and Maier2007). In particular, important properties have been reported for emodin, as antitumoral (Huang et al. Reference Huang, Shen, Shui, Wenk and Ong2006; Cai et al. Reference Cai, Rassak, Hering, Saed, Babcock, Helton and Espat2008), antiviral (Ho et al. Reference Ho, Wu, Chen, Li and Hsiang2007; Hsiang & Ho Reference Hsiang and Ho2008) and larvicidal (Yang et al. Reference Yang, Lim and Lee2003) activities.
Lichen mycobionts in culture could be an efficient source of bioactive lichen compounds, such as emodin and 7-chloroemodin of Caloplaca erythrantha. Traditionally, culture studies of aposymbiotic lichen mycobionts tried to optimize culture conditions by changing the culture media to improve growth and lichen metabolite production.
The main goals of the present investigation were to isolate an aposymbiotic strain of Caloplaca erythrantha (Tuck.) Zahlbr., to grow it axenically and study its growth on different culture media, searching for conditions that promote a high production of the major lichen secondary anthraquinones.
Material and Methods
Thalli of the crustose lichen Caloplaca erythrantha were collected from Melia azedarach by M. T. Adler at Glew, Buenos Aires Province, Argentina, in September 2001. A voucher specimen is preserved at BAFC (39317). The lichen thallus was examined and photographed under a Stemi SR-Zeiss dissecting microscope. Thin sections of apothecia were cut by hand, mounted in water and photographed with an optical Axioscope-Zeiss microscope.
The isolation procedure to obtain polyspore colonies from discharged ascospores followed that described by Hamada (Reference Hamada1989). Superficially clean lichen material was collected and processed after three days, cleaned under a dissecting microscope, washed with tap water (1 h) and subsequently with sterilized tap water with 2% Tween 20 (1 h); finally, several apothecia were selected under a dissecting microscope, cut off, blotted with sterilized filter paper, and fixed onto the top of a Petri dish by means of petroleum jelly, to let the spores discharge upwards onto the solid mineral Bold's basal medium, BBM (Deason & Bold Reference Deason and Bold1960), after turning the dish upside down. The germinated spores were transferred to fresh solid BBM until small (1 mm diam.) fungal mycelia were obtained after growing them in a growth chamber.
The colonies were transferred to fresh solid BBM several times over 2 months, and afterwards 4 mm diam. pieces of the BBM colonies were transferred to the following media (percentages refer to the final volume of each medium):
(1) BBM+ glucose 1% (1% glucose, 1·8% agar, in Bold's basal medium).
(2) LB, original Lilly and Barnett medium (Lilly & Barnett Reference Lilly and Barnett1951; Ahmadjian Reference Ahmadjian1993) with glucose 1% as carbon source and asparagine 0·2% as nitrogen source, agar 1·8%, in distilled water.
(3) MME, modified malt extract (Leuckert et al. Reference Leuckert, Ahmadjian, Culberson and Johnson1990), malt extract 1·5%, glucose 2%, peptone 0·1%, agar 1·8%, in distilled water.
(4) BMYE (liquid Bold's basal medium with 2% mannitol, 0·1% yeast extract, 1·8% agar, in distilled water).
(5) MEYE (Ahmadjian Reference Ahmadjian1993), malt extract 2%, yeast extract 0·2%, agar 1·8% in distilled water.
(6) MY10 (Hamada Reference Hamada1989), malt extract 1%, yeast extract 0·4%, sucrose 10%, agar 1·8% in distilled water, final pH 7.
(7) BMRM, Bold mannitol rich medium (liquid Bold's basal medium with malt extract 1%, yeast extract 0·4%, mannitol 5·3%, agar 1·8%), final pH 7. This medium was developed in our lichenology laboratory, partly based on the composition of Hamada's MY10 medium, looking for the same molarity of the carbon sources (mannitol in BMRM and sucrose in MY10).
Subcultures of the mycobionts grown on these media were produced for further studies on growth and chemistry. Colonies were examined under a dissecting microscope (Zeiss Stemi R) to evaluate growth and metabolite production. Growth of mycelia at five months in the different media was characterized using the following parameters: ± (poor growth) most colonies enlarged less than 2 mm diam. during that time; + (low) enlargement of 2–4 mm diam.; ++ (good) enlargement of 5–9 mm diam.; +++ (very good) enlargement of 10–15 mm diam.
Duplicates of the present strain are preserved in BAFC-cult (N° 3844). Colonies cultured on the above media were examined for morphological observations and analyzed chemically. Pieces of the surface of colonies were also taken and mounted in distilled water to observe secondary compounds deposited on the hyphae. Optical microscope observations were made and photographs taken using a Zeiss Axioscope microscope. Colonies grown on BMYE, MEYE, MY10 and BMRM were harvested after five months of growth for chemical studies, because these media promoted better development and metabolite production.
Chemical studies
Air dried lichen material (apothecia, 144 mg) of Caloplaca erythrantha was extracted with acetone at room temperature for one week and analyzed by TLC (Culberson & Ammann Reference Culberson and Ammann1979). After evaporation to dryness, 3·4 mg of extract was obtained; this was purified by preparative TLC (silica gel, acetone-chloroform (1:1)) to afford emodin and 7-chloroemodin. These compounds were identified by comparison of their EI-MS spectra with published data (Huneck & Yoshimura Reference Huneck and Yoshimura1996) and analyzed by HPLC-DAD.
Fresh mycobiont mycelia, 120 colonies per medium, were harvested after five month growth on the best four culture media (BMYE, MEYE, MY10, and BMRM) and extracted three times with acetone at room temperature, and one time over a week with ethyl acetate. Colonies were then dried after extraction at 50°C until a constant weight. After evaporation to dryness under vacuum, the four extracts were analyzed by TLC [toluene-AcOH (170:30) and cyclohexane-EtOAc (75:25)], comparing them with previously purified metabolites from the lichen.
Mycelia extracts were analyzed by HPLC-DAD to confirm the presence of emodin and 7-chloroemodin by comparison with the lichen metabolites. Analytical HPLC was carried out on a Gilson 506C HPLC system using a Phenomenex Hypersil 5 mm column (25 cm×4·6 mm i.d.). Compounds were detected using a 170 photodiode array detector set at 245 and 254 nm, operated in series with a Unipoint System software, recording the absorption spectrum in the range 200–400 nm. Gradient elution was performed using two solvents, A: MeOH and B: 1% (v/v) aqueous orthophosphoric acid. The gradient started with 30% A for 5 min and was raised to 70% A within 15 min, then to 100% within 45 min, followed by 10 min at this condition. Solvents utilized in the HPLC were filtered through a 0·45 mm nylon filter prior to use. The samples were filtered through inorganic membrane filters of 0·2 mm prior to injection. The flow rate was 1·0 ml min–1.
Purification of the acetonic/EtOAc extracts of colonies was achieved by preparative TLC [silica gel, cyclohexane-EtOAc (75-25)]. Pure crystals of emodin (orange-red) and 7-chloroemodin (orange) were obtained from all the four extracts. Purified compounds were weighed and their concentrations per unit dry weight of colonies in each medium were indicated as percentage yields in Table 1 (Hamada et al. Reference Hamada, Miyagawa, Miyawaki and Masakane1996).
Comparison of yields (% w/w of colonies) of emodin and 7-chloroemodin purified from colonies (grown on BMYE, MEYE, MY10 and BMRM media) with the analyzed lichen material of Caloplaca erythrantha

* Yields are based on single determinations derived from pooled samples consisting of 120 colonies per medium
Results
Lichen material
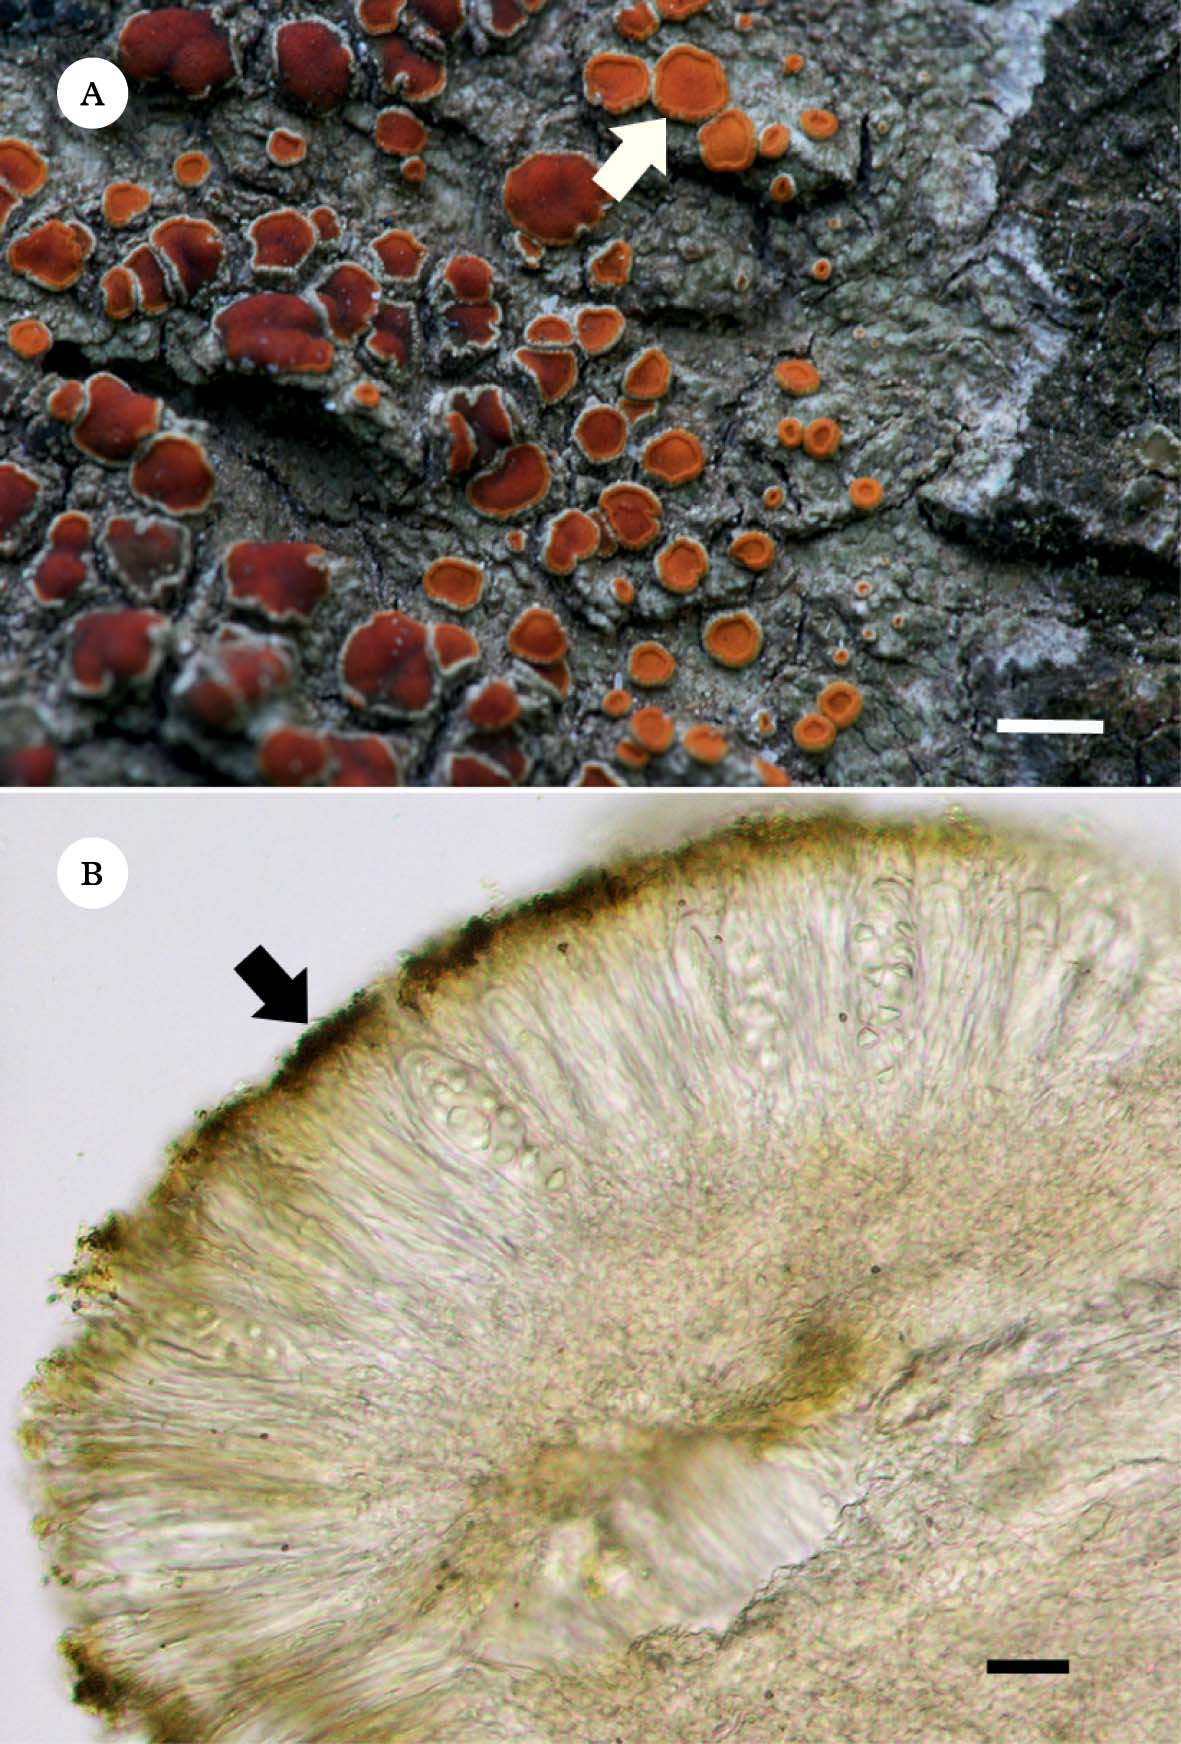
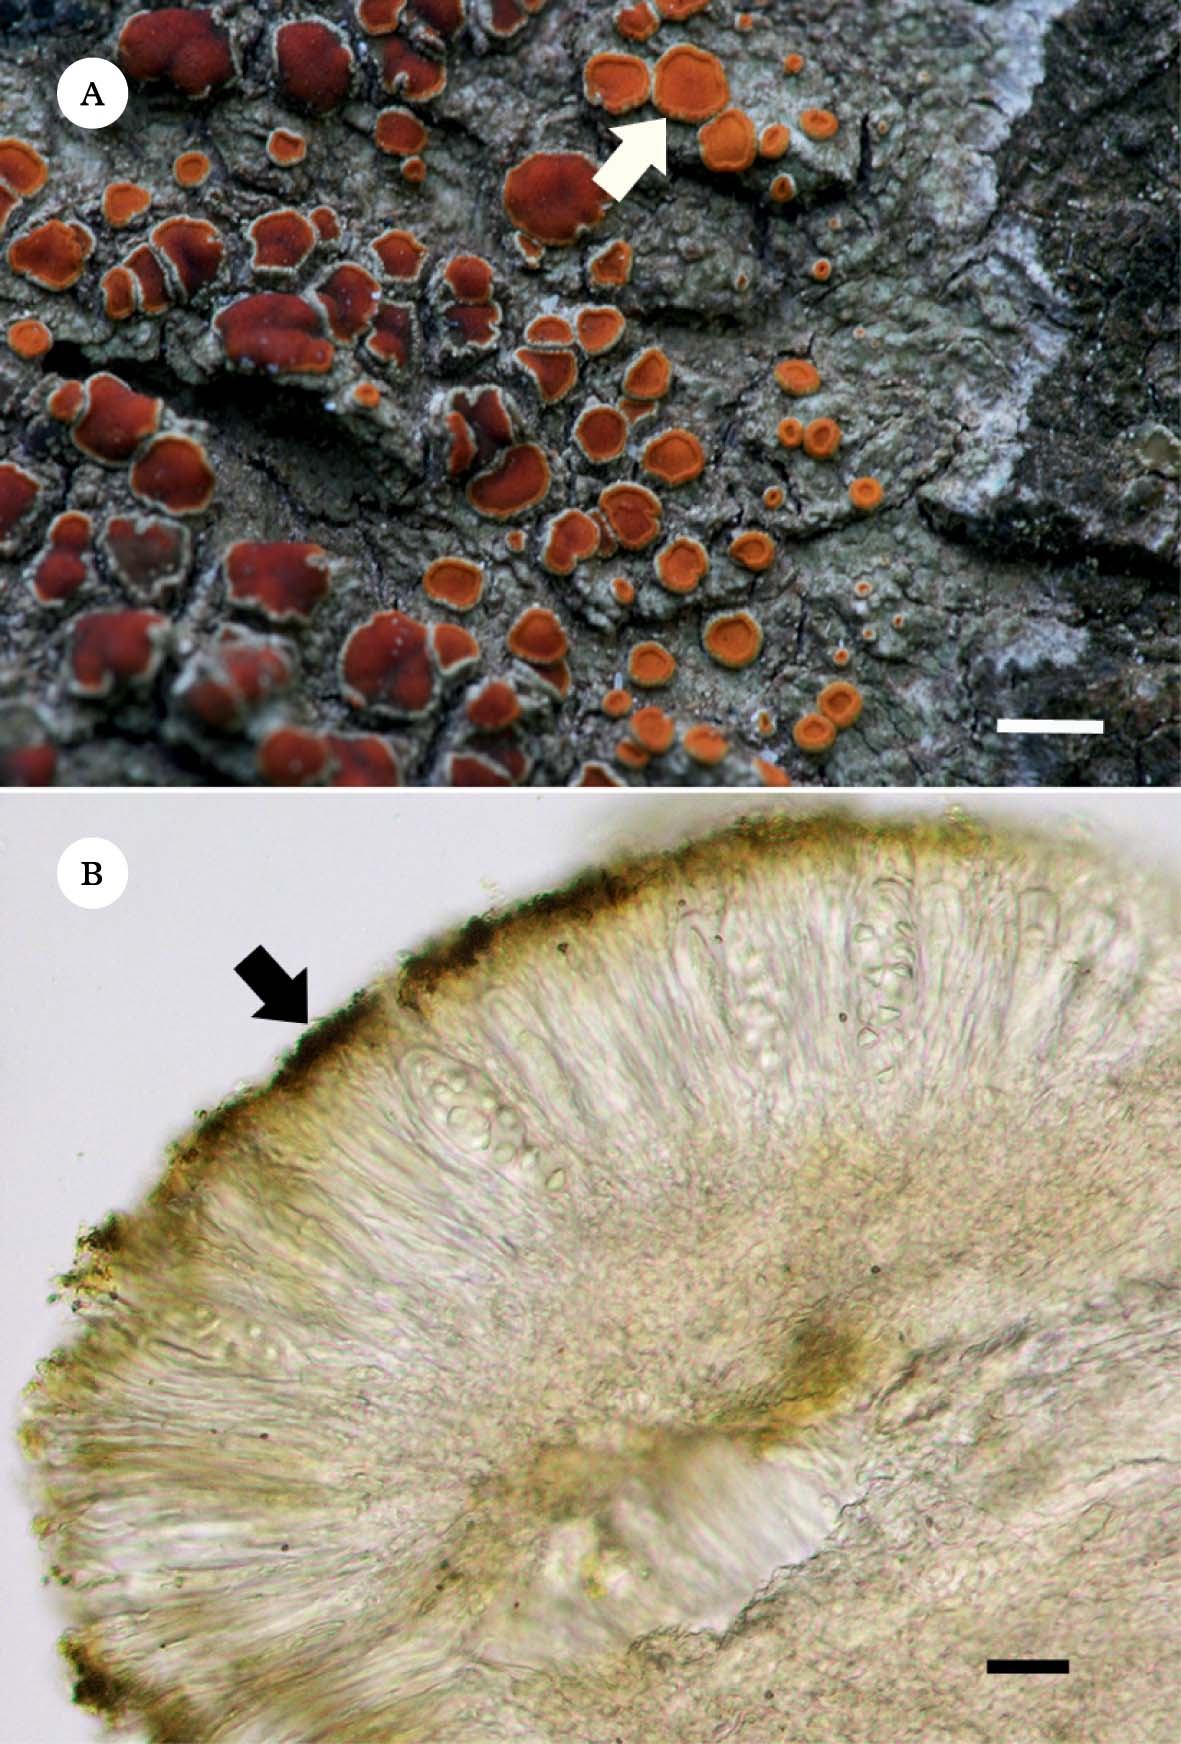
As shown in Fig. 1A, this crustose lichen has a greyish white thallus (without anthraquinones) and orange to red apothecia heavily covered in emodin and 7-chloroemodin crystals mainly deposited on the paraphyses tips that constitute the epithecium (Fig. 1B).
Caloplaca erythrantha. A, greyish white crustose thallus without pigments and orange to red apothecia (arrow), covered with anthraquinones (emodin and 7-chloroemodin); B, section of apothecium showing the epithecial anthraquinone crystals (arrow). Scales: A=2 mm; B=6 µm.
Growth and morphology of colonies and metabolite localization on hyphae
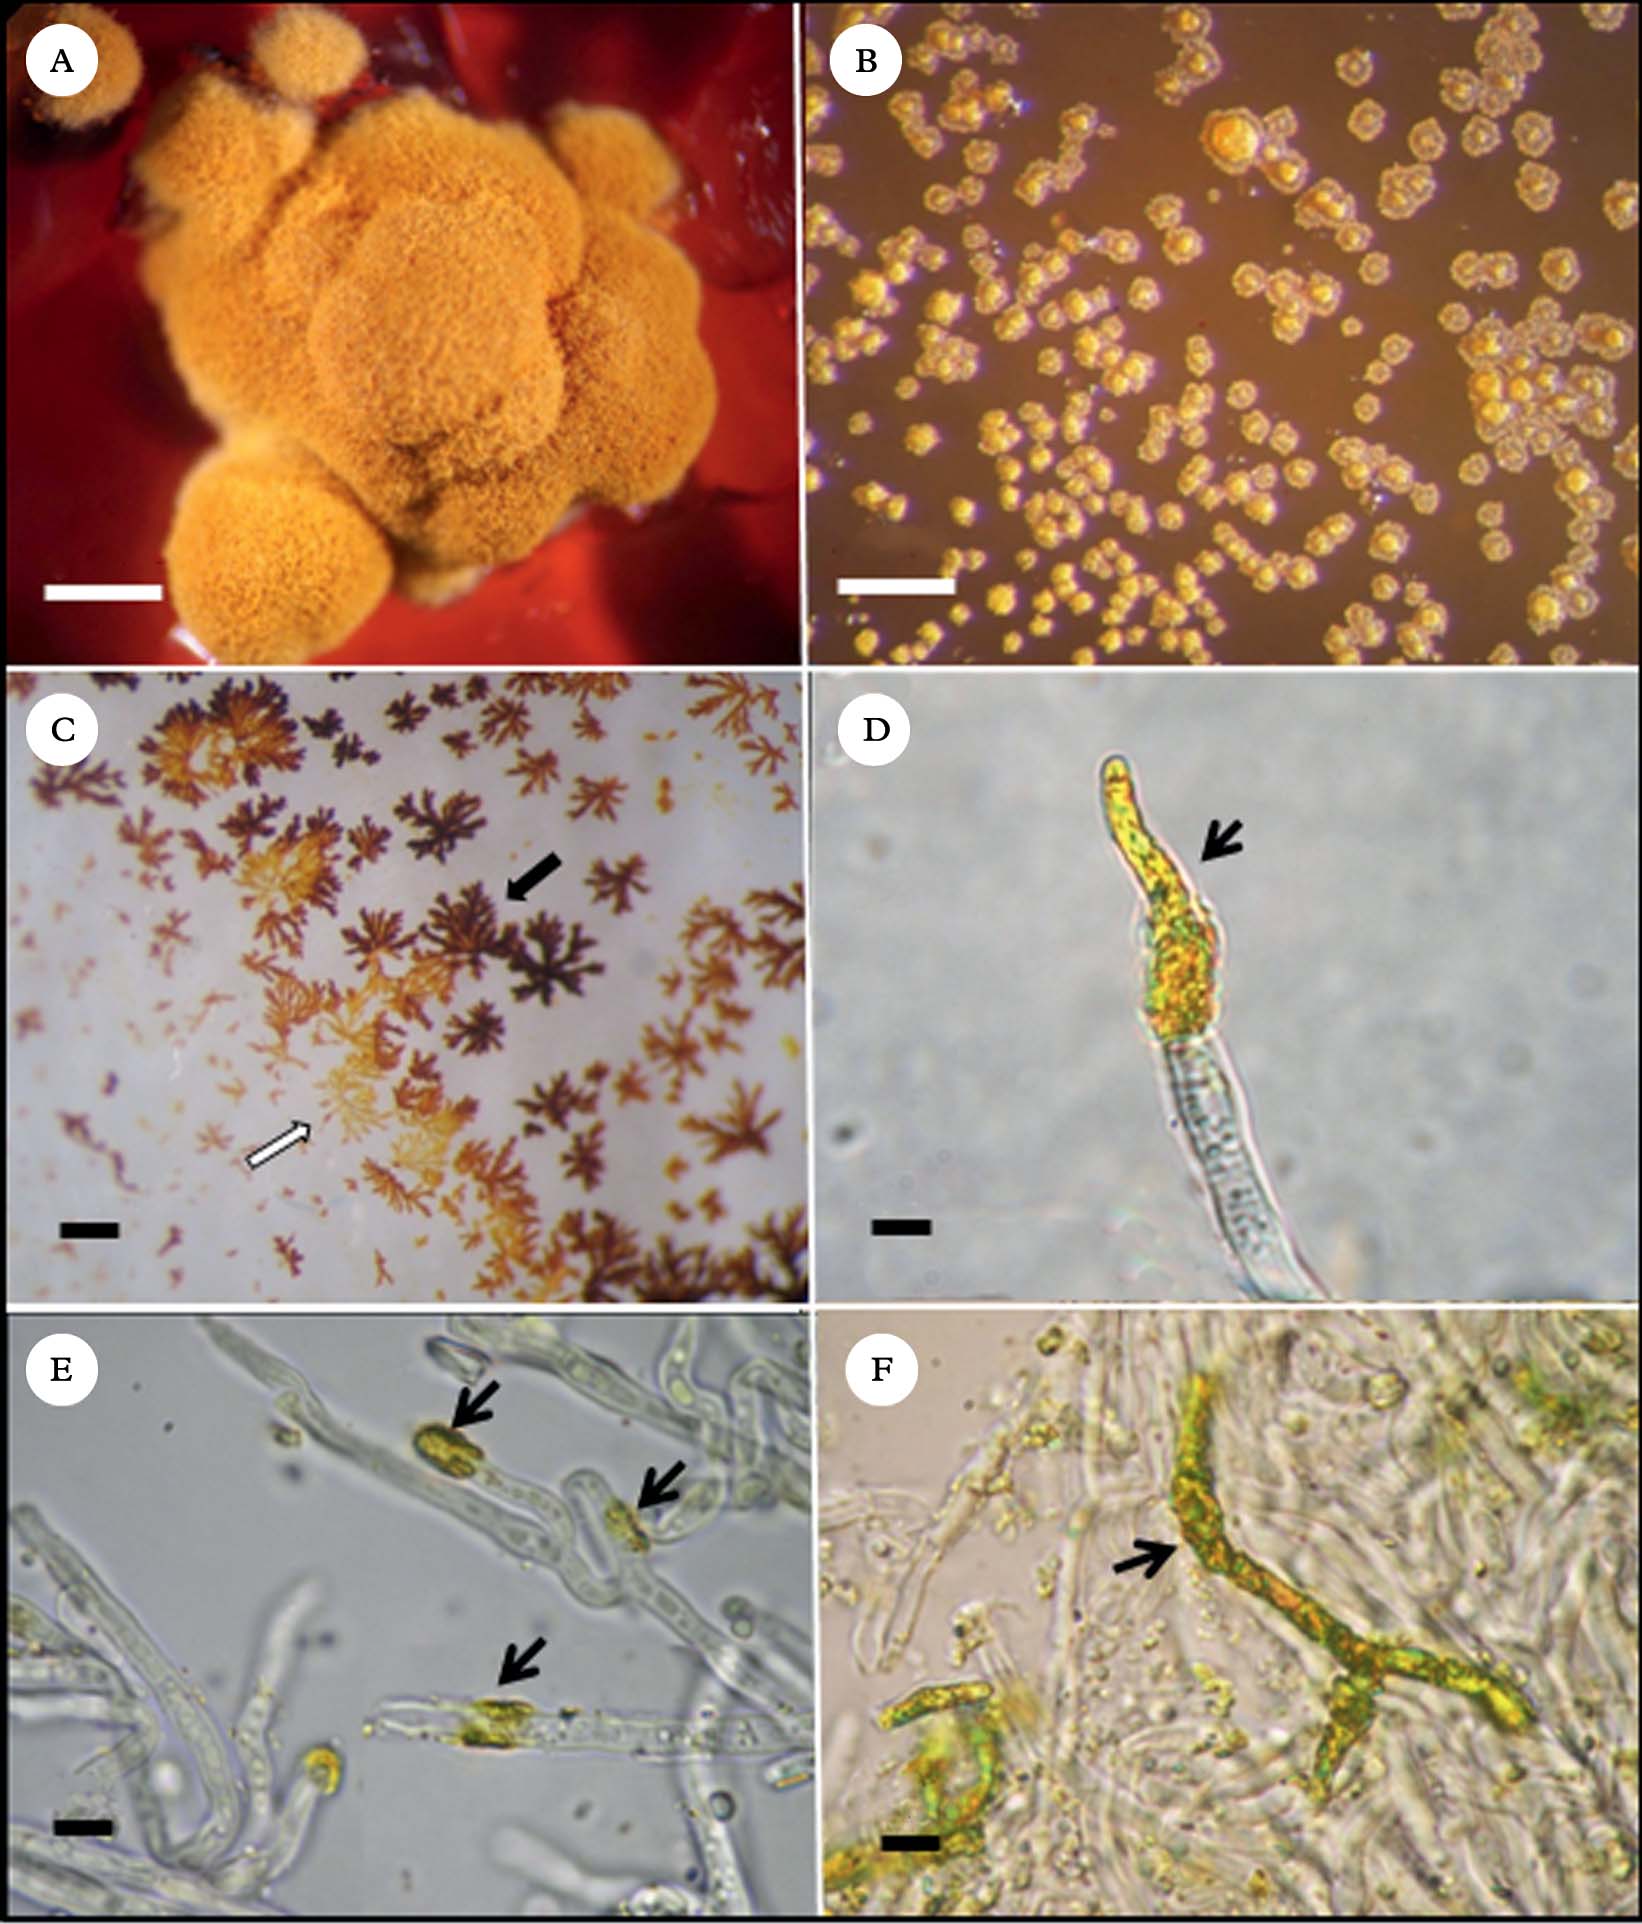
On BBM, BBM+glucose 1% and LB media, growth of colonies was poor (±), and on MME no growth could be observed. Development was satisfactory on the other four media assayed: BMYE, MEYE (++), MY10, and BMRM (+++). In each of these four media, 3–8 month old colonies were irregularly conical with thick folds (Fig. 2A). The largest, well-developed colonies were mostly c. 1·8 mm wide and 0·8–1·0 mm high. Beyond five months, significant enlargement of the colonies could not be observed.
Caloplaca erythrantha mycobiont cultures A, colony on BMRM; B, crystals of secondary metabolites formed on the agar surface of BMRM medium; C, secondary metabolites crystallized on flask inner surface during purification; black arrow points to emodin and white arrow points to 7-chloroemodin crystals; D, apical crystal deposition of secondary metabolites on a mycobiont hypha; E, annular crystal depositions on hyphae (black arrows); F, crystal deposition over a large part of a branched hypha. Scales: A=2·5 mm; B & C=1 mm; D−F=5 µm.
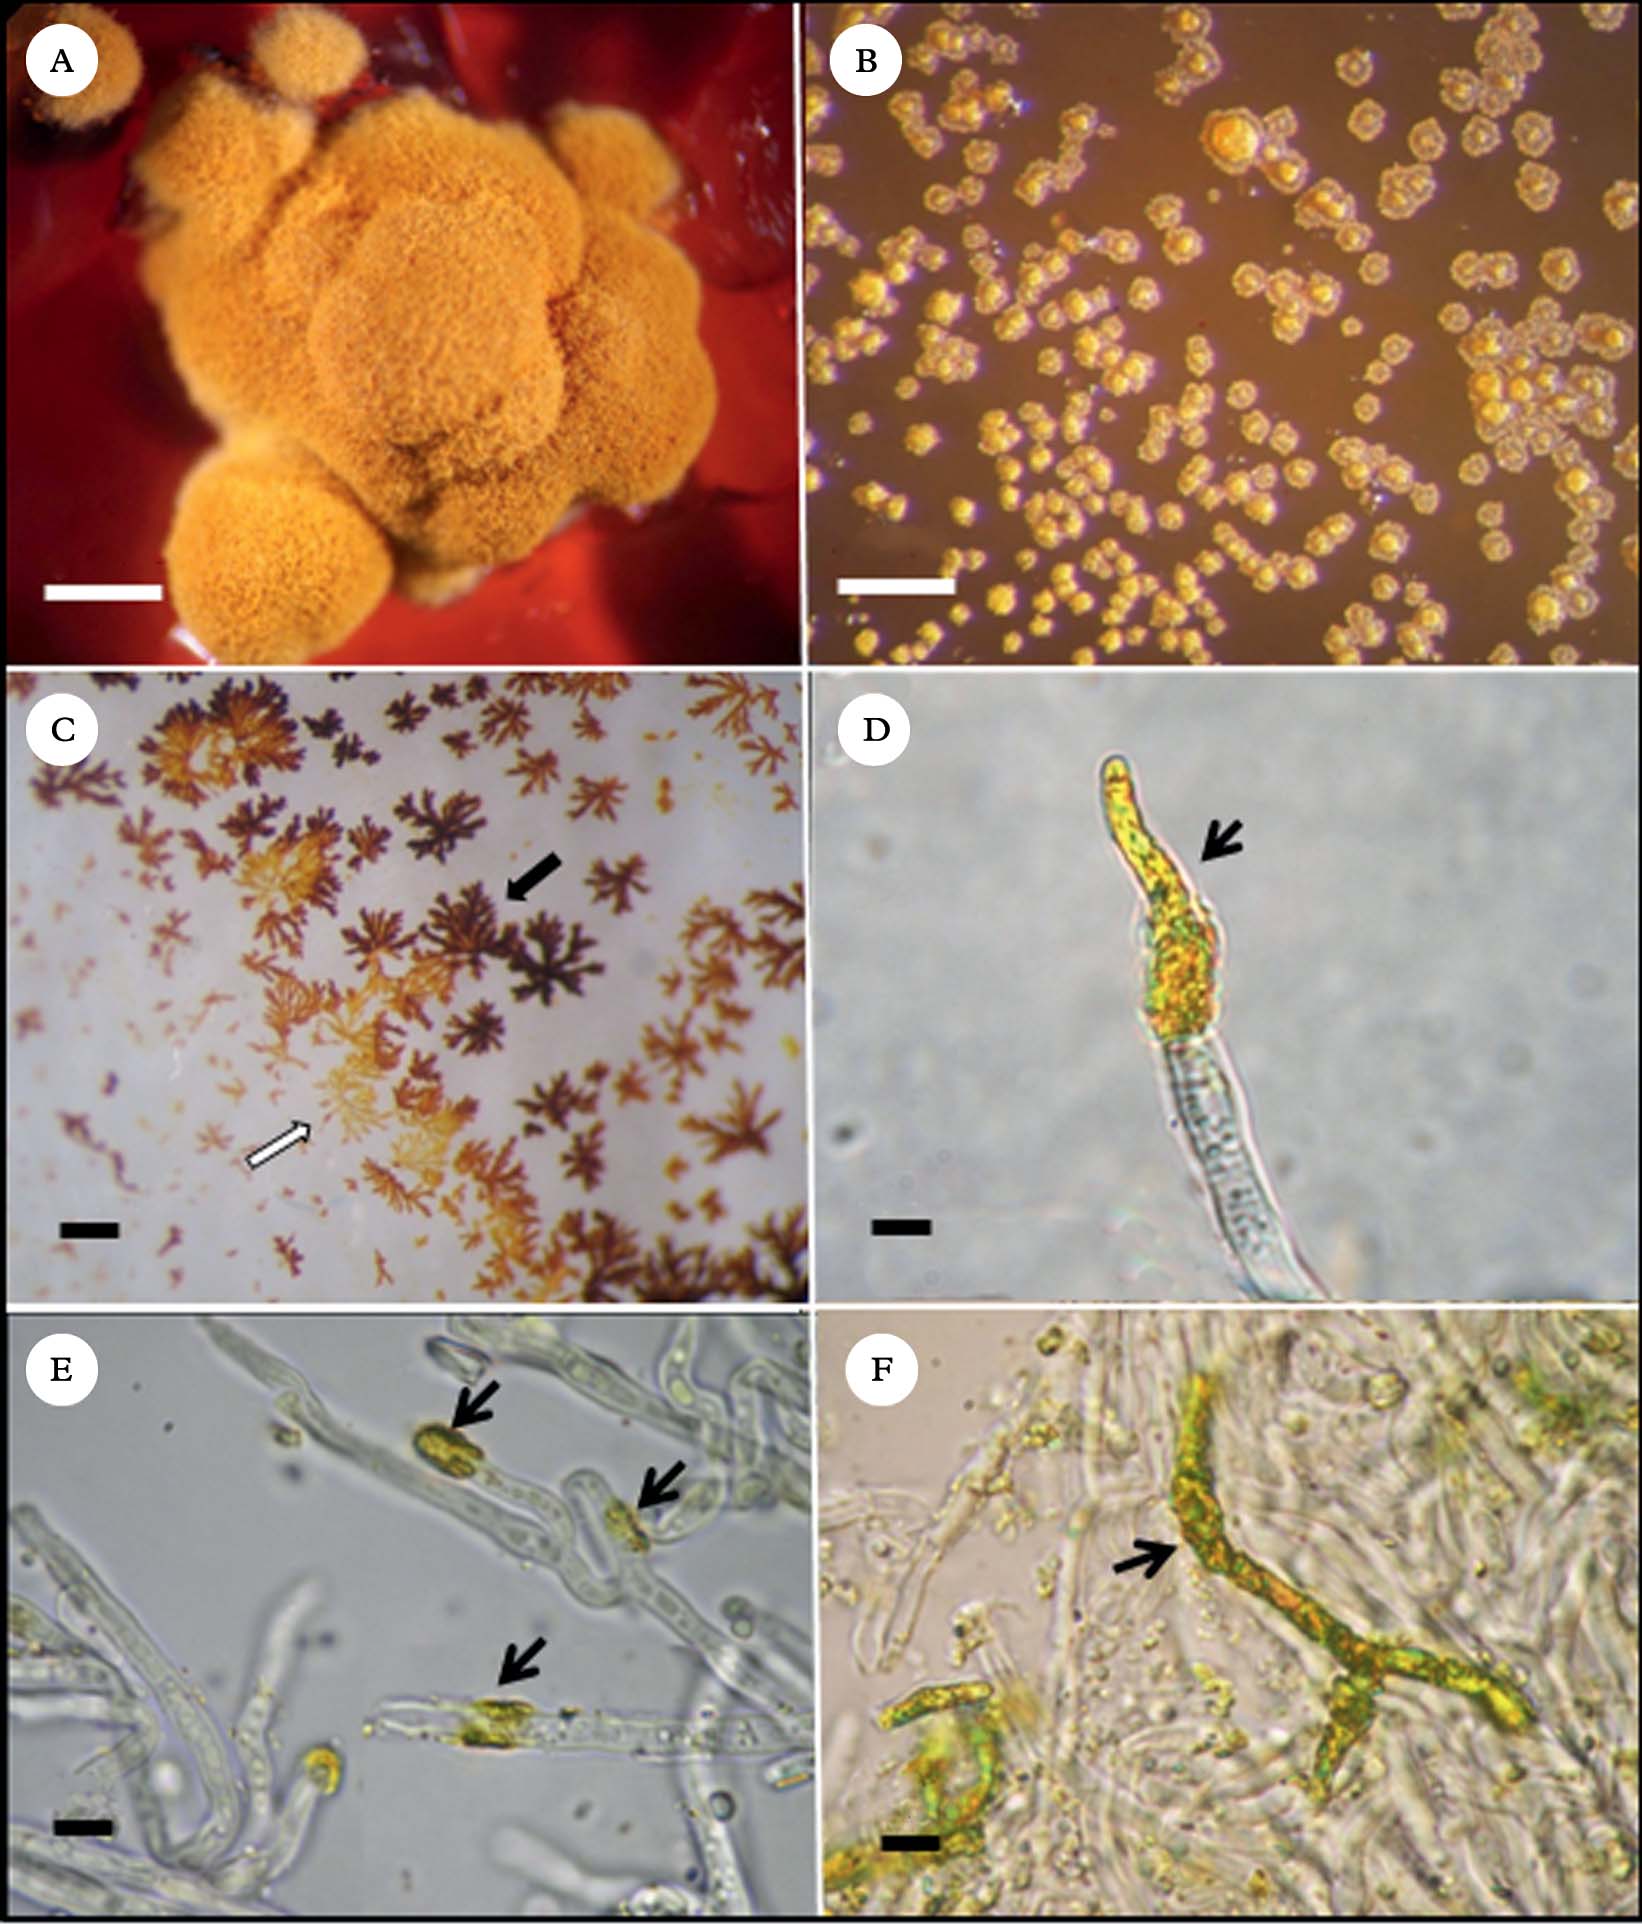
Colonies were initially pink on the four media, turning orange to yellowish orange, except on BMYE, where they turned greyish red. Frequently the medium turned deep red (Fig. 2A), presumably because of liberation of emodin from the colonies and its subsequent diffusion into the medium; this occurred with some variation in all four media. It was also common to observe metabolite crystals on the agar surface (Fig. 2B).
After extraction of the colonies and evaporation of solvents, crystals of two different colours (orange and orange-red) were observed on the flask walls, corresponding probably to emodin (orange-red crystals) and 7-chloroemodin (orange crystals) that have apparently crystallized separately (Fig. 2C). Microscope observations showed apical (Fig. 2D) and intercalary annular (Fig. 2E) deposition of crystals on the hyphal surface, presumably of both anthraquinones mixed. Commonly, crystals also covered hyphae over large parts of their surface (Fig. 2F).
Secondary metabolites
Lichen thallus
The analysis of the lichen extract yielded emodin and 7-chloroemodin as the main secondary metabolites. Both compounds were identified by comparison of their mass spectra (EI) with bibliographic data (Huneck & Yoshimura Reference Huneck and Yoshimura1996). Yields of both compounds are shown in Table 1.
Emodin: orange-red needles. EI-MS: m/z 270 (M+, 100%), 241, 214,
7-Chloroemodin: orange needles. EI-MS: m/z 304 (M+, 100%),
Cultured mycelia (colonies)
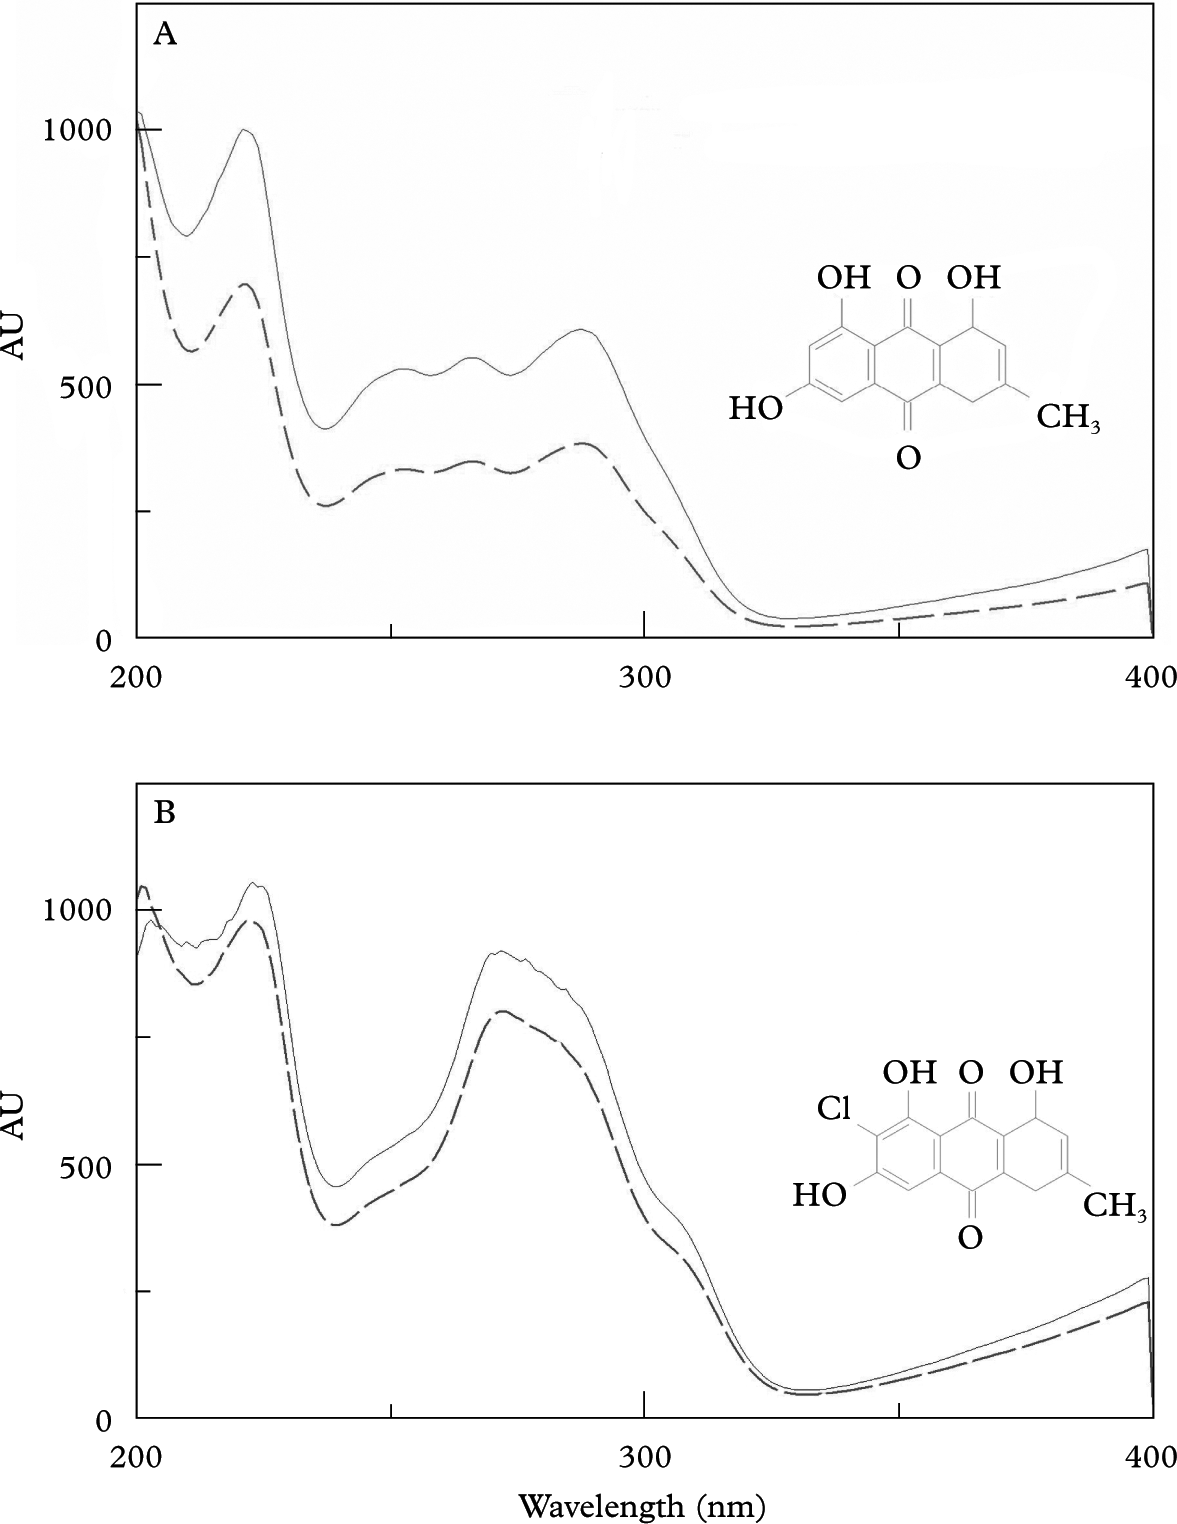
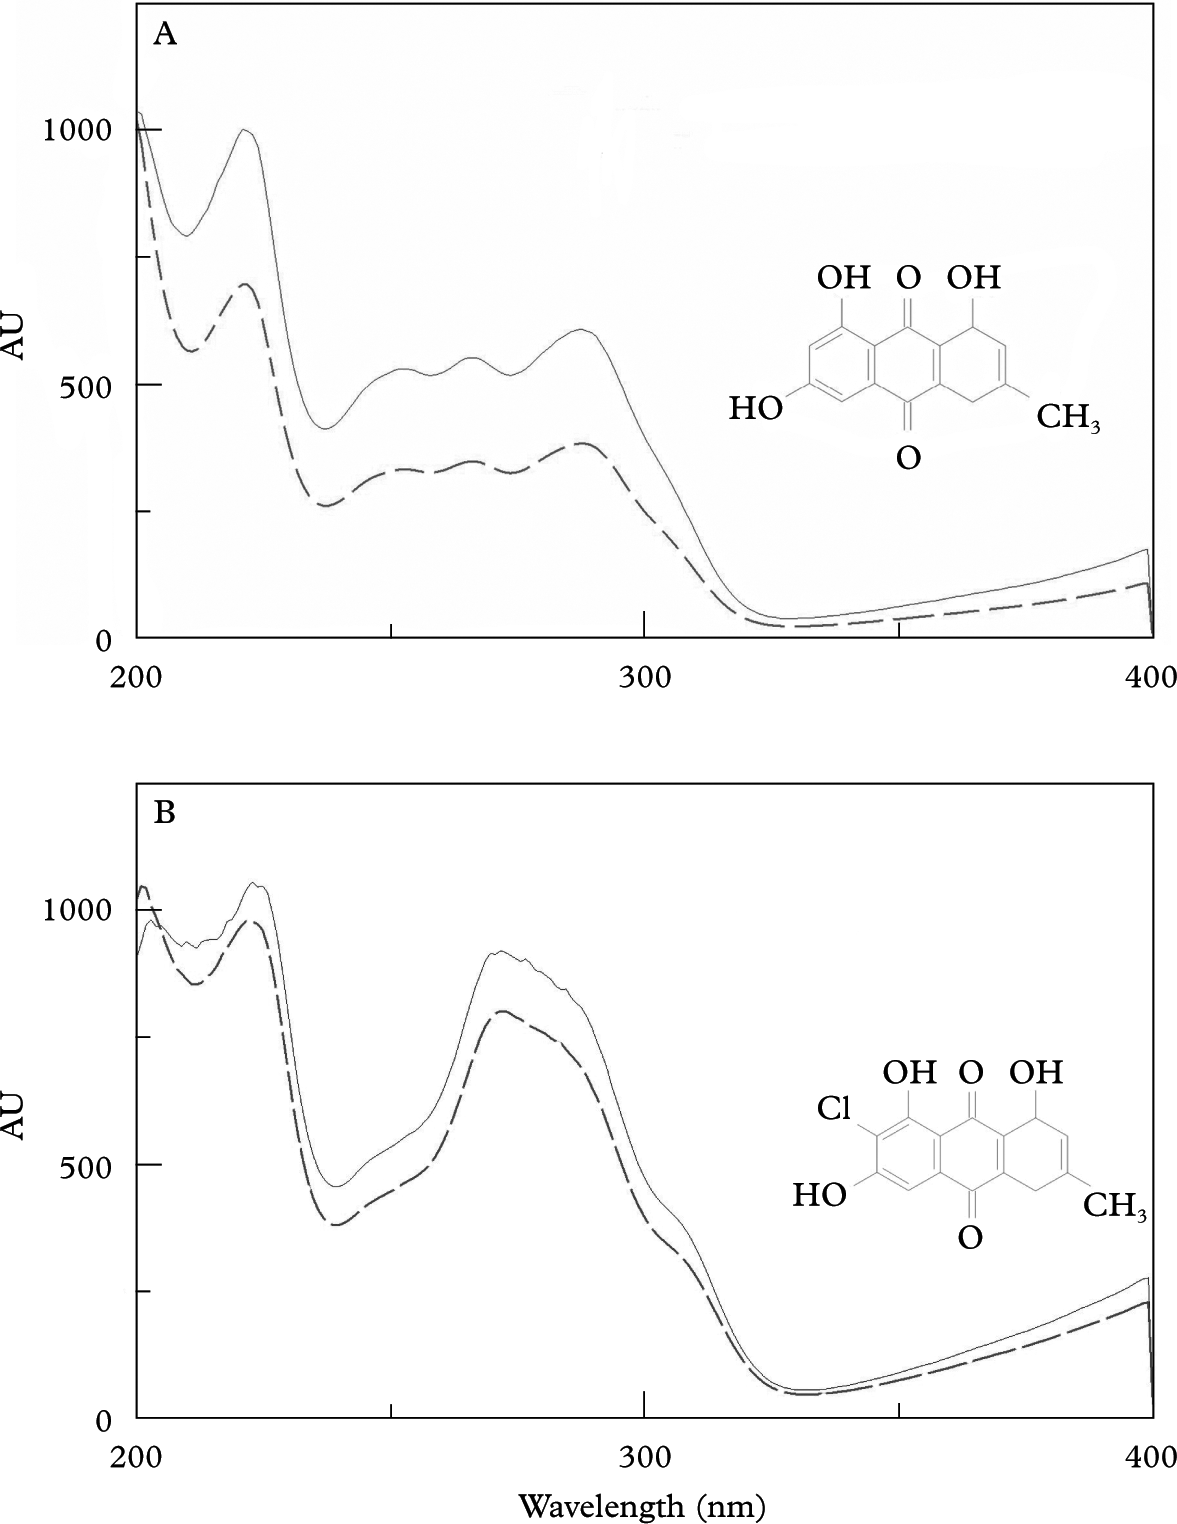
Surprisingly, the cultured mycelia produced the same anthraquinones that cover the apothecia in natural lichens but are absent in thallus hyphae. The extracts of colonies grown on BMYE, MEYE, MY10 and BMRM revealed the presence of emodin and 7-chloroemodin. Pure crystals of emodin (orange-red) and 7-chloroemodin (orange) were obtained from all the four extracts. The compounds were identified by HPLC-DAD by the matching of their UV spectra with those of emodin and 7-chloroemodin in our library (Fig. 3), and were also identified by their 1H NMR spectra (Huneck & Yoshimura Reference Huneck and Yoshimura1996).
Chemical formula and matching of UV spectrum of anthraquinones obtained from library (–––) and purified from mycobiont colonies (——). A, emodin; B, 7-chloroemodin.
Emodin: red-orange crystals. 1H NMR (500 MHz, CDCl3-d): δ=2·38 (3H, s, CH3), 6·57 (1H, d, J=2·5 Hz, H-7), 7·02 (1H, s, H-2), 7·18 (1H, d, J=2·5Hz, H-5), 7·53 (1H, s, H-4).
7-Chloroemodin: Orange crystals. 1H NMR (500 MHz, CDCl3-d): δ=2·46 (3H, s, CH3), 7·11 (1H, s, H-2), 7·46 (1H, d, J=2·5Hz, H-5), 7·65 (1H, s, H-4), 11·90 (1H, s, HO-1).
Yields of both secondary metabolites for colonies grown on the four best media BMYE, MEYE, MY10, BMRM are shown in Table 1, and also compared with lichen material yield.
Discussion
Interestingly, it has been shown that the cultured mycobiont mycelia grown in the four best media assayed, produced the two major lichen anthraquinones which are only present in the epithecium of natural lichen apothecia, probably serving to protect the sexual structures from intensive UV irradiation. The yields obtained from colonies, both for emodin and 7-chloroemodin, were higher than the percentages in the lichen apothecia, except for colonies grown on MEYE (where emodin was 0·21% compared with 0·90% in lichen material) and BMYE (7-chloroemodin 0·30 % compared to 0·56%).
Previous culture studies on mycobionts of species of the genus Caloplaca reported the production of emodin and/or 7-chloroemodin with quite low yields. Nakano et al. (Reference Nakano, Komiya and Shibata1972) reported the production of emodin (0·16%) and 7-chloroemodin (0·44%) by the cultured strain of the lichen mycobiont isolated from an unidentified species of Caloplaca. The colonies were grown over seven months and the medium used was Hamada 117 (glucose 2%, dried yeast 0·5%, agar 2% in water). These yields are below those obtained in the present study for emodin of natural lichen and mycobiont colonies grown in the four different media. The yield obtained for 7-chloroemodin grown on BMYE is the only value below Nakano's 7-chloroemodin yield of Caloplaca sp. culture. Renner & Gerstner (Reference Renner and Gerstner1978) reported the isolation of 7-chloroemodin as the major compound from a cultured mycobiont of C. ferruginea. Methodological differences and an absence of yield reports in that study do not allow comparison with the present investigation.
The anthraquinone 7-choloroemodin (0·17% in MEYE, 0·42% in MY10) was also produced by aposymbiotic mycelia of the mycobiont of C. flavorubescens (Hamada et al. Reference Hamada, Miyagawa, Miyawaki and Masakane1996). Rosso et al. (Reference Rosso, Bertoni, Adler and Maier2003) reported the production of 7-chloroemodin by the strain (BAFC-cult. 1516) of C. erythrantha mycobiont, on MEYE medium. They obtained a yield of 0·67% w/w of colonies, a value quite near that obtained during the present investigation.
In this study we report for the first time the production of emodin by a strain of an aposymbiotic mycobiont of C. erythrantha, which was obtained with very high yields when grown on MY10 and BMRM (7·82% and 11·70% respectively). We also report for the first time the production of 7-chloroemodin by the mycobiont of C. erythrantha grown on BMYE, MY10 and BMRM, with very high yields when grown on the two last media (7·48% and 10·80% respectively). The yields obtained for the mycobiont of C. erythrantha on MY10 and BMRM are the highest reported for mycobionts of the genus Caloplaca. They are also some of the highest yield values obtained for secondary metabolites by aposymbiotic mycobionts in culture, and comparable to the yield for usnic acid of 7·59% obtained by Hamada et al. (Reference Hamada, Miyagawa, Miyawaki and Masakane1996) with the cultured aposymbiotic mycobiont of Lecanora pulverulenta on MY10.
The present results show that the type and concentration of the carbon source has an impact on secondary metabolism. Mannitol is more efficient than sucrose in enhancing the production of emodin and 7-chloroemodin when used in a similar molarity, at least for the strain of Caloplaca studied here. Such an inducible effect of mannitol on the synthesis of anthraquinones in mycobionts was formerly reported by Brunauer et al. (Reference Brunauer, Hager, Grube, Türk and Stocker-Wörgötter2007) for the production of parietin and biosynthetically related compounds, by aposymbiotic mycobionts of Xanthoria elegans.
Our present results also show that the media MY10 and BMRM have a great capacity to promote secondary metabolism in C. erythrantha, and they probably would behave in the same way with other strains, particularly in relation to anthraquinone synthesis. These media should be assayed in cases where high yields of secondary metabolites are desired, as in cultures to produce pure substances for bioassays or to grow colonies in PKS gene studies when a very active secondary metabolism is required (Brunauer et al. Reference Brunauer, Muggia, Stocker-Wörgötter and Grube2009). Heterologous expression of PKS genes and successive quantities of biologically active polyketides are becoming common strategies to obtain useful molecules. A recent approach was undertaken to sequence a cDNA of the PKS for anthraquinone production. The lichen, and especially the cultured lichen mycobiont of Xanthoria elegans, were found to be excellent model organisms because of rapid and high production of anthraquinones. Axenic cultures with high production of secondary compounds are a clean source for isolating large amounts of mRNA to be used for synthesis of cDNA, and diverse mycobiont cultures will certainly be used in similar studies in future (Elix & Stocker-Wörgötter Reference Elix, Stocker-Wörgotter and Nash2008).
The authors thank the National Research Council of Argentina (CONICET) and the University of Buenos Aires for financial support. A. T. Fazio thanks the University of Buenos Aires for a doctoral fellowship. M.T. Adler and M.S. Maier are Research Members of CONICET.