INTRODUCTION
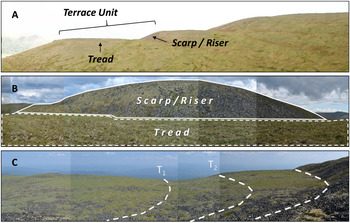
Cryoplanation terraces (CTs) are large bedrock features often likened to giant staircases carved into ridges and hillslopes in present and former periglacial (cold but unglaciated) environments. CTs consist of alternating gently sloping treads (generally < 12°) and steep (> 20°) rubble-covered, or exposed bedrock scarps, also referred to as risers. The term scarp is used here in a purely descriptive or morphological, and not necessarily tectonic sense (Bloom, Reference Bloom2004, p. 67). A terrace unit consists of a tread and the scarp immediately upslope (Brunnschweiler, Reference Brunnschweiler1965). Sequences of terrace units can culminate in extensive summit flats. Terrace treads range from tens to hundreds of meters in length, and sequences of terraces can span several kilometers of ridgeline (Figs. 1A, B) (e.g., Demek, Reference Demek1969; Reger and Péwé, Reference Reger and Péwé1976; Priestnitz, Reference Prieznitz and Clark1988; Nelson and Nyland, Reference Nelson and Nyland2017; Ballantyne, Reference Ballantyne2018, pp. 220–222). Although these impressive features have been readily identified and discussed for more than a century in the literature on periglacial geomorphology, their origins and development, and therefore Quaternary significance, remain speculative.
(A) Example of cryoplanation terrace sequence near Eagle Summit, Alaska (facing north) culminating in a summit flat, with tread components and terrace unit (approx. 200 m in length) labeled. (B) Photo facing east from outer edge of a terrace tread in the sequence pictured above looking toward higher scarp (approx. 50 m in height), and (C) oblique view toward northeast of terrace tread (approx. 150 m) on Mt. Fairplay with current and hypothesized previous scarp-tread junctions (dashed lines).

Three distinct hypotheses for CT formation are supported in contemporary literature: (1) CTs are the result of geologic structure (e.g., Waters, Reference Waters1962; Hall and André, Reference Hall and André2010; French, Reference French2016); (2) CTs are the result of a distinctively periglacial set of weathering and transportation processes associated with snowbanks circumscribed by the term nivation (e.g., Demek, Reference Demek1969; Reger and Péwé, Reference Reger and Péwé1976; Nelson, Reference Nelson1989, Reference Nelson1998; Nelson and Nyland, Reference Nelson and Nyland2017; and (3) CT formation can be dependent on the presence of permafrost, and nivation can be a secondary process suite operating on these features (Matthews et al., Reference Matthews, Wilson, Winkler, Mourne, Hill, Owen and Geary2019).
Some of the best developed and most impressive CTs are found in Beringia—the former land bridge exposed during Quaternary cold intervals that connected Eurasia with North America between the Lena River in Siberia and the Mackenzie River in Canada (Demek, Reference Demek1969; Reger, Reference Reger1975; Nelson, Reference Nelson1989; Nelson and Nyland, Reference Nelson and Nyland2017). The first documented CTs in eastern Beringia are in reports from exploratory mapping of central Alaska by the U.S. Geological Survey during the early twentieth century (Moffit, Reference Moffit1905; Prindle, Reference Prindle1905; Cairnes, Reference Cairnes1912; Eakin, Reference Eakin1916; Mertie, Reference Mertie1937). It was apparent to these investigators, even during the height of Davisian geomorphic theory, that these features appeared to contradict Davis’ “normal cycle of erosion” (Davis, Reference Davis1909). For example, Moffit (Reference Moffit1905, p. 44) remarked on the angularity of clasts on the high terraces and how these were more likely the result of frost rather than fluvial action. Similarly, Prindle (Reference Prindle1905, p. 20) noted that neither lithology nor structure appeared to control CT elevation or orientation. Cairnes (Reference Cairnes1912) was the first to hypothesize that CTs are climatically controlled and formed through scarp retreat driven by nivation processes. Although he did not use the term nivation, Prindle (Reference Prindle1913) posited a hypothesis for CT formation that deviates little from the contemporary explanation cited above.
Nivation encompasses the suite of erosion processes associated with snowbanks that last well into warm months (Matthes, Reference Matthes1900). Although the processes involved differ significantly from those initially proposed by Matthes, abundant evidence exists that late-lying snowbanks provide moisture and thermal conditions that intensify the mechanical and chemical weathering of nearby materials (e.g., Thorn, Reference Thorn1976; Ballantyne et al., Reference Ballantyne, Black and Finlay1989; Berrisford, Reference Berrisford1991; Hall, Reference Hall1993; Thorn and Hall, Reference Thorn and Hall2002). Weathered materials are transported away from the scarp base via soil creep, solifluction, piping, rill wash, and sheetwash, fueled by meltwater from the late-lying snowbank (Thorn and Hall, Reference Thorn and Hall1980, Reference Thorn and Hall2002). Continued scarp recession by nivation forms a hollow and eventually a terrace (Fig. 1C).
Nivation has continued to receive support in the literature as the dominant process suite involved in CT formation through scarp retreat (Demek, Reference Demek1969; Reger and Péwé, Reference Reger and Péwé1976; Nelson and Nyland, Reference Nelson and Nyland2017). Evidence in support of the nivation hypothesis includes terraces that cross-cut structure (Demek, Reference Demek1969; Reger, Reference Reger1975), sedimentological and morphological patterns (Reger, Reference Reger1975; Queen, Reference Queen2018), statistically significant poleward orientation of CTs (Nelson, Reference Nelson1998), and subcontinental-scale elevation trends tracking those of glacial cirques—landforms understood to be controlled by cold climate conditions. Nelson (Reference Nelson1989, Reference Nelson1998) and Nelson and Nyland (Reference Nelson and Nyland2017) argued that the correspondence between the orientation and elevation trends of CTs and glacial cirques is rooted in topo- and macroclimatic controls over the mass balance of snow. Matthews et al. (Reference Matthews, Wilson, Winkler, Mourne, Hill, Owen and Geary2019) de-emphasized the importance of snow in CT formation in their study area, stressing the role of permafrost. Ice-rich permafrost can provide an impermeable layer that retains groundwater for macrogelivation at scarp bases and transportation processes across treads.
Recent work by Matthews et al. (Reference Matthews, Wilson, Winkler, Mourne, Hill, Owen and Geary2019) expressed the view that “cryoplanation should be considered as essentially distinct from nivation.” Most literature reviews on this subject show, however, that most researchers have regarded these terms as distinct, and that CTs are the product of nivation processes (cf. Hall, Reference Hall1998). This distinction is shared with other types of planation surfaces, i.e., they are the end products of erosional processes (Brown, Reference Brown and Fairbridge1968). The term cryoplanation is not, therefore, a process term, but rather a morphological reference to upland terrain made level by erosion under periglacial conditions. We advocate following Thorn's (Reference Thorn1983) suggestion to separate morphological and genetic inferences in the assignment of names to geomorphic features. In this work, nivation is a shorthand process term encompassing the suite of processes that lead to intensified weathering and transport in the vicinity of late-lying snowbanks, leading to the formation of CTs, a type of planation surface.
Repeated calls have been made for age determinations and quantification of scarp retreat rates to complement existing evidence for climatically-driven hypotheses of CT formation (e.g., Demek, Reference Demek1969; Prieznitz, Reference Prieznitz and Clark1988; Thorn and Hall, Reference Thorn and Hall2002) by assessing whether CT treads are time-transgressive surfaces developing, like glacial cirques, in phase with cold climatic periods (Nelson and Nyland, Reference Nelson and Nyland2017). This paper addresses such questions about CTs in eastern Beringia using 10Be and 36Cl terrestrial cosmogenic nuclide (TCN) exposure dating techniques.
STUDY AREAS
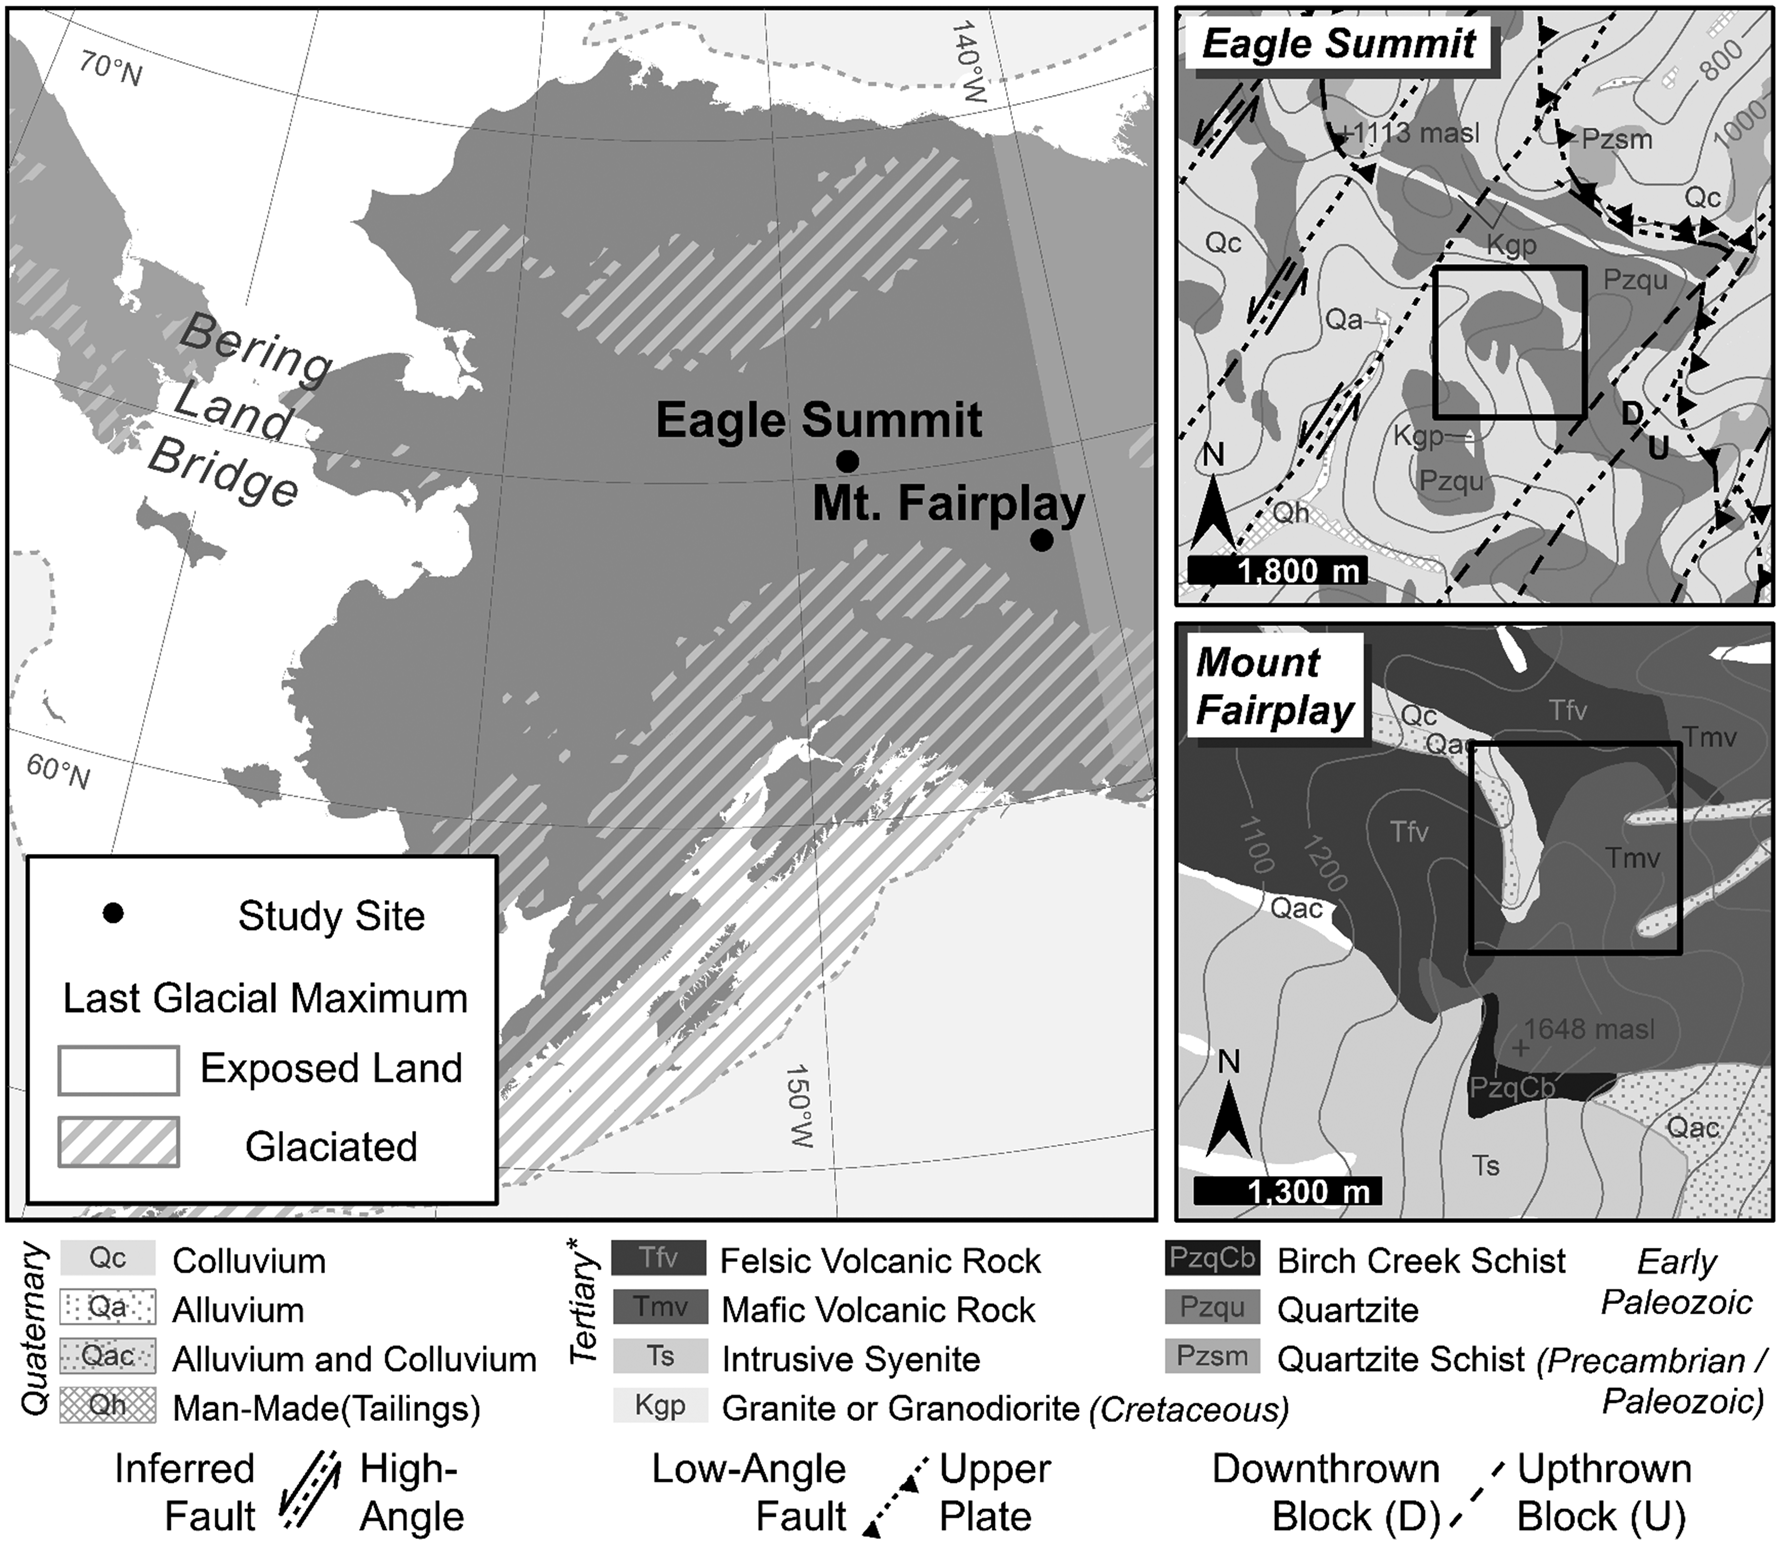
Two well-developed, now relict, sequences of CTs, near Eagle Summit (65°27’53”N, 145°21’40”W) and on Mt. Fairplay (63°40’51”N, 142°12’39”W), were selected from an inventory of nearly 700 cryoplanation landforms in central and western Alaska (Reger, Reference Reger1975) based on road access and previous studies conducted in these areas. Both study areas are located in the dissected, hilly to mountainous Yukon-Tanana Upland (YTU) physiographic province bounded by the Yukon River to the north and the Tanana River to the south (Wahrhaftig, Reference Wahrhaftig1965; Foster, Reference Foster1992). The YTU remained largely unglaciated throughout the Pleistocene, with only isolated cirque and valley glaciers developing during the Wisconsinan glaciation, locally referred to as the Eagle (early/middle Wisconsinan) and Salcha (late Wisconsinan) glacial episodes (Weber, Reference Weber, Hamilton, Reed and Thorson1986; Briner et al., Reference Briner, Kaufman, Manley, Finkel and Caffee2005; Kaufman and Manley, Reference Kaufman, Manley, Ehlers and Gibbard2004; Kaufman et al., Reference Kaufman, Young, Briner, Manley, Ehlers, Gibbard and Hughes2011) (Fig. 2). None of these isolated glaciers covered either study area (Péwé et al. Reference Péwé, Burbank and Mayo1967). With minimal glacial reworking, YTU surface deposits are primarily undifferentiated colluvial, aeolian, or fluvial in origin (Péwé, Reference Péwé1975, p. 3). The majority of the YTU is contained in the Yukon-Tanana Terrane, bounded by the Tanana and Northway-Tananacross lowlands to the south, the Yukon Flats to the northwest, and the Tintina fault zone to the northeast (Foster et al., Reference Foster, Weber, Forbes, Brabb and Pitcher1973; Mortensen, Reference Mortensen1992; Hansen and Dusel-Bacon, Reference Hansen and Dusel-Bacon1998).
Study area locations in eastern Beringia (left) and geologic context of Eagle Summit (Wiltse et al., Reference Wiltse, Reger, Newberry, Pessel, Pinney, Robinson and Solie1995a) and Mt. Fairplay (Foster, Reference Foster1967) areas (right). Terraces studied are indicated by solid black rectangles in panels at right and correspond to map extents in Figure 3.

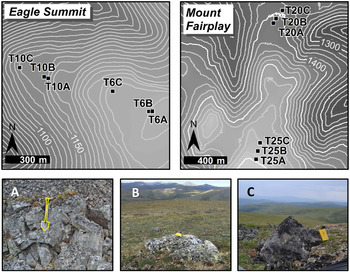
Maps show sampling strategy on highest and lowest terraces near Eagle Summit and on Mt. Fairplay. Map areas indicated on Figure 2 geologic maps. Terrace numbers taken from Reger's (Reference Reger1975) inventory and letters indicate sample positions. Examples of boulders sampled at (A) the bedrock scarp (shovel outlined for scale), (B) mid-tread, and (C) tread toe (field books for scale).

Near Eagle Summit is a sequence of four CTs between 1140 and 1250 m asl eroded into an early-Paleozoic quartzite ridge facing WNW (Reger, Reference Reger1975; Wiltse et al., Reference Wiltse, Reger, Newberry, Pessel, Pinney, Robinson and Solie1995a; Reference Wiltse, Reger, Newberry, Pessel, Pinney, Robinson and Solie1995b) (Fig. 2). The treads of these terraces crosscut the foliated micaceous quartzite and quartz-mica to chlorite schist bedrock (Reger, Reference Reger1975, p. 79; Wiltse et al., Reference Wiltse, Reger, Newberry, Pessel, Pinney, Robinson and Solie1995b). Additionally, the northerly orientation of this terrace sequence is at approximately a right angle to two parallel thrusts, or low-angle faults trending NNW-SSE (Wiltse et al., Reference Wiltse, Reger, Newberry, Pessel, Pinney, Robinson and Solie1995a).
Mt. Fairplay consists primarily of flows of Tertiary (i.e., Neogene/Paleogene) mafic and felsic igneous materials. A sequence of five well-developed CTs lies between 1360 and 1580 m asl near this summit (Fig. 2) (Reger, Reference Reger1975, p. 77). Farther north, on Taylor Mountain, structure may have played a greater role in the location and development of terraces (Foster, Reference Foster1967, Reference Foster1992), owing to horizontal foliation in the Birch Creek Schist and nearly horizontal welded igneous tuffs and flows. On Mt. Fairplay, however, structure is more complex, with tuffs dipping about 40° to the ESE, and joints trending N–S and dipping to the E at 30–40°. Also, within the sequence of terraces studied is a large scarp between what Reger (Reference Reger1975) designated T21 and T23. At 100 m in height this scarp is significantly larger than other CT scarps in the area (which range from 10 to 30 m). The base of the scarp trends roughly NW–SE (Fig. 3). There are no mapped faults on Mt. Fairplay that could explain this scarp. The entire region is deformed, and the beds and igneous bodies are folded and faulted. According to Foster (Reference Foster1967), the main structures in the region trend NE–SW and NW–SE although both structures are poorly expressed in the Mt. Fairplay area, probably due to the igneous intrusions and volcanic rocks. Despite efforts to identify a structure directly related to this anomalously large scarp, it was not possible to confirm one. A detailed morphometric analysis of Mt. Fairplay using the 2 m resolution ArcticDEM (Porter, et al., Reference Porter, Morin, Howat, Noh, Bates, Peterman and Keesey2018) revealed evidence of well-defined, steep landslide scarps. Although it is not possible to definitively associate this anomalously high scarp with landslide processes, it is possible that nivation modified a preexisting structural morphology, as in the model for CT formation proposed by Nyland and Nelson (Reference Nyland and Nelson2019).
METHODOLOGY
TCN geochronology methods are applied to estimate how long a surface or rock at the Earth's surface has been exposed to cosmic rays (e.g., Lal, Reference Lal1991; Goose and Philips, Reference Gosse and Phillips2001). Rare cosmogenic nuclides like 10Be, 26Al, or 36Cl are produced in the uppermost few meters below the surface, as cosmic rays bombard the rock material, interacting with the atomic structures in the mineral lattice. The known production rates and the measurements of the concentration of TCN allows for the estimation of exposure length or denudation at the surface (Frankel et al., Reference Frankel, Finkel and Owen2010; Darville, Reference Darvill, Clark and Nield2013; Schaetzl and Thompson, Reference Schaetzl and Thompson2015, p. 598). Some advantages of using TCN geochronology methods are that the methods can be applied broadly to preserved erosional as well as aggradational features, in a variety of lithologies, and across timescales of thousands to a few million years.
For this study, 12 boulders were sampled across four terraces at two locations. The same spatial sampling scheme was employed to collect three samples across both the highest and lowest elevation terraces at the two study sites. Samples were collected at (A) the base of the scarp; (B) the edge of the rubble farther out on the tread; and (C) at the outer (distal) edge of the tread (Fig. 3). Samples are referred to by the terrace numbers (T6, T10, T20, and T25) assigned by Reger (Reference Reger1975), and by position on the tread (A–C). When selecting boulders in these three tread positions, preference was given to larger clasts, or bedrock, with minimal lichen cover, as these are less likely to have been moved by other geomorphic processes or require additional shielding calculations (Fig. 3). A sledgehammer and chisel were used to collect at least 500 g of rock sample from the upper 5 cm of exposed boulder surface. The location of each sample was recorded using a handheld GPS, and angular elevations to the horizon at cardinal and intercardinal directions were taken using a clinometer for topographic shielding calculation. Boulder lithology, size, and shape were measured and recorded, and photos were also taken at sampling sites.
To target nuclides, physical and chemical preparation of the 10Be and 36Cl samples were conducted at the University of Cincinnati Terrestrial Cosmogenic Nuclide Laboratories. Accelerator mass spectrometry (AMS) measurements were performed at the Purdue University PRIME Lab. All rock samples were first crushed and sieved. Then, the chemical preparation was performed on the 250–500 μm size fraction. For 10Be, quartz was isolated from quartzite samples in accordance with the methodology developed by Kohl and Nishiizumi (Reference Kohl and Nishiizumi1992). Through a chemical procedure, Be(OH)2 was precipitated for each quartzite sample, and then combusted to obtain BeO that was loaded into steel cathodes for AMS measurements. For samples poor in quartz, such as the ones from Mount Fairplay (mafic volcanic rock), the procedure by Stone et al. (Reference Stone, Allan, Fifield and Cresswell1996) was followed for bulk rock preparation (without mineral separation) to target 36Cl. Chlorine was isolated through precipitation of silver chloride, then loaded into copper cathodes for AMS analysis, specifically of 36Cl/35Cl ratios. Geochemistry, necessary for age calculation, for samples treated as bulk rock was performed by Activation Laboratories Limited in Ancaster, Ontario. Additional details of lab analysis can be found in the supplemental materials.
RESULTS
Two primary assumptions are associated with TCN analyses: (1) that the rock was not previously exposed to cosmogenic rays, and therefore contains a cosmogenic nuclide signature free from inheritance; and (2) that erosion has not continued to occur, or is negligible, after subaerial exposure of the rock (e.g., Gosse and Phillips, Reference Gosse and Phillips2001; Cockburn and Summerfield, Reference Cockburn and Summerfield2004; Darville, Reference Darvill, Clark and Nield2013, Schaetzl and Thompson, Reference Schaetzl and Thompson2015, p. 598). The calculated ages presented here are therefore interpreted as minimum-limiting exposure dates (Ivy-Ochs et al., Reference Ivy–Ochs, Kerschner and Schlüchter2007; Heyman et al., Reference Heyman, Stroeven, Harbor and Caffee2011).
Table 1 provides a summary of sample details and calculated exposure ages from the two terraces near Eagle Summit. The CRONUS-Earth 36Cl Exposure Age Calculator Version 2.0 online calculator (Marrero et al., Reference Marrero, Phillips, Borchers, Lifton, Aumer and Balco2016) was used to calculate 10Be ages based on the Lal (Reference Lal1991)/Stone (Reference Stone2000) time-dependent production rate model using a global calibration dataset (Balco et al., Reference Balco, Stone, Lifton and Dunai2008). The CREp online calculator (Martin et al., Reference Martin, Blard, Balco, Lavé, Delunel, Lifton and Laurent2017) was used to generate 10Be ages based on the Lifton-Sato-Dunai time-dependent model (Lifton et al, Reference Lifton, Sato and Dunai2014). The CREp calculator was used for 10Be calculations because it is connected to the informal cosmogenic nuclide exposure age database (ICE-D) and updated geomatics databases. This tool also allows for comparison of different scaling models. A few of the Lifton-Sato-Dunai modeled ages are older, but due to the minimal differences between the calculated ages using the two models, and considering results as minimum exposure ages, subsequent analysis refers to the Lal (Reference Lal1991)/Stone (Reference Stone2000) modeled ages. All ages from terraces 6 and 10 are from the Wisconsinan glacial episode. Two dates are from the last glacial maximum during the late Wisconsinan or the local Salcha glacial episode (Weber, Reference Weber, Hamilton, Reed and Thorson1986). The other four ages from this terrace sequence fall within the Eagle, or early/middle Wisconsinan glacial episode.
Sample details and 10Be ages from CTs near Eagle Summit assuming no denudation of the boulder surfaces.

1The tops of all samples were exposed at the surface.
2Topographic shielding factor was calculated online using CHRONUS tool available at https://hess.ess.washington.edu/ .
3A density of 2.7 g cm-3 was used based on the granitic composition of the surface samples.
4Isotope ratios were normalized to 10Be standards prepared by Nishiizumi et al. (Reference Nishiizumi, Imamura, Caffee, Southon, Finkel and Mcaninch2007) with a value of 2.85 x 10¹² and using a 10Be half-life of 1.36 x 10⁶ years.
5Uncertainties are reported at the 1σ confidence level.
6A mean blank value of 1,1824 ± 0,54 x 10⁻¹⁵ 10Be was used to correct for background, according with PRIME lab measurements.
7Propogated uncertainties include error in the blank, carrier mass (1%), and counting statistics.
8Propogated error in the model ages include a 6% uncertainty in the production rate of 10Be and a 4% uncertainty in the 10Be decay constant.
9Lal and Stone time-dependent (LM) scaling model ± total uncertainty calculated on CHRONUS v.3 online calculator.
10Lifton-Sato-Dunai time-dependent (LSD) scaling model ± total uncertainty calculated on CREp online calculator.
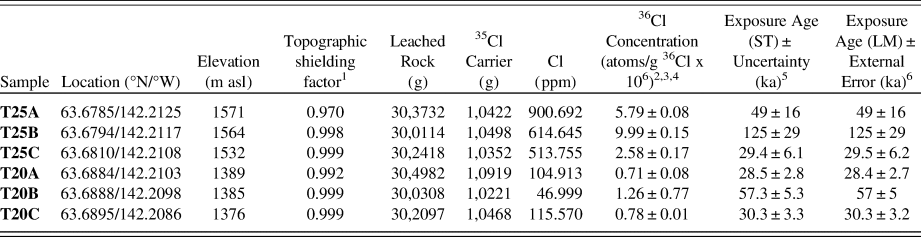
Table 2 summarizes sample and age details for the two terraces studied on Mt. Fairplay. CRONUS-Earth Version 2.0 was used to calculate 36Cl ages. Both ages from the Lal (Reference Lal1991)/Stone (Reference Stone2000) time-dependent and independent scaling models are reported. The similarity of these ages indicates either is representative. Subsequent analysis, however, refers to ages calculated using the time-dependent scaling model as these dates are synchronous with cold-climate periods. Five of the six 36Cl ages are from the Eagle or early/middle Wisconsinan glacial episode while one date is significantly older, from the Mt. Harper or Illinoisan glacial episode.
Sample details and 36Cl ages from CTs on Mt. Fairplay assuming no denudation of top 5 cm of boulders sampled.

1Topographic shielding factor was calculated online using CHRONUS tool available at https://hess.ess.washington.edu/.
2Uncertainties are reported at the 1σ confidence level.
3A mean blank value of 87.364 ± 6.744 of ratio 35Cl/37Cl was used to correct for background, according with PRIME lab measurements.
4Propogated uncertainties include error in the blank, carrier mass (1%), and counting statistics.
5Lal and Stone time independent (ST) scaling model ± total uncertainty calculated on CHRONUS v.2 online calculator.
6Lal and Stone time-dependent (LM) scaling model ± total uncertainty calculated on CHRONUS v.2 online calculator.
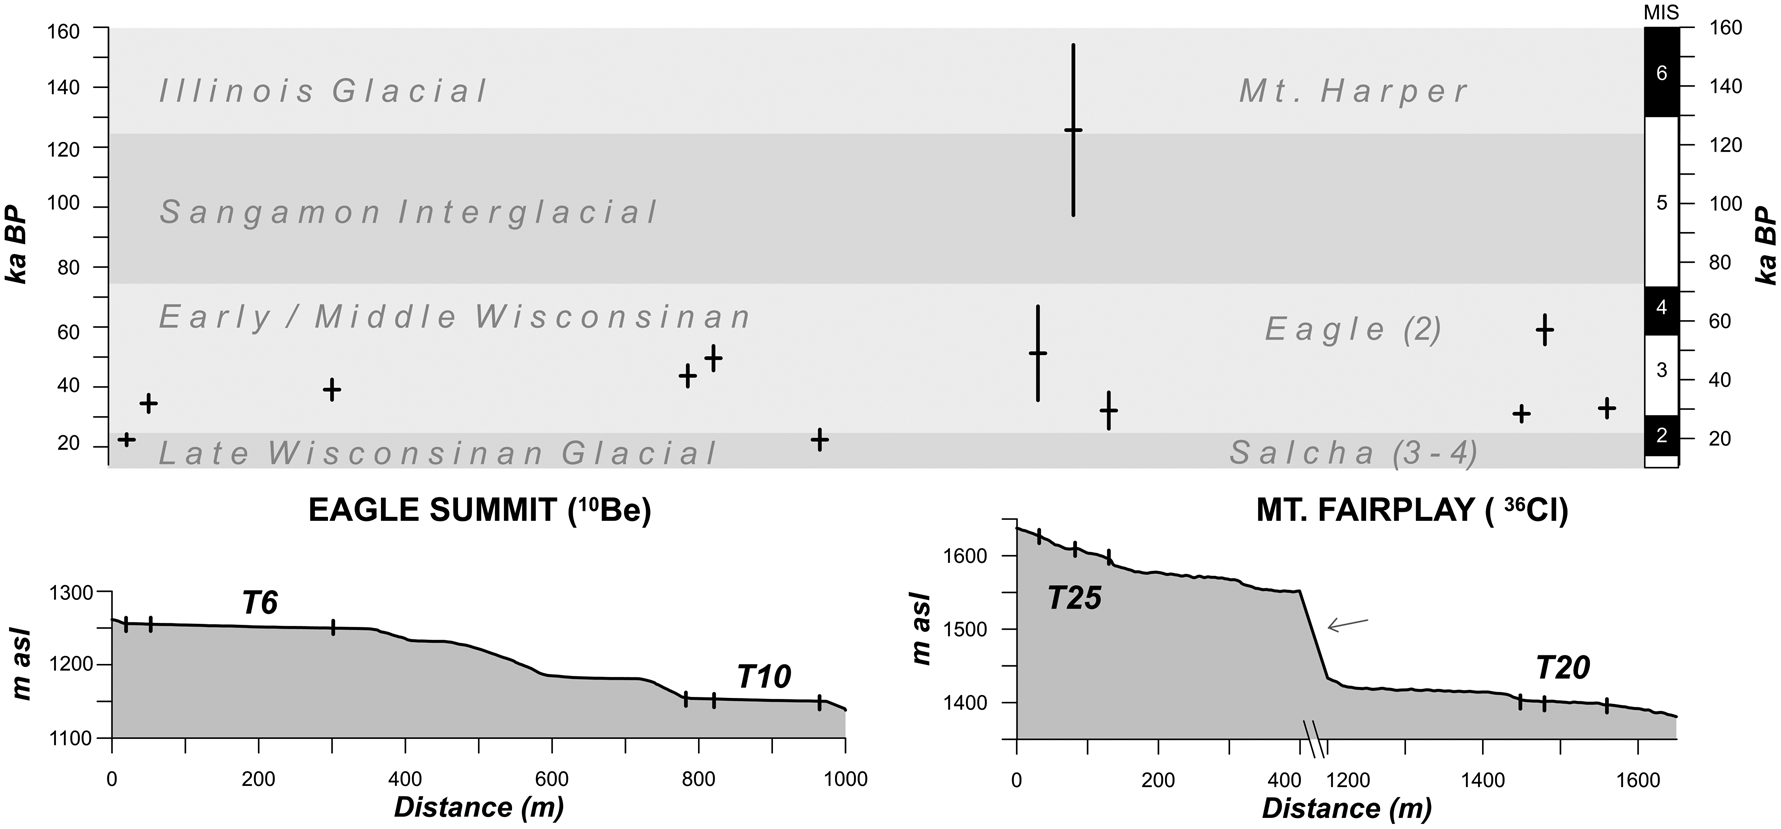
Figure 4 shows the ages based on the Lal (Reference Lal1991)/Stone (Reference Stone2000) time-dependent scaling models reported in Tables 1 and 2, expressed graphically for convenient comparison and organized spatially according to where they were collected along the topographic profiles at each site. On all four terraces, exposure ages from the base of the scarp are younger than the next boulder part-way across the tread, indicating time-transgressive development through scarp retreat. The three ages from Terrace 6 near Eagle Summit are progressively older with distance away from the scarp of that terrace unit. This age distribution is closest to the original hypothesis that these treads are diachronous surfaces formed from the continuous retreat of scarps, and are synchronous with glacial episodes.
Calculated 10Be ages for boulder exposure at Eagle Summit (left) and 36Cl ages for Mt. Fairplay (right) shown according to position along topographic profiles of terrace sequences at both sites. Parentheticals after local glaciation names refer to number of advances during this time (Weber, Reference Weber, Hamilton, Reed and Thorson1986). Marine Isotope Stages (MIS) after Lisiecki and Raymo (Reference Lisiecki and Raymo2005). Arrow indicates position of anomalous scarp discussed in the study area description.

In contrast, ages from the toe (boulder C) of terraces 10 and 25 are significantly younger than ages from near the scarp of the same terrace units. In the case of Terrace 20, the toe and the scarp ages are similar. We interpret these boulders as likely being too close to the slope shoulder and subject to ongoing erosion, and therefore not representative of long-term tread development. Rather, these younger exposure ages might be related to continued erosion and gravity-driven processes operating on the scarp of the next lower terrace unit. Boulders near the scarp base (A and B) on all four terraces are nonetheless indicative of time-transgressive surface development through scarp retreat.
DISCUSSION
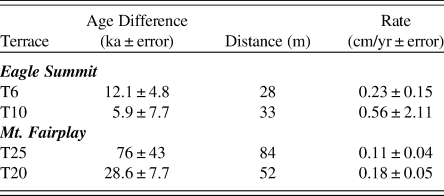
Estimates of scarp retreat rates from terraces studied in this work are shown in Table 3. These rates are calculated between boulders A and B (approaching terrace unit scarps) on all terraces, based on the difference in boulder distance to the scarp as measured on site and on maximum and minimum differences in exposure age, accounting for external uncertainty associated with each age. Calculated rates appear high but are comparable to those reported in studies of active nivation including, Kňažková et al. (Reference Kňažková, Nývlt and Hrbáček2018) who reported scarp retreat under nivation processes on James Ross Island, Antarctica, of 0.77 ± 0.12 mm/yr (0.077 ± 0.012 cm/yr), and Matthews et al. (Reference Matthews, Wilson, Winkler, Mourne, Hill, Owen and Geary2019) who reported maximum rates of ~0.1 mm/yr from Svartkampan, Jotunheimen, Norway.
Calculated scarp retreat, or horizontal erosion rates, between boulders A and B for the four terraces studied at Mt. Fairplay and Eagle Summit. Distances between samples and their 10Be and 36Cl surface exposure age range, assuming the associated uncertainty, are presented.

Indirect evidence also supports the nivation hypothesis for CT formation across eastern Beringia (Reger, Reference Reger1975; Reger and Péwé Reference Reger and Péwé1976; Nelson, Reference Nelson1989, Reference Nelson1998; Nelson and Nyland, Reference Nelson and Nyland2017; Nyland and Nelson Reference Nyland and Nelson2019). Owing to the similarity between the rates reported here and those from process-oriented nivation studies elsewhere, as well as ages synchronous with local glacial advances, we conclude that the nivation process suite is likely to have produced the CTs studied in this work during Quaternary cold intervals, thereby exposing these elevated boulders. The results presented here are also consistent with previous work by Nyland and Nelson (Reference Nyland and Nelson2019) that proposed a refined model for CT formation in eastern Beringia based on nivation after examining spatial trends in a variety of relative weathering indices across all terrace treads present at these two study sites.
Apparent trends in elevation and timing of erosion within the terrace sequences near Eagle Summit and on Mt. Fairplay are inconsistent, however. Previous work has found statistical significance between sub-continental scale spatial trends in CT elevations and Wisconsinan-age snowlines (Nelson, Reference Nelson1989; Nelson and Nyland, Reference Nelson and Nyland2017). Péwé and Reger (Reference Péwé and Reger1972) mapped Wisconsinan-age snowlines based on the elevations of the lowest glacial cirques across Alaska. Nelson and Nyland (Reference Nelson and Nyland2017) found that trends in median CT elevations closely track this paleo-snowline elevation gradient, which is dependent on latitude and continentality.
Erosion near the scarps in the sequence near Eagle Summit occurred mainly during the Eagle glacial episode (corresponding to MIS 2) from ~55 to 48 ka on the lowest terrace (T10, ~1150 m asl) and during the Salcha glacial episode from ~32 to 22 ka on the highest terrace (T6, ~1250 m asl). This could indicate a rising snowline through the Wisconsinan glaciation. Meanwhile, on Mt. Fairplay, on the highest terrace (T25, ~1600 m asl), the scarp was eroding from the Mt. Harper glaciation until the Eagle glacial episode, or between ~130 to 48 ka. This period includes an interglacial episode when periglacial erosion slowed. The lowest terrace scarp (T20, ~1400 m asl) was eroding from the Eagle to the Salcha glacial episode, or between ~58 and 29 ka, indicating a possible lowering of the snowline from the end of the Illinoisan to the late Wisconsinan. More age determinations that can be treated with statistical rigor are required to better understand the timing of CT development on these ridges relative to local snowline altitudes.
CONCLUSIONS
The first geochronology results from CT surfaces in the Alaskan YTU are presented here. TCN surface exposure ages from CTs near Eagle Summit (six 10Be exposure ages) and on Mt. Fairplay (six 36Cl exposure ages) provide the quantification called for by many to evaluate climate-based hypotheses for CT formation (e.g., Demek, Reference Demek1969; Prieznitz, Reference Prieznitz and Clark1988; Thorn and Hall, Reference Thorn and Hall2002; Nelson and Nyland, Reference Nelson and Nyland2017). These ages provide new support for climatic controls on CT development from Beringia, an area regarded as containing the best developed, although now dormant or relict, CTs (Demek, Reference Demek1969; Reger, Reference Reger1975; Nelson, Reference Nelson1989; Nelson and Nyland, Reference Nelson and Nyland2017). Evidence for climatic control of CT formation in the YTU include: (1) time-transgressive tread development, particularly on the inner tread, with estimated scarp retreat rates ranging from 0.11 to 0.56 cm/yr; (2) the similarity of scarp retreat rates to those from studies in active nivation environments (Kňažková et al., Reference Kňažková, Nývlt and Hrbáček2018; Matthews et al., Reference Matthews, Wilson, Winkler, Mourne, Hill, Owen and Geary2019); and (3) erosion on CT treads coinciding with cold climatic intervals.
Data produced in this study reinforce previous work that found spatio-statistical indications of climatic controls on these landforms (e.g., Demek, Reference Demek1969; Reger, Reference Reger1975; Nelson, Reference Nelson1998; Nelson and Nyland, Reference Nelson and Nyland2017; Nyland and Nelson, Reference Nyland and Nelson2019). Before a generalized model for CT development in eastern Beringia can be fully realized, additional surface exposure ages will be necessary to clarify local elevation trends in terrace development. We concur with Matthews et al. (Reference Matthews, Wilson, Winkler, Mourne, Hill, Owen and Geary2019) that groundwater can be a critical factor in CT formation, through its role as an aquiclude, but more age determinations, along with process monitoring and quantitative modeling, will also help to elucidate the relative importance of permafrost in the nivation process suite.
A genetic model for CT development is becoming increasingly necessary for the acceptance of the ability of periglacial processes to limit topography regionally. Similar to the so-called glacial buzzsaw (e.g., Brozović et al., Reference Brozović, Burbank and Meigs1997), this has been referred to by some as a frost buzzsaw (Hales and Roering, Reference Hales and Roering2009; Hall and Kelman, Reference Hall and Kleman2014) and holds the potential to rejuvenate periglacial geomorphic studies, as well as a new means by which periglacial research can contribute more effectively to Quaternary science.
ACKNOWLEDGMENTS
This manuscript was improved through the critical comments of Dr. Richard D. Reger and an anonymous reviewer. We thank Nyland's dissertation guidance committee, Drs. Randall Schaetzl, Ashton Shortridge, David Lusch and Grahame Larson, as well as field assistants in Alaska, Clayton Queen and John Nyland. We also thank Dr. Lewis Owen and Sarah Hammer for their assistance in TCN samples preparation and use of the University of Cincinnati geochronology laboratories. This project was funded by U.S. National Science Foundation (NSF) award number GSS-1817665. Any opinions, findings, conclusions, or recommendations expressed in this study are those of the authors, and do not necessarily reflect the views of the NSF. Mention of specific product names does not constitute endorsement by NSF.
SUPPLEMENTARY MATERIAL
The supplementary material for this article can be found at https://doi.org/10.1017/qua.2020.25.