


1. Introduction
Global rotation tends to make turbulent flows two-dimensional (2-D) and invariant along the rotation axis. This result is often referred to as the Taylor–Proudman theorem, which states that slowly evolving large-scale rapidly rotating flows organise into Taylor columns, invariant along the rotation axis (the vertical axis thereafter). However, in most numerical and experimental studies of rapidly rotating turbulence, these large-scale columns coexist with erratic three-dimensional (3-D) small-scale motion (Bartello, Métais & Lesieur Reference Bartello, Métais and Lesieur1994; Yeung & Zhou Reference Yeung and Zhou1998; Smith & Waleffe Reference Smith and Waleffe1999; Chen et al. Reference Chen, Chen, Eyink and Holm2005; Morize & Moisy Reference Morize and Moisy2006; Staplehurst, Davidson & Dalziel Reference Staplehurst, Davidson and Dalziel2008; Thiele & Müller Reference Thiele and Müller2009; Moisy et al. Reference Moisy, Morize, Rabaud and Sommeria2011; Yarom, Vardi & Sharon Reference Yarom, Vardi and Sharon2013; Gallet et al. Reference Gallet, Campagne, Cortet and Moisy2014; Yokoyama & Takaoka Reference Yokoyama and Takaoka2017; Seshasayanan & Alexakis Reference Seshasayanan and Alexakis2018). Although the latter contain typically less kinetic energy than the large-scale columns, they need to be precisely characterised, because they are responsible for the efficient 3-D dissipation of kinetic energy (Campagne et al. Reference Campagne, Gallet, Moisy and Cortet2015). Indeed, at the theoretical level, the 3-D inertial waves have been shown to induce a forward wave turbulent cascade leading to ‘anomalous’ kinetic energy dissipation, i.e. a dissipated power independent of molecular viscosity (Galtier Reference Galtier2003; Bellet et al. Reference Bellet, Godeferd, Scott and Cambon2006). On the one hand, wave turbulence provides the right framework to address the decay of rotating turbulence initialised with inertial waves only. On the other hand, forced rotating turbulence in a finite domain generically exhibits intense Taylor columns when global rotation is sufficiently fast, which challenges a description in terms of inertial waves only (even when energy is input into wave modes only (see Brunet, Gallet & Cortet Reference Brunet, Gallet and Cortet2020; Le Reun et al. Reference Le Reun, Gallet, Favier and Le Bars2020)).
We focus on such forced rotating turbulence in statistically steady state. Restricting attention to a steady body force at scale  $L$, the goal is to characterise the turbulent flows arising at large Reynolds number
 $Re= U L / \nu$, where
 $U$ is the root-mean-square (r.m.s.) flow velocity and
 $\nu$ is the kinematic viscosity, and low Rossby number
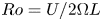 $Ro=U/2\Omega L$, where
 $\Omega$ denotes the global rotation rate. Two situations emerge depending on the spatial structure of the body force:
(i) When the body force is 3-D and directly drives some vertically dependent flow structures, it was shown by Alexakis (Reference Alexakis2015) that the statistically steady state never corresponds to a rapidly rotating turbulent flow with both
 $Re \gg 1$ and $Ro \ll 1$. The reason is that the r.m.s. velocity $U$ is an emergent quantity that cannot be specified at the outset of a numerical simulation. In (non-turbulent) flows characterised by $Re \sim 1$, the flow can achieve arbitrarily low $Ro$ provided the global rotation is fast enough. However, for turbulent flows with $Re \gg 1$, the r.m.s. velocity saturates at a value $U \sim \Omega L$, such that the Rossby number approaches unity.
(ii) By contrast, it is only when the body force is invariant along the rotation axis that one can reach simultaneously
$Re \gg 1$ and $Ro \ll 1$, a regime that we refer to as rapidly rotating turbulence.


For the latter situation, one can prove that the flow becomes exactly 2-D when the Rossby number is reduced at fixed (but arbitrarily large) Reynolds number and fixed aspect ratio of the fluid domain, using rigorous upper bound theory. This has important consequences for the energy dissipation rate of rapidly rotating turbulent flows: the anomalous dissipation associated with the forward energy cascade of 3-D turbulence is replaced by the laminar-like viscous dissipation of the domain-scale velocity structures that arise from the 2-D inverse energy cascade (Alexakis & Doering Reference Alexakis and Doering2006; van Bokhoven et al. Reference van Bokhoven, Clercx, van Heijst and Trieling2009; Campagne et al. Reference Campagne, Gallet, Moisy and Cortet2014; Deusebio et al. Reference Deusebio, Boffetta, Lindborg and Musacchio2014; Campagne et al. Reference Campagne, Machicoane, Gallet, Cortet and Moisy2016; Buzzicotti et al. Reference Buzzicotti, Aluie, Biferale and Linkmann2018; van Kan & Alexakis Reference van Kan and Alexakis2020; Pestana & Hickel Reference Pestana and Hickel2019). Mapping the energy dissipation rate of rotating turbulence in parameter space requires determination of the transition between exactly 2-D and partially 3-D rapidly rotating flows. Indeed, the mathematical results in Gallet (Reference Gallet2015) only provide a lower bound on the critical Rossby number  $Ro_c(Re)$ below which the flow becomes purely 2-D. The bound typically scales as
 $Re^{-6}$ with logarithmic corrections, i.e. we are only able to prove that the flow becomes exactly 2-D for extremely low Rossby numbers. However, one should keep in mind that this
 $Re^{-6}$ scaling behaviour is only a limitation of the bounding method, not a property of the true threshold
 $Ro_c(Re)$: we establish in the following that
 $Ro_c(Re)$ is in fact much greater than
 $Re^{-6}$, so that exact two-dimensionalisation takes place over a signification region of parameter space.
The very existence of a clear-cut transition between exactly 2-D and partially 3-D flows suggests an alternative approach to the study of rapidly rotating turbulence: instead of running costly 3-D direct numerical simulations (DNS) at large Reynolds number and ever lower Rossby number, in the present study we start from high  $Re$ and very low
 $Ro$, where we know the flow is 2-D, and investigate the appearance of three-dimensionality as we increase
 $Ro$. The goal is to determine the boundary
 $Ro_c(Re)$ in parameter space between exactly 2-D flows and partially 3-D ones through linear stability analysis. The challenge is that the base state of this linear stability analysis is a body-forced turbulent 2-D flow. Because of the inverse energy cascade, such flows typically achieve a statistically steady state after a long transient, the duration of which scales with the viscous time scale
 $L^2/\nu$. For a given Reynolds number
 $Re\gg 1$, one typically needs to integrate the 2-D equations for a number
 $Re$ of large-scale eddy turnover times. Once the statistically steady 2-D base state is reached, thousands of additional turnover times are needed to correctly sample the growth rate of the infinitesimal 3-D perturbations and conclude on the stability of the flow. We leverage the capabilities of modern graphics processing units (GPUs) to address this challenge: the linear stability problem for the 3-D perturbations is effectively 2-D and fits on the memory of a single GPU, which outperforms central processing units (CPUs) for the rapid computation of fast Fourier transforms. This enables us to investigate the 2-D to 3-D transition up to
 $Re=10^5$, one to two orders of magnitude above the typical values reported in experimental and fully 3-D numerical studies.
2. Theoretical set-up
We consider the flow of a Newtonian fluid inside a parallelepiped domain  $(x,y,z) \in [0,L]\times [0,L]\times [0,H]$, in a frame rotating at a rate
 $\Omega >0$ around the vertical
 $z$ axis. We focus on periodic boundary conditions in all three directions, although the results apply equally to a fluid layer of height
 $H/2$ with stress-free boundary conditions at the top and bottom. The flow is driven by a vertically invariant body force
 ${\boldsymbol f}=f_0 \sin (8{\rm \pi} y/L){\boldsymbol e}_x$, where
 ${\boldsymbol e}_x$ denotes the unit vector along
 $x$, and the velocity field
 ${\boldsymbol u}(x,y,z,t)$ satisfies the rotating Navier–Stokes equation
 \begin{equation} \partial_t \boldsymbol{u} +(\boldsymbol{u} \boldsymbol{\cdot} \boldsymbol{\nabla}) \boldsymbol{u} + 2 \Omega \,{\boldsymbol e}_z \times \boldsymbol{u} = -\boldsymbol{\nabla} p + \nu {\rm \Delta} \boldsymbol{u} + {\boldsymbol f}, \end{equation}
together with the incompressibility constraint  $\boldsymbol {\nabla } \boldsymbol {\cdot } {\boldsymbol u}=0$. This equation admits some vertically invariant 2-D solutions,
 ${\boldsymbol u}_{\text{2-D}}(x,y,t)$, that satisfy the 2-D Navier–Stokes equation
 \begin{equation} \partial_t {\boldsymbol u}_{\text{2-D}} +({\boldsymbol u}_{\text{2-D}} \boldsymbol{\cdot} \boldsymbol{\nabla}) {\boldsymbol u}_{\text{2-D}} = -\boldsymbol{\nabla} P + \nu {\rm \Delta} {\boldsymbol u}_{\text{2-D}} + {\boldsymbol f}, \end{equation}
where the Coriolis force is absorbed by the pressure gradient. In a non-rotating system and at large Reynolds number, such 2-D solutions are unstable to 3-D perturbations and quickly evolve into fully 3-D turbulence.
However, rapid global rotation stabilises these 2-D solutions with respect to 3-D perturbations, even the turbulent ones: at large Reynolds number and very low Rossby number, the flow  ${\boldsymbol u}_{\text{2-D}}(x,y,t)$ evolves in a complicated and chaotic fashion, but it remains invariant in the vertical direction. Such exact two-dimensionalisation of the flow only holds up to a Reynolds-number-dependent and aspect-ratio-dependent critical Rossby number
 $Ro_c(Re,L/H)$ above which three-dimensionality spontaneously arises. To determine the precise threshold
 $Ro_c$, we consider the evolution of an infinitesimal 3-D perturbation to the 2-D turbulent base flow
 ${\boldsymbol u}_{\text{2-D}}(x,y,t)$. This 3-D perturbation satisfies the Navier–Stokes equation (2.1) linearised around
 ${\boldsymbol u}_{\text{2-D}}$. Because the latter is independent of
 $z$, the different vertical Fourier modes of the 3-D perturbation decouple at linear order. Without loss of generality, we can thus restrict attention to a 3-D perturbation consisting of a single vertical Fourier mode,
 $\hat {{\boldsymbol u}}_{\text{3-D}}(x,y,t)\,\textrm {e}^{\textrm {i} q z}$, where
 $\hat {{\boldsymbol u}}_{\text{3-D}}(x,y,t)$ is a complex-valued 3-D vector. The full velocity field is
 ${\boldsymbol u}(x,y,z,t)= {\boldsymbol u}_{\text{2-D}}(x,y,t)+\hat {{\boldsymbol u}}_{\text{3-D}}(x,y,t)\,\textrm {e}^{\textrm {i} q z}+ \text {c.c.}$, where c.c. denotes the complex conjugate of the second term. Upon linearising the vorticity equation around the 2-D base flow, we obtain the evolution equation for the vorticity of the 3-D perturbation,
 $\hat {\boldsymbol \omega }_{\text{3-D}} = ( {\boldsymbol {\nabla }}_{\perp } + \textrm {i} q {\boldsymbol e}_z ) \times \hat {{\boldsymbol u}}_{\text{3-D}}$:
 \begin{align} \partial_t \hat{\boldsymbol \omega}_{{\text{3-D}}} &= ( {\boldsymbol{\nabla}}_{\perp} + \textrm{i} q {\boldsymbol e}_z ) \times [ {\boldsymbol u}_{{\text{2-D}}} \times \hat{\boldsymbol \omega}_{{\text{3-D}}} +\hat{\boldsymbol u}_{{\text{3-D}}} \times ( {\omega}_{{\text{2-D}}} {\boldsymbol e}_z) ] \nonumber\\ &\quad + 2 \textrm{i} q \Omega \hat{\boldsymbol u}_{{\text{3-D}}} + \nu ({ \nabla} _{\perp}^2 - q^2 )\hat{\boldsymbol \omega}_{{\text{3-D}}}, \end{align}
where  ${\boldsymbol {\nabla }}_{\perp }=(\partial _x, \partial _y, 0)$ and
 $ \omega_{\text{2-D}} = ( {\boldsymbol{\nabla}}_{\perp} \times {{\boldsymbol{u}}}_{\text{2-D}} ) \cdot {\boldsymbol{e}}_z $.
Linear stability analysis thus boils down to an effectively 2-D fluid problem governed by (2.2) and (2.3). However, the aspect ratio of the 3-D domain remains a key control parameter, as it restricts the acceptable values of the vertical wavenumber  $q$ entering these 2-D equations. Anticipating the results presented in figure 2, we observe that
 $Ro_c$ is an increasing function of the vertical wavenumber
 $|q|$ throughout most of the parameter space. In other words, the most unstable mode corresponds to the gravest vertical wavenumber compatible with the vertical boundary conditions,
 $q=2{\rm \pi} /H$. Linear stability analysis for a low value of
 $qL$ thus yields the threshold Rossby number for a deep domain, while linear stability analysis for a large value of
 $qL$ yields the threshold Rossby number for a shallow domain, the dimensionless vertical wavenumber and the aspect ratio being related by
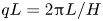 $qL=2 {\rm \pi}L/H$. In the following, we thus refer to the threshold Rossby number computed for low (respectively large) values of
 $qL$ as the onset of 3-D motion in deep (respectively shallow) fluid layers.
The stability analysis consists of two steps. First, we integrate (2.2) until the 2-D turbulent flow reaches a statistically steady state, which constitutes the base state of the linear stability analysis. This base flow is independent of the global rotation rate  $\Omega$, which does not appear in (2.2). Secondly, we introduce the 3-D perturbation by solving simultaneously (2.2) and (2.3).
We compute the r.m.s. velocity from the statistically steady 2-D base flow, 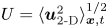 $U=\langle {\boldsymbol u}_{\text{2-D}}^2 \rangle _{{\boldsymbol x},t}^{1/2}$, where
 $\langle \,\cdot \, \rangle _{{\boldsymbol x},t}$ denotes an average over space and time. Even though
 $U$ is an emergent quantity – as opposed to a true control parameter of (2.2) – we build the Reynolds number
 $Re$ and Rossby number
 $Ro$ with this r.m.s. velocity to facilitate comparison with other experimental and numerical set-ups. The relation between
 $Re$ and the forcing-based Grashof number associated with (2.2) is provided in the appendix. The problem thus involves three dimensionless parameters: the Reynolds and Rossby numbers defined above, and the aspect ratio of the fluid domain through the dimensionless vertical wavenumber
 $qL$. A typical set of numerical runs consists in holding
 $Re$ and
 $qL$ fixed, and sweeping over the values of
 $Ro$ by changing the rotation rate
 $\Omega$. The corresponding time series of the kinetic energy of the 3-D perturbation,
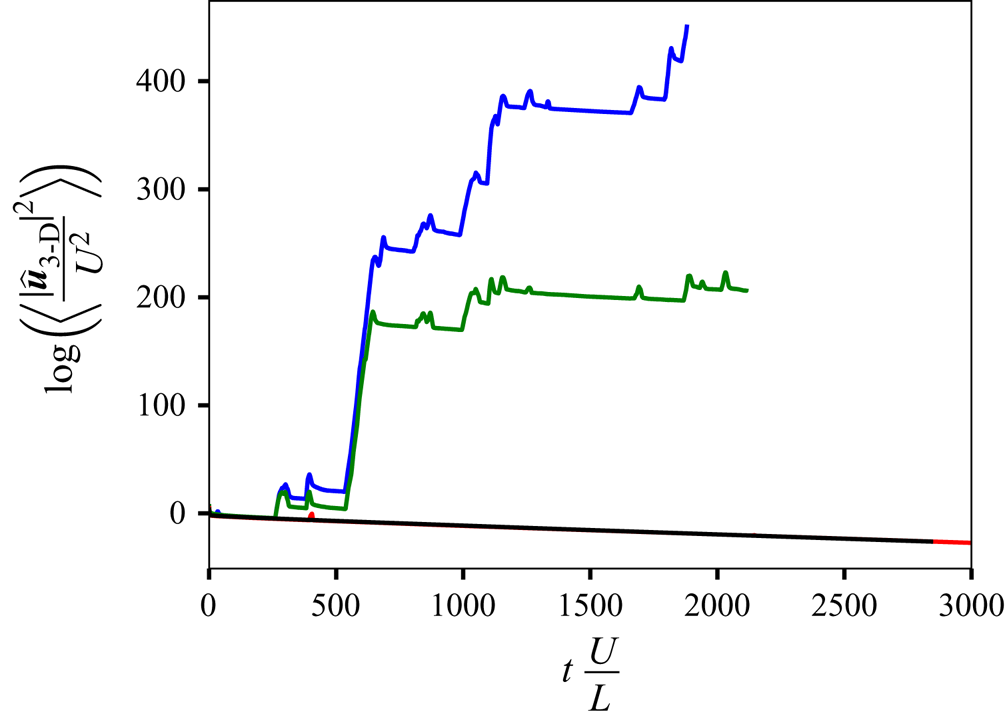
 $E_{\text{3-D}}(t)=\langle |\hat {{\boldsymbol u}}_{\text{3-D}}|^2\rangle _{\boldsymbol x}$, are displayed in figure 1 for such a set of runs. For low Rossby number (large rotation rate), the 3-D kinetic energy decays monotonically in time: the 2-D turbulent base flow is stable with respect to 3-D perturbations. By contrast, for larger Rossby number, the 3-D kinetic energy grows rapidly, indicating an instability. The growth rate of the 3-D kinetic energy displays a strongly intermittent behaviour, associated with the turbulent dynamics of the background 2-D flow.
Time series of the kinetic energy of the 3-D perturbation, for fixed Reynolds number  $Re=9.3 \times 10^4$ and aspect ratio
 $qL=6 {\rm \pi}$. The Rossby number increases from bottom to top:
 $Ro = 3.7 \times 10^{-3}$ (black),
 $4.9 \times 10^{-3}$ (red),
 $7.4 \times 10^{-3}$ (green) and
 $9.8 \times 10^{-3}$ (blue), respectively. The first two time series correspond to stable situations, while the 3-D perturbation grows exponentially for the two highest values of
 $Ro$.

Through long numerical integrations we infer the average growth rate,  $\gamma =\langle ({\mathrm {d}}/{\mathrm {d}t}) \log E_{\text{3-D}} \rangle _t$, as a function of the Rossby number
 $Ro$. The threshold Rossby number
 $Ro_c(Re,qL)$ for the emergence of three-dimensionality is obtained when
 $\gamma =0$. We determine
 $Ro_c(Re,qL)$ by repeating similar sets of numerical runs for various values of
 $Re$ and
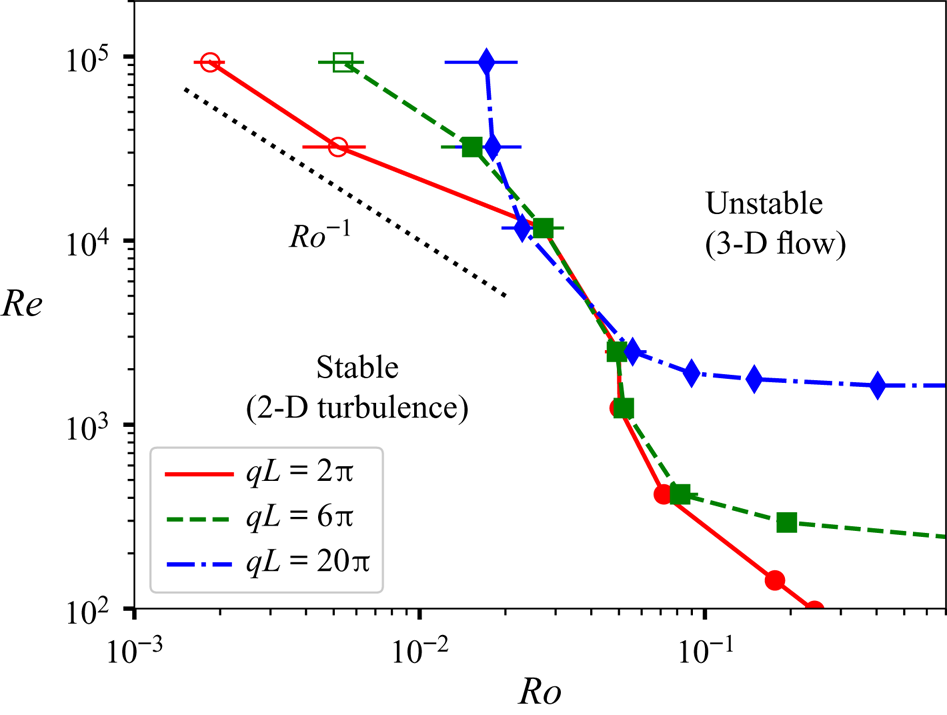
 $qL$ and show it in figure 2. The boundary clearly separates the low-
 $Ro$ region of parameter space, where the system has 2-D flow attractors, from the large-
 $Ro$ region, where the flow becomes 3-D. It is worth stressing the fact that
 $Ro_c$ is much larger than the conservative lower bound computed in Gallet (Reference Gallet2015): the threshold lies in a region of parameter space accessible to DNS (Godeferd & Lollini Reference Godeferd and Lollini1999; Mininni, Alexakis & Pouquet Reference Mininni, Alexakis and Pouquet2009; Mininni & Pouquet Reference Mininni and Pouquet2010) and laboratory experiments (Hopfinger, Browand & Gagne Reference Hopfinger, Browand and Gagne1982; Dickinson & Long Reference Dickinson and Long1983; Morize & Moisy Reference Morize and Moisy2006; Gallet et al. Reference Gallet, Campagne, Cortet and Moisy2014; Yarom & Sharon Reference Yarom and Sharon2014), which typically reach
 $Re \leq 3000$ and
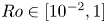 $Ro \in [10^{-2},1]$. However, the integration of the quasi-2-D equations on GPUs allows us to extend this boundary to more extreme values of the dimensionless parameters, all the way to
 $Re \simeq 10^5$ and
 $Ro\simeq 2\times 10^{-3}$.
Threshold for instability to 3-D perturbations in the  $(Ro,Re)$ plane, for three values of the aspect ratio. Full symbols with
 $Ro\in [0.015,0.03]$ correspond to a centrifugal-type instability. The open symbols at lower
 $Ro$ depart from this behaviour, and display the characteristics of the parametric excitation of inertial waves.

The location of the boundary depends on the aspect ratio  $qL$: for a shallow fluid layer with
 $qL=20{\rm \pi}$,
 $Ro_c$ seems to asymptote to a
 $Re$-independent value at large
 $Re$, at least up to
 $Re=10^5$. By contrast, for deeper fluid layers (lower values of
 $qL$),
 $Ro_c$ does depend on
 $Re$ at large Reynolds number, with the approximate scaling behaviour
 $Ro_c \sim Re^{-1}$, shown as a dashed line in figure 2. The instability arises over a turbulent base state, a situation less documented than standard instabilities arising over steady or periodic base flows. To gain intuition into the instability process, we thus pursue two approaches. First, we compare the present instability to known instabilities of steady vortices in rotating flows, namely the centrifugal and elliptical instabilities. Secondly, we discuss the decomposition of the low-
 $Ro$ 3-D perturbation into inertial waves, the instabilities of which can be investigated through a perturbative expansion in Rossby number.
3. Centrifugal instability
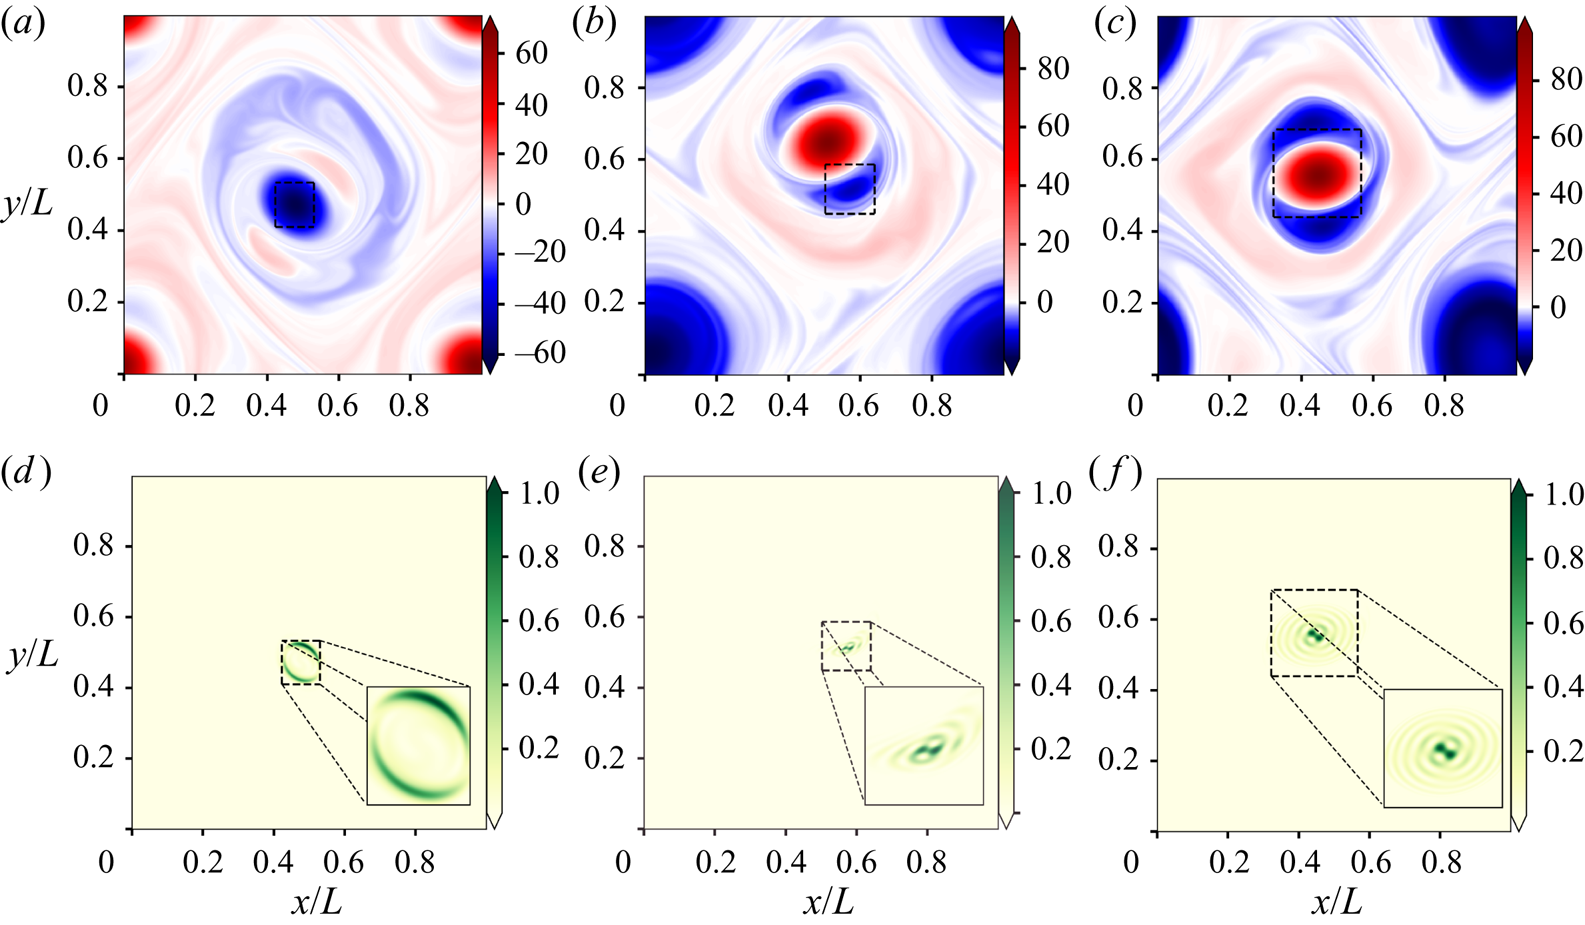
For the shallowest fluid domain considered in figure 2 $qL=20{\rm \pi}$, the 3-D instability exhibits many features of the centrifugal instability. First, we observe that the unstable mode develops only inside anticyclones, an example being provided in figure 3(a,d). Secondly, the inviscid Rayleigh criterion for the centrifugal instability of an axisymmetric vortex is that the quantity
 $\phi (r)=2[V(r)/r + \Omega ][\omega _{\text{2-D}}(r)+2 \Omega ]$ be negative for some value of
 $r$, where
 $V(r)$ and
 $\omega _{\text{2-D}}(r)$ are the azimuthal velocity profile and the vorticity profile, respectively (Kloosterziel & Van Heijst Reference Kloosterziel and Van Heijst1991). For a given radial structure of the anticyclone, this instability criterion yields
 $\omega (r=0) + {\mathcal {C}} \Omega < 0$, where the first term is the (negative) vorticity at the vortex centre, and
 ${\mathcal {C}}>0$ is a dimensionless constant that depends on the shape of the anticyclone (Sipp, Lauga & Jacquin Reference Sipp, Lauga and Jacquin1999; Sipp & Jacquin Reference Sipp and Jacquin2000). As a proxy to the Rayleigh criterion, we have computed the quantity
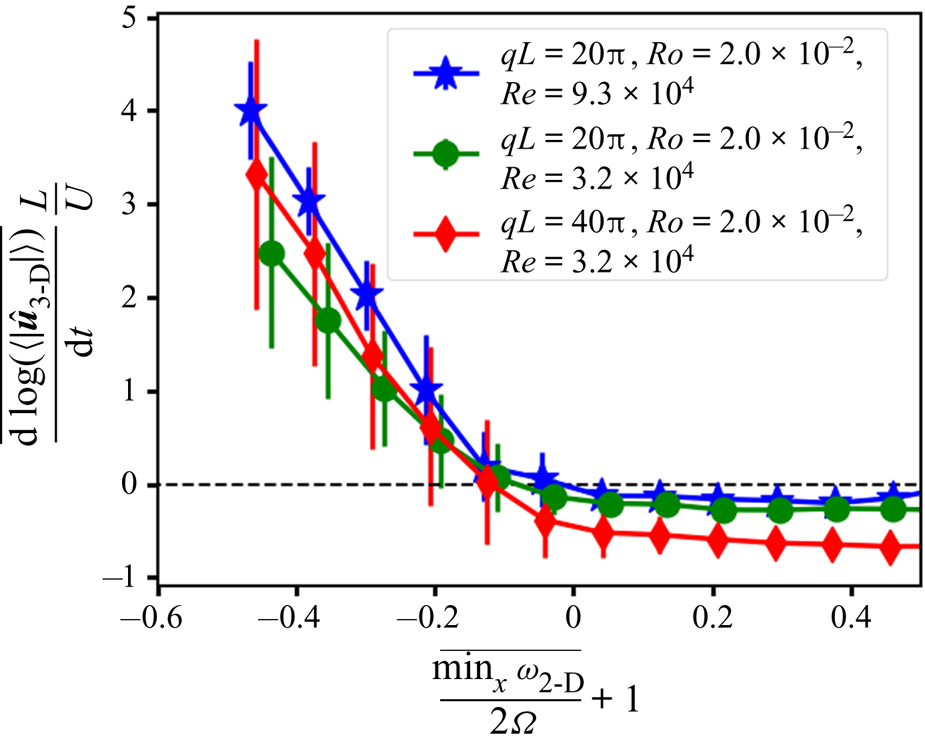
 ${\mathcal {R}}(t)=[\overline {\min _{\boldsymbol x} (\omega _{\text{2-D}})}+2 \Omega ]/2\Omega$, where the overline denotes a smoothing over one turnover time
 $L/U$. In figure 4, we represent a scatter plot of the (smoothed) instantaneous growth rate
 $\overline {({\mathrm {d}}/{\mathrm {d}t}) (\log E_{\text{3-D}} )}$ as a function of
 ${\mathcal {R}}(t)$. The two quantities are strongly correlated, the growth rate being positive whenever Rayleigh's instability criterion is satisfied, i.e. when
 ${\mathcal {R}}(t) \lesssim 0$. This is another indication that the instability arising in the present system is of centrifugal type.
Unstable mode near threshold: (a–c) normalised vorticity  $\omega _{\text{2-D}} ({L}/{U})$ of the 2-D turbulent base flow and (d–f) corresponding unstable three-dimensional perturbation; (a,d)
 $Re = 9.3\times 10^4, qL = 20{\rm \pi}, Ro = 2.0\times 10^{-2}$, (b,e)
 $Re = 9.3\times 10^4, qL = 6{\rm \pi}, Ro = 7.4\times 10^{-3}$ and (c,f)
 $Re = 9.3\times 10^4, qL = 2{\rm \pi} , Ro = 2.7\times 10^{-3}$.

Scatter plot of the smoothed growth rate versus the Rayleigh-like parameter  ${\mathcal {R}}(t)=\overline {\min _{\boldsymbol x} (\omega _{\text{2-D}})}/2\Omega + 1$. The symbols correspond to the mean value in each horizontal bin and the vertical bars show the standard deviation. The strong correlation between the two quantities is characteristic of a centrifugal instability developing inside anticyclones when
 ${\mathcal {R}} (t) \lesssim 0$.

Finally, rigorous upper bound theory indicates that the time average of the minimum 2-D vorticity scales with the large-scale turnover time,  $| \langle \min _{\boldsymbol x} (\omega _{\text{2-D}}) \rangle _t | \lesssim U/L$ up to logarithmic terms (see appendix A.3 in Gallet Reference Gallet2015). This is an indication that
 $\overline {\min _{\boldsymbol x} (\omega _{\text{2-D}})}$ scales as
 $U/L$, so that the generalised Rayleigh criterion yields
 $Ro \leq \textrm {const}.$: at low viscosity (large Reynolds number), we expect the centrifugal instability to arise above a
 $Re$-independent threshold Rossby number. The shallow-layer
 $qL=20{\rm \pi}$ data in figure 2 indeed asymptote to a
 $Re$-independent threshold Rossby number at large
 $Re$. A similar correlation between the Rayleigh criterion
 ${\mathcal {R}}(t)$ and the growth rate was observed for all the filled symbols in figure 2 with
 $Ro\lesssim 0.1$, which indicates that the corresponding instability is of centrifugal type. However, for large Reynolds number and lower values of the vertical wavenumber,
 $qL=6{\rm \pi}$ or
 $qL=2{\rm \pi}$ (i.e. for deeper fluid layers), we observed no clear correlations between
 ${\mathcal {R}}(t)$ and the growth rate: these are the open symbols in figure 2. These data points also depart from the
 $Ro_c=\textrm {const}.$ asymptote of the shallow layer
 $qL=20{\rm \pi}$, which is additional evidence that they do not correspond to a centrifugal instability.
4. Three-dimensionality in deeper fluid layers
For lower values of  $qL$ (deeper fluid layers) and large Reynolds number, the threshold to three-dimensionality departs from the
 $Ro=\textrm {const}.$ centrifugal asymptote (see figure 2). The deeper the layer, the lower the value
 $qL$ of the gravest vertical mode, and the sooner the threshold departs from the asymptote as
 $Re$ increases. We conjecture that the
 $qL=20{\rm \pi}$ threshold would probably also depart from the centrifugal asymptote if we could investigate even higher Reynolds numbers. There is thus another instability at play in deep domains and at large Reynolds number. To characterise the corresponding unstable modes, in the second and third columns of figure 3 we provide snapshots of the 2-D base flow and 3-D perturbation, during a phase of rapid growth of the latter. A first difference with the centrifugal instability is that the unstable mode can develop inside the elliptical core of both cyclones (figure 3b,e) and anticyclones (figure 3c,f). This points towards the elliptical instability as a potential candidate for this large-
 $Re$ instability.
However, at least two arguments seem to challenge this interpretation. First, we played the – arguably artificial – game of replacing the 2-D turbulent base flow by a steady flow that corresponds to either figure 3(b) or 3(c) (i.e. we freeze the 2-D base flow). We probed the stability of the frozen flow over a range of Rossby numbers that extends up to twice the threshold Rossby number of instability of the time-dependent flow. Surprisingly, we observed that such artificial steady flows do not lead to an instability over that range of Rossby numbers. The unavoidable conclusion is that the time dependence of the base flow plays a central role in the instability mechanism, which thus differs from the simple elliptical instability of a steady vortex. Secondly, theoretical predictions based on weak-ellipticity expansions lead to a threshold for instability of the form  $Re \sim Ro^{-2}$ (Le Dizes & Eloy Reference Le Dizes and Eloy1999; Le Dizes Reference Le Dizes2000), while our data points indicate a scaling law closer to
 $Re \sim Ro^{-1}$ for the 2-D/3-D threshold at high
 $Re$ in deep domains, albeit in a moderate parameter range (see figure 2 for
 $qL=6{\rm \pi}$ and
 $qL=2{\rm \pi}$).
Because the high- $Re$ deep-domain instability arises at low Rossby number, we can address it through a standard low-
 $Ro$ inertial-wave expansion of the 3-D perturbation. In this framework, the 2-D base flow and the 3-D perturbation are decomposed onto a helical basis of inertial waves, with slowly varying amplitudes. These wave amplitudes evolve primarily through resonant triadic interactions. However, these interactions do not transfer energy between the 3-D waves and the 2-D base flow, and therefore the 3-D instability cannot arise from resonant triadic interactions (Greenspan Reference Greenspan1968; Smith & Waleffe Reference Smith and Waleffe1999; Chen et al. Reference Chen, Chen, Eyink and Holm2005). In some sense, this is the reason behind the existence of exact two-dimensionalisation: these instabilities, which would lead to a constant threshold Reynolds number
 $Re_c$ (set by the balance between an inviscid growth rate
 $\gamma \sim U/L$ and the viscous damping rate
 $\nu /L^2$) cannot arise over a purely 2-D base flow. Instead, one needs to go to the next order in Rossby number to uncover mechanisms that do transfer energy between the 2-D flow and the 3-D perturbations. At this order, quasi-resonant triads and resonant quartets of inertial waves were recently highlighted as important instability mechanisms to induce 2-D motion from an inertial-wave base flow (Kerswell Reference Kerswell1999; Smith & Waleffe Reference Smith and Waleffe1999; Le Reun Reference Le Reun2019; Le Reun, Favier & Le Bars Reference Le Reun, Favier and Le Bars2019; Brunet et al. Reference Brunet, Gallet and Cortet2020; Le Reun et al. Reference Le Reun, Gallet, Favier and Le Bars2020).
We argue that the opposite mechanisms can arise in the present system: 3-D inertial waves can arise spontaneously over a 2-D base flow, either through resonant quartets of inertial waves, or through the parametric excitation of inertial waves by the time-dependent 2-D flow. Both mechanisms would lead to an inviscid growth rate  $\gamma \sim Ro \, U/L$: at threshold, the latter balances the viscous damping rate
 $\nu /L^2$, which leads to a threshold
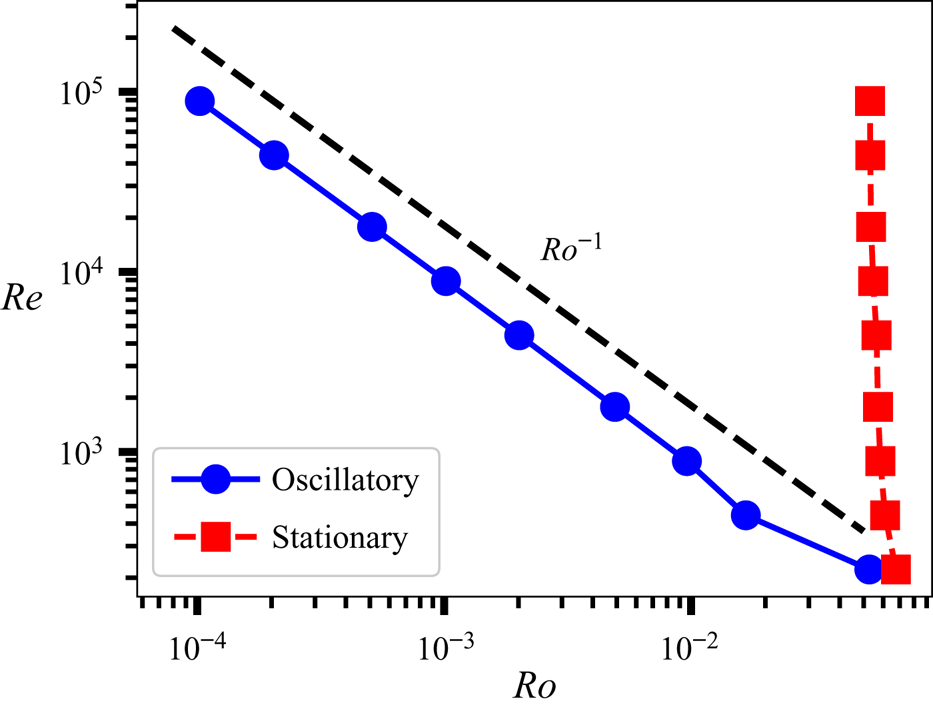
 $Re \sim Ro^{-1}$ in parameter space. The parametric excitation of inertial waves by the time-dependent 2-D flow is a particularly appealing mechanism, as it provides an explanation for both the
 $Re \sim Ro^{-1}$ scaling behaviour and the key role of the time dependence of the base flow. A simple illustration of this mechanism is provided by the oscillatory Kolmogorov flow: instead of the intricate 2-D turbulent base flow, consider the simpler flow
 ${\boldsymbol u}_{\text{2-D}}= 2 U \sin (4{\rm \pi} y/L) \cos (4{\rm \pi} U t/L) {\boldsymbol e}_x$ as a model of large-scale flow structures of typical velocity
 $U$ evolving with the eddy turnover time
 $L/U$. We determine the threshold for the growth of 3-D perturbations around this 2-D base flow using a numerical code based on Floquet theory in time. As shown in figure 5 for
 $qL=2{\rm \pi}$, the threshold of the corresponding parametric instability scales as
 $Re \sim Ro^{-1}$ (blue circles). By contrast, the steady version of this Kolmogorov flow,
 ${\boldsymbol u}_{\text{2-D}}= \sqrt {2} U \sin (4{\rm \pi} y/L) {\boldsymbol e}_x$, yields an instability threshold
 $Ro \simeq \textrm {const}.$ (red squares), reminiscent of the centrifugal asymptote in figure 2. Indeed, for such a parallel flow the streamlines have an infinite radius of curvature, and the
 $\phi$ centrifugal-instability criterion above reduces to the existence of a point in the flow where
 $\omega _{\text{2-D}}\leq - 2 \Omega$. This criterion yields a threshold Rossby number
 $Ro_c=1/(4{\rm \pi} \sqrt {2})\simeq 0.0563$ for the steady Kolmogorov flow, in excellent agreement with the numerical value (see figure 5).
Threshold of instability to 3-D perturbations in the  $(Ro,Re)$ plane for an oscillatory Kolmogorov flow (blue circles) and a steady Kolmogorov flow (red squares). While the steady Kolmogorov flow has a
 $Ro \simeq \textrm {const}.$ instability threshold, the oscillatory Kolmogorov flow is much more unstable, with a threshold Reynolds number that scales as
 $Ro^{-1}$ (dashed line).

The stark contrast between the instability thresholds of the steady and oscillatory Kolmogorov flows in figure 5 illustrates once again that the time dependence of the 2-D base flow is a key ingredient for instability to 3-D perturbations at high Reynolds number and low Rossby number.
5. Discussion
We have investigated the onset of three-dimensionality in rapidly rotating turbulent flows using the capabilities of modern GPUs. Interestingly, the threshold between exactly 2-D and partially 3-D flows crosses the region of parameter space that is accessible to laboratory experiments and fully 3-D DNS. In this region of parameter space, we have provided evidence that three-dimensionality arises through the centrifugal destabilisation of anticyclones. The corresponding threshold Rossby number depends only weakly on the Reynolds number for large enough  $Re$. However, our approach also allowed us to reach a region of parameter space that goes beyond the parameter range of state-of-the-art experiments and DNS, up to
 $Re=10^5$ and
 $Ro=2 \times 10^{-3}$ simultaneously. For such extreme parameter regimes, the threshold between 2-D and 3-D flows scales as
 $Re \sim Ro^{-1}$, and the time dependence of the base flow appears as a crucial ingredient of the instability process. We proposed the parametric amplification of inertial waves by the fluctuating 2-D turbulent flow as a candidate mechanism for this instability, which we exemplified through the stability analysis of the rapidly rotating oscillatory Kolmogorov flow. Whether and how this instability is connected to standard forms of the elliptical instability remains to be investigated. The scaling
 $Re \sim Ro^{-1}$ for the instability threshold is yet another confirmation that the limits
 $Re \to \infty$ and
 $Ro \to 0$ do not commute: the end state of rapidly rotating turbulence depends very much on the distinguished limit considered when sending
 $Re$ to infinity and
 $Ro$ to zero (Alexakis Reference Alexakis2015; Gallet Reference Gallet2015; Le Reun Reference Le Reun2019).
While this study is motivated primarily by theoretical fluid dynamics, some connection can be made to the dynamics of natural flows. Very much like rotating turbulence can be decomposed into a 2-D slow manifold coexisting with 3-D waves, rotating stratified oceanic and atmospheric flows can be decomposed into balanced motion – the quasi-geostrophic slow manifold – and waves. In both cases the slow manifold leads to an inverse energy cascade, with energy condensing into domain-scale structures in the absence of large-scale damping, and in both cases the waves can induce a ‘wave-turbulent’ forward energy cascade. Because such condensation of kinetic energy at the basin scale is absent from oceanic data, it has been hypothesised that part of the balanced energy may be transferred to wave-like motion and cascaded to small scales, a phenomenon coined ‘loss of balance’ (Vanneste Reference Vanneste2013; Rocha, Wagner & Young Reference Rocha, Wagner and Young2018). In the simpler context of rapidly rotating unstratified turbulence, the slow manifold consists of 2-D flows, and loss of balance corresponds to the emergence of 3-D waves. Our study thus highlights basic instability mechanisms leading to spontaneous loss of balance in a rapidly rotating unstratified turbulent flow. It provides the region of parameter space where 3-D structures develop, shedding light on the possible emergence of a forward energy cascade as the Rossby number increases.
We stress the fact that the present linear stability analysis only provides sufficient conditions for the emergence of 3-D structures. For Rossby numbers lower than  $Ro_c$, we cannot rule out the emergence of three-dimensionality through finite-amplitude instabilities (FAIs). In other words, below
 $Ro_c(Re)$ we know that the system possesses a 2-D flow attractor, but this attractor may coexist in phase space with a fully 3-D flow attractor (see e.g. Yokoyama & Takaoka (Reference Yokoyama and Takaoka2017) for the coexistence of a quasi-2-D attractor and a strongly 3-D one). The statistically steady state realised by the system would then depend on the initial condition. As shown in Gallet (Reference Gallet2015), however, there exists a value
 $Ro_{abs}(Re)$ of the Rossby number below which such FAIs are ruled out: for
 $Ro \leq Ro_{abs}(Re)$, the 2-D flow is absolutely stable to 3-D perturbations and the system ends up in the 2-D flow attractor regardless of the initial condition. If
 $Ro_{abs}(Re)<Ro_c(Re)$, then FAIs can arise for
 $Ro\in [Ro_{abs}(Re), Ro_c(Re)]$, depending on the initial condition. If
 $Ro_{abs}(Re)=Ro_c(Re)$, FAIs are ruled out. Again, the determination of
 $Ro_{abs}(Re)$ through fully 3-D DNS remains prohibitively expensive at large
 $Re$ and low
 $Ro$. Instead, the existence of FAIs, as well as whether and when a forward energy cascade develops, could be investigated through nonlinear extensions of this work: one could design a weakly nonlinear model by keeping only the first unstable vertically dependent mode and its feedback onto the 2-D base flow, in the spirit of Benavides & Alexakis (Reference Benavides and Alexakis2017) and Seshasayanan, Gallet & Alexakis (Reference Seshasayanan, Gallet and Alexakis2017). For physical systems that are amenable to 3-D DNS in extreme parameter regimes, models of this kind have predictive skills when compared to 3-D DNS, at least at a qualitative level (van Kan & Alexakis Reference van Kan and Alexakis2019). For the problem at stake, such a model may capture the emergence of a forward energy cascade as
 $Ro$ increases (Alexakis & Biferale Reference Alexakis and Biferale2018), thus providing direct information on the region of parameter space where rapidly rotating turbulence displays an ‘anomalous’ or fully turbulent energy dissipation rate, independent of molecular viscosity.
Acknowledgements
We thank S. Le Dizès, S. Benavides and A. Alexakis for insightful discussions. This work is supported by the European Research Council under grant agreement 757239.
Declaration of interests
The authors report no conflicts of interest.
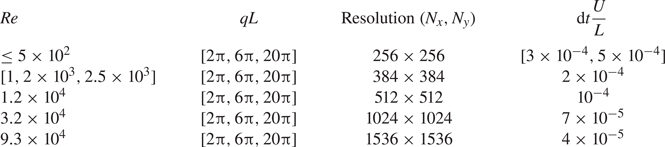
Appendix. Numerical methods
The numerical simulations are performed using standard pseudo-spectral methods, with dealiasing using the two-thirds rule. The fields are decomposed into a Fourier–Fourier basis in spectral space and discretised on a  $(N_x, N_y)$ grid in the
 $x$ and
 $y$ directions of the physical space. Time stepping is performed using a standard four-step third-order Runge–Kutta scheme. The adaptive time step
 $\textrm {d} t$ satisfies a Courant–Friedrichs–Lewy (CFL) condition constructed from both advective and rotation time scales. The spatial resolutions and the average time step are given in table 1. The simulations are run for a number of time steps of the order of
 $Re\, L /(U\,\textrm {d} t)$.
Resolution  $(N_x, N_y)$ and average (adaptive) time step
 $\textrm {d} t ({U}/{L})$ for the values of the Reynolds number considered in this study. The simulations are run for a large number of time steps, of the order of
 $Re\, L /(U\,\textrm {d} t)$.

Simulations of the 2-D Navier–Stokes equations (2.2) are performed until the flow reaches a statistically steady state, which constitutes the base flow of the present linear stability analysis. The Reynolds and Rossby numbers are built using the r.m.s. velocity  $U$ of this 2-D base flow. The control parameter of the 2-D Navier–Stokes equation (2.2) is the Grashof number
 $Gr=f_0^{1/2} L^{3/2} /\nu$, while the r.m.s. velocity
 $U$ is an emergent quantity. For low Grashof number,
 $U$ is given by the laminar balance between the viscous and forcing terms,
 $U/\sqrt {f_0 L} \sim Gr$. For larger Grashof number,
 $Gr \gtrsim 500$, the r.m.s. velocity obeys the approximate scaling law
 $U/\sqrt {f_0 L} \simeq 6.0 \times 10^{-3} \,Gr^{1/2}$ with 20 % accuracy.