Anyone seeking to come to grips with the modern economic history of the southeast European periphery has to choose between one of three narratives.
First there is the literature spawned by recent debates about globalization in the period before 1914, which includes southeastern Europe in an optimistic story of convergence. This literature is perhaps best exemplified by David Good and Tongushu Ma's survey article of 1999, which postulates a generalized tendency towards convergence across the Eastern European periphery prior to 1914.1
Good and Ma, “Economic Growth.”
Maddison, World Economy.
On the Kingdom of Poland see Blobaum, “To Market”; and Kostrowicka, “Changes.” On Hungary see Eddie, “Agricultural Production”; Schulze, Engineering; and Gunst, Hungarian Agrarian Society.
The Italian literature is summarized in Cohen and Federico, Growth. For a summary of revisionism on Russia see Gregory, Before Command, pp. 37–54.
Van Zanden, “Green Revolution”; and Federico, Feeding the World, pp. 1–4.
Serious questions remain, however, about the reliability of the Good and Ma data for the Austro-Hungarian Empire.6
Schulze, “Patterns.”
Tortella, Development, pp. 23–72; and Simpson, Spanish Agriculture.
Foreman-Peck and Lains, “Economic Growth”; Lains, “Southern European Economic Backwardness”; Tortella, “Patterns”; and Bairoch, “Europe's GNP.”
The third body of historiography, the recent historical literature on the Balkans, is even more pessimistic than that of Foreman-Peck and Lains. Michael Palairet's important monograph on the Balkan Economies ca. 1800–1914 bears a telling subtitle: Evolution without Development.9
Palairet, Balkan Economies, pp. 321–27, 357–70. Palairet is notably more pessimistic than earlier specialist work on the region such as Lampe and Jackson, Balkan Economies; and Lampe, Bulgarian Economy.
Sundhaussen, “Verpasste Agrarrevolution”; and Sundhaussen, Historische Statistik.
Viewed from the perspective of the Balkans themselves, these findings by international researchers do not come as a surprise. In the tumultuous aftermath of communism, a pessimistic tone suffuses the writing of many historians from the southeastern European states. To take just one instance, two major accounts of Bulgaria's social and economic history have recently been framed within a stagnationist mode.11
Avramov, Stopanskiat, pp. 144–48; and Daskalov, Bulgarskoto obshetsvo.
Gerschenkron, “Some Aspects.”
The aim of this essay is to review the quantitative data that underpin these divergent accounts of modern economic development in the Balkans. For the Bulgarian case we present a new set of estimates for real GDP per capita in the late nineteenth century, staking out a position that lies somewhere between the pessimism of Palairet and the convergence-optimism of authors such as Good and Ma and that may be compatible with the view argued by Foreman-Peck and Lains. We then engage the difficult and often neglected question of how the narrative of the pre-1914 period ought to be linked across the turmoil of World War I to the more firmly established quantitative data series for the 1920s and 1930s. Lastly, by focusing on agriculture, by far the most important sector of the Bulgarian economy, and by reviewing its development from the late nineteenth century into the latter half of the twentieth century, we highlight the interwar years as the period in which Bulgaria finally began to shift gear towards modern economic growth. This leads us to our final suggestion, which is that the preconditions for the rapid growth spurt after 1945, superficially attributable to communism, were in fact put in place in the decades beforehand.
BENCHMARKS AND DISPUTED TRENDS IN BULGARIAN GDP
Though there continues to be room for disagreement about the appropriate benchmark figures for European per capita incomes in 1913, particularly as concerns Spain, Portugal, and Italy, there is a high degree of consensus amongst more recent publications in placing Bulgarian GDP just prior to World War I at between 1,456 and 1,521 Geary-Khamis dollars of 1990 and thus at the very bottom of the European league. The method through which this benchmark is arrived at varies according to the authority one chooses. In the case of Lains, the reference is to Gini et al.'s estimates of 1959, which provide a ratio relative to U.K. GDP per capita of 0.309.13
Lains, “Southern European Economic Backwardness.”
Maddison, World Economy.
Clark, Conditions.
Bairoch, “Europe's GNP,” p. 286.
Good and Ma, “Economic Growth.”
Ibid.
Far more controversial is the question of growth rates. For lack of adequate nineteenth-century sources, the most common method for estimating growth rates before 1914 has been the use of proxy measures. The most technically sophisticated effort in this direction has certainly been that of Good and Ma.19
Ibid.
Ibid., pp. 890–98.
Maddison, World Economy, p. 93.
However, serious doubts must be raised about the Good and Ma proxies at least as far as Bulgaria is concerned. Of their three key variables, only one in fact points consistently in an upward direction in Bulgaria prior to 1913. As will be discussed, the share of nonagricultural population, surely the most inherently significant indicator, was stuck in Bulgaria at a very low level for the 50 years following independence, with no decisive upward trend. The crude death rate fell between the early 1890s and the immediate prewar period, but the recorded figures after 1890 were consistently worse than those reported for the first decade after independence.22
Popov, La Bulgarie, p. 54.
Ibid., pp. 434–37.
Good and Ma's is not the only exercise in proxy methodology for Europe's periphery. An earlier experiment was carried out by Bairoch in the 1970s. Though he did not make his methods entirely explicit, Bairoch relied on a wider bundle of 12 proxy indicators, of which two—the crude death rate and the percentage of the workforce in nonagricultural employment—match those employed by Good and Ma.24
Bairoch, “Europe's GNP,” pp. 324–25.
Lains, “Southern European Economic Backwardness”; and Pamuk, “Estimating.”
Foreman-Peck and Lains, “Economic Growth.”
Nor are Pamuk, Foreman-Peck and Lains the most pessimistic voices. Palairet and the Sundhaussen agree in seeing both the Bulgarian and Serbian economies as locked not into a cycle of slow growth, but of actual decline. To make this case for Bulgaria, Palairet draws on a wide variety of indicators, one of which—his agricultural output index—we will return to below. But in making his case for decline, Palairet also invokes Bulgaria's little appreciated tradition of national income estimation. In the late nineteenth century newly independent Bulgaria was amongst a cluster of countries to produce their first estimates of national income.27
Studenski, Income of Nations, pp. 156–57.
Popov, Stopanska Bulgaria, p. 399, later reprinted in French as Popov, La Bulgarie Économique.
Palairet, Balkan Economies, p. 323.
Given the startling implications of this claim, the first aim of this article is to reconstruct Popov's estimates and to explore the interpretative problems they raise. As our template for the construction of Bulgarian GNP estimates for the pre-1914 period, we draw on the interwar work of Asen Chakalov. In the 1930s Chakalov was associated with the Statistical Institute for Economic Studies at the Sofia State University headed by Oscar Anderson.30
Chakalov, Nationaliat dohod.
Maddison, World Economy, p. 93. For an English discussion see Rangelova, “Bulgaria's National Income.”
COMPILING A NEW GNP ESTIMATE
As Rositsa Rangelova has recently shown, Chakalov's national accounting methodology corresponds closely to modern definitions of Gross National Product (GNP), i.e., the total income of Bulgarian individuals and legal entities regardless of their location within or outside the national borders.32
Rangelova, “Bulgaria's National Income,” pp. 232–36.
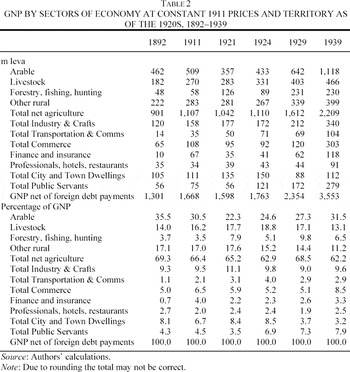
As in the original calculations by Popov and Chakalov, arable agriculture emerges as the largest component of our estimate, constituting 30.5 percent of the total in 1911.33
A fully annotated, English language spreadsheet with detailed source citations is available from the authors on request.
The calculation of value added in livestock farming (16.2 percent) rests on the number of beasts in key census years and average milk and meat yields minus the costs of feed supplied from the arable sector. For sake of consistency we have applied the milk yields used by Chakalov with a downward adjustment for the earlier period. For 1924 Chakalov reckoned with 1,000 liters of milk per cow per annum. For 1892 we assume 900 liters. The same technique is also applied for wool and other animal hair production. The output of eggs (0.8 percent of the total in 1911) is estimated from the transport statistics.
The production of forestry and fishing (3.4 percent) is derived from the official figures published by General Directorate of Statistics. The output of home industry (8.5 percent) is calculated by multiplying the number of females, aged between 16 and 60 years by the average number of days spent for home work based on peasant account books and contemporary surveys. A similar procedure is applied for servants (0.2 percent). Implicit rental income of both rural and urban dwellings (13 percent) is based on census information about the number of buildings and the yearly data on rents. Interest on agricultural credits is subtracted, following Chakalov's methodology. To conform to the definition of GNP, we also add to the total of Bulgarian rural incomes the remittances of seasonal migrants.
About the production of large-scale industry and mining (3 percent of the total in 1911), we possess fairly good statistical information, thanks to the protective policy of the Bulgarian government. Value added is arrived at in the normal fashion by deducting input costs from sales figures. To conform to the definition of GNP we also deduct interest and dividend payments to foreigners. Only for 1892 and 1899 were we compelled to use coal consumption and the number of factories to arrive at a reasonable estimate of the industrial output.
For construction and the crafts sectors the source situation is less good. Figures for public construction were taken from central and local government budgets. For private construction and the craft sector (6.2 percent), we follow Chakalov in relying on census figures for the number of craftsmen and builders, multiplied by official statistics of the annual earnings of masons, masters, journeymen, and apprentices.
Due to the significant presence of the state in the transport and communication sector we have at our disposal very detailed data on their income net of working expenses, accounting for 2.1 percent of the total. The same applies to a large extent to the financial services sector (4 percent). Only for private banking or insurance institutions (1.9 percent) are we compelled to resort to profit and loss accounts published in the State Gazette or preserved in the archives.
The relatively low level of marketization of the economy creates a serious problem for the calculation of commercial incomes (6.5 percent of the total in 1911). Following Chakalov we construct a proxy by assuming a fixed markup on the sales of agricultural goods and the value added of industry and the import trades. The flow of traded agricultural goods is approximated by summing the value of exports and the value of commodities transported by the railways. The industrial and craft figure is arrived at as for agricultural production. To avoid double counting, industrial output is netted of local raw material consumption and of excises and taxes paid. The income of commerce is taken to be a fixed 15 percent share of this total sales figure for agriculture, industry, and crafts.
Aggregate incomes of freelance professionals and services (2 percent) were estimated by applying estimated salary levels to census data. For lack of alternative information, the salary levels were derived from masons' wages, adjusted for salary differentials and the longer working year of white-collar employees.
Earnings from state employment (4.5 percent of total in 1911) were taken directly from budget data for wage bills and the public works expenditure of national and local government as well as autonomous state agencies. Again, to conform to the definition of GNP, interest owed on Bulgaria's foreign debt is subtracted.
To summarize: For 47.6 percent of the estimate (in 1911) we used physical output data multiplied by prices, minus input costs; for 9.3 percent we can draw information on salaries and wage bills directly from state budgets and business accounts; for 36.5 percent of the estimate we are relying on employment census data multiplied by estimates for annual earnings; 6.6 percent of the estimate, covering the commercial sector, is derived by more approximate methods.
GNP OVER THE LONG RUN: THE PROBLEM OF DEFLATION
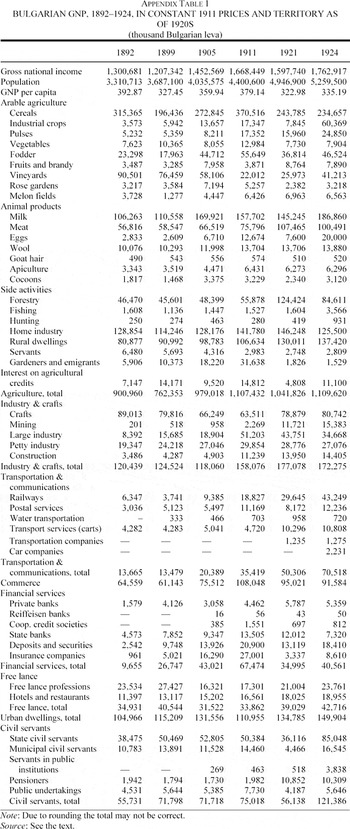
Applying Chakalov's methodology to the obvious official sources we achieve a reassuring match with his estimate for 1924. In addition and perhaps more surprisingly we are also able, using Chakalov's methodology, to replicate Popov's nominal estimates both for 1892 and 1911 as well as adding new data points for 1899, 1905, and 1921. (See the estimates compared in Table 1.)
To provide a meaningful comparison over the long run between 1892 and 1945, we must allow for price changes, population change, and the impact of territorial redistribution in the course of the Balkan wars and World War I. The latter two points will be discussed below and present few areas of disagreement. The choice of proper deflators, however, is a potentially controversial one.
Instead of deflating the nominal national income figures using the retail price index, we follow Chakalov's procedure in applying specific price series to each component of our GNP estimate. We prefer this methodology, because in an economy in which the vast majority of the population were self-provisioning in food and in which heavy tariff protection distorted the urban price level upwards, deflating total output by an urban cost of living index will result in serious biases. To arrive at a constant price series for agricultural output, we apply farm gate prices of 1911 to the physical output series. For lack of subsectoral data, industrial output is deflated by an unweighted average of the available wholesale prices for the different lines of industrial production. Employment data taken from the census were multiplied by wage and salary figures for 1911. In our constant price series, deflation by means of the retail price index is thus confined to the incomes of civil servants, financial services, and commerce, or just 13.6 percent of the total estimate. Because these were the sectors of Bulgarian society most dependent on the market, this seems a reasonable procedure.

Adopting this more sophisticated deflation procedure turns out to have major implications. Whereas Popov's retail price index rises by a surprising 51 percent between 1900 and 1911, producing the highly pessimistic story suggested by Palairet, our implicit “GNP deflator” increases by only 27 percent between 1899 and 1911. This discrepancy is largely accounted for by the heavy weight we accord to farm gate prices for agricultural output, which were under the influence of global price trends.
As Figure 1 vividly illustrates, our reconstruction of the national income data suggests a substantial revision of existing views of Bulgaria's economic development between the late nineteenth century and the end of World War II. The following discussion will focus on the period before 1914. We will return to the interwar period thereafter.

FIGURE 1 COMPETING VIEWS OF BULGARIA'S ECONOMIC DEVELOPMENT, 1870–1945
By confirming Popov's nominal data and applying to them a more sophisticated deflation procedure than that suggested by Palairet, we steer a middle course between his pessimistic story of economic decline between 1890 and 1911 and the standard growth narrative peddled by Good and Ma. In spirit, our data are closest to the slow growth scenario first suggested by Bairoch and since adopted by Foreman-Peck and Lains. We qualify their story, however, to the extent that whatever growth may have occurred between the 1860s and 1913 must have taken place prior to 1890. Between the early 1890s and the mid 1930s, the best available evidence suggests that Bulgaria experienced very little growth in per capita incomes.
In this connection it is also worth noting what appears to be an inconsistency between Palairet's treatment of the Popov national income data, and his main index of Bulgarian economic development, which is a constant price series for agricultural output stretching from 1865 to 1914.34
Compare Palairet, Balkan Economies, pp. 322–23 and 366–27.
Palairet, Balkan Economies, p. 366.
If we accept that, at least in the period between the 1890s and the 1930s, per capita incomes in Bulgaria fluctuated around a plateau of roughly 1,500 Geary-Khamis dollars (1990), this stasis was conditioned by a no less striking continuity in sectoral shares. Up to World War II agriculture remained overwhelmingly the dominant sector in the Bulgarian economy, with industry contributing less than 15 percent, and the rest being made up of service sector and public sector incomes (see Table 2).

EXTENSIVE GROWTH
To explore the dynamics, which held this equilibrium in place for the best part of two generations, we must look in greater detail at developments at a sectoral level, particularly in agriculture. And we must focus in particular on the interaction between output, population, and land. For behind the stasis in per capita income figures in the generation before World War I, lies a dramatic story of what is perhaps best termed “extensive growth.”
In less than 20 years between the end of 1892 and the end of 1910, Bulgaria's population expanded by one-third, from 3.31 million to 4.34 million. At the same time, per capita incomes neither declined nor increased substantially. Instead, national output increased roughly in proportion to population, leaving per capita incomes unchanged. What were the motivating forces of this “extensive growth”?
In the Bulgarian parliament and amongst the middle-class elite in the 1890s there was much talk about industrialization.36
See Lampe, Bulgarian Economy, for a review of industrialization discussions.
The phylloxera outbreak of the 1890s, according to our calculations, reduced the value of grape production, which in 1892 accounted for 10 percent of rural incomes, by 80 percent. Then in the late 1890s the over-commitment of Bulgarian peasants to wheat farming was punished by a succession of bad harvests brought on by a serious drought. As a result, in 1899 per capita earnings from wheat were down by 39 percent relative to 1892. Over this seven year period wheat alone accounted for a 13 percent fall in total per capita agricultural incomes. How then did Bulgarian agriculture bounce back from these shocks, feeding a much-increased population at a roughly constant level?
Certainly we can rule out the narrative of intensification that lay behind the “green revolution” of Western and Central Europe. According to Van Zanden's analysis, the level of productivity in European agriculture by the 1870s depended first and foremost on a country's general level of modernization.37
Van Zanden, “Green Revolution.”
Not that Bulgaria's farmers were without livestock. Both in absolute size and in per capita terms, Bulgaria had one of the largest sheep herds in Europe.38
For the following see the comparative data on livestock in Popov, La Bulgarie, pp. 220–85.
Clark, Conditions, p. 291.
Nor, despite its relative over-abundance of labor, was Bulgaria prior to 1914 able to significantly shift the basis of its arable farming towards more labor-intensive lines. With the vineyards blighted, Bulgaria remained trapped in grain farming, in which there was little evidence of intensification. Here perhaps the most relevant comparison is with Italy, which managed to achieve a considerable increase in agricultural output per capita from the 1890s onwards. Italy's advance rested on a shift into labor-intensive, high value fruit and vegetable crops and a dramatic increase in the application of artificial fertilizers.40
Zamagni, Economic History, pp. 47–74.
The one important sign of substantial modernization in Bulgarian agriculture in the early twentieth century was the import of considerable numbers of iron ploughs to replace the wooden implements with which the peasants barely scraped the topsoil. This was a very promising development, as Bulgaria's dry summers put a premium on deep working of the soil during the wet autumn months.41
Daniel, “Regional Differences.”
Stranski, “Die Böden” in Molloff, Die Sozialökonomische Struktur, p. 26.
The conclusion is inescapable: lacking the means for intensification along Western or Central European lines, the principal factor driving the expansion of output in Bulgarian agriculture was land. If we are to believe Popov's figures, between 1889 and 1911, the area under cereals increased by 157 percent.43
Popov, La Bulgarie Économique, p. 161.
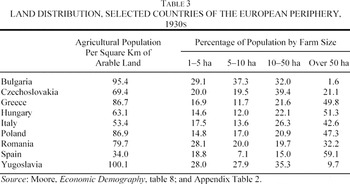
As is clear from Table 3, we are not arguing that the Bulgarian peasantry were overgenerously endowed with land. Far from it: average farm sizes were very small by northwest European standards. By the interwar period, when the limits of easy extensive growth had been reached, the ratio of rural population to cultivated land was higher in Bulgaria than in even the most overcrowded regions of Italy and exceeded the national average for Poland or Rumania. Only in the Bukovina and Galicia and in the Serbian regions of Yugoslavia was land scarcity significantly worse. The point we are making is not that agricultural land was particularly abundant in Bulgaria, but that up to 1913 at least the land situation was not getting worse. Furthermore the prospect of land ownership was a realistic one for the vast majority of Bulgarians.

We stress this flexibility of the land constraint, because it seems essential to understanding three interconnected features of Bulgaria's social and economic development prior to 1914: the growth of total agricultural output in line with population, the striking lack of international emigration from Bulgaria, and the population boom itself.
Bulgaria's exceptionally dramatic demographic transition in the 70 years following independence dominates its economic and social history. From the mid nineteenth century onwards, population growth accelerated dramatically, reaching its peak in the early 1920s at just over 2 percent per annum. Prior to 1913 it was this explosive growth in population that ate up any advance in national income, reducing per capita income growth to zero.
The population explosion was due both to an increase in fertility from 33.7 births per thousand in 1881 to a maximum of 45.1 in 1914, amongst the highest rates ever recorded in Europe West of Russia, and, from the early 1890s onwards, to a sustained decline in mortality. So much is clear from the earliest statistics produced by the new Bulgarian nation state. The most likely cause for the decline in mortality is the low-cost imitation of Western public health measures, in particular the provision of clean water. Over the ultimate causes of the increase in fertility there remains a large measure of uncertainty. One popular theory linked the sudden rise in the birth rate to the breakdown in the traditional form of extended patriarchal households (zadruga) supposedly dominant throughout the Balkans.44
Sklar, “Role,” pp. 231–47.
Botev, “Nuptiality,” pp. 107–26.
And a similar logic applies to the question of emigration. Emigration provided one obvious escape from the overpopulated periphery of Europe. The departure of more than 14 million Italians between the 1880s and 1914, both overseas and within Europe, was one of the most spectacular voluntary population movements in history. But Bulgaria, along with the other Balkan countries, was a notable absentee from the economy of mass migration. Of course, some Bulgarians did emigrate. Enough indeed to provoke an anxious debate in Sofia.46
Danailov, Izsledvane; and Mishaikov, Naselenieto.
Davie, World Immigration, pp. 51–191
Such flows of population are clearly conditioned by a variety of factors including politics, information, cultural restrictions on mobility, and the initial availability of cash to buy tickets.48
Hatton and Williamson, “What Drove the Mass Migrations,” pp. 533–59.
In short, our data suggest an internally consistent story of extensive growth as the most likely scenario for Bulgaria's economic development prior to 1914. Obviously, the stagnation of per capita incomes at a level precariously above the poverty line was not an attractive long-term scenario. Though its population was not becoming immiserated, Bulgaria was far behind the core countries of the liberal capitalism and it was falling further behind every year. Contrary to what Good and Ma suggest, Bulgaria was certainly not keeping pace with the rapidly converging countries of eastern and central Europe. In this respect it resembled Spain and Greece rather more than it did the revisionist view of Hungary or Italy. Furthermore, extensive growth could not continue indefinitely. However, our GNP estimates also lead us to reject Palairet's deeply pessimistic vision. In the generation prior to World War I, the Bulgarian economy was at least growing fast enough to hold the material standard of living in a precarious equilibrium.
THE IMPACT OF WAR
The Balkan wars of 1912 and 1913 and defeat in World War I dealt a devastating blow to the Bulgarian political system and to national self-confidence. In the wake of the wars, bourgeois spirits were further rattled by the triumphant rise to power of the radical peasant party, which took office in 1919, and the emergence of a significant communist party backed by the new Bolshevik regime in Russia.49
Bell, Peasants.
What was the impact of this political turmoil on Bulgaria's economic development? It is clear that the economy suffered as a result of the war. Manpower and livestock were diverted from production, many never to return. Fields were left uncultivated. A severe inflation disrupted the fragile commercialization of agriculture. Fertile land was lost and the population was further swollen by an influx of 300,000 refugees from territories divided amongst Bulgaria's adversaries. But how severe was the impact of all this on aggregate economic output? Technically speaking, the answer to this question depends on the way in which we link Popov's national income estimate for 1911 to Chakalov's data, which begin in 1924.
As was already evident in Figure 1, according to Maddison, and Good and Ma, the impact of World War I on the Bulgarian economy was nothing short of devastating. In per capita terms Maddison claims a fall of no less than 40 percent between 1913 and 1924. Indeed, if we believe this version of events, virtually the entire interwar period is taken up with the recovery from World War I. The drama of the narrative is further enhanced by the fact that Maddison relies for the pre-1914 period on the highly optimistic growth rates projected by Good and Ma. The result, whether intentional or not, is a narrative of Bulgarian economic development in which World War I acts as an exogenous catastrophe, throwing a country, which had previously been developing at a rapid pace, profoundly off course.
But how solid is Maddison's bridge between 1913 and the early 1920s? For the period after 1924 Maddison is happy to rely on the growth path implied by Chakalov's figures, a choice with which we concur. The key issue is how to relate Chakalov's figures for 1924 to the common benchmark for 1913. If one follows the sources in Maddison's appendices, one is led back to the heavily revised 1957 edition of Colin Clark's Conditions of Economic Progress.50
Clark, Conditions, pp. 105–06.
Neither publication appears in Clark's bibliography and though Gini did publish a number of articles in Metron in 1933, as Clark claims, none of them deal with Bulgarian national income.
To compare 1913 with 1924, we must also allow for territorial changes. As a result of the two consecutive Balkan wars in 1912 and 1913, and despite its involvement on the losing side in World War I, Bulgaria managed by 1919 to increase its overall national territory as a whole by roughly 6 percent. However, the initial gains in the First Balkan War were offset after World War I by the painful loss of the Dobrudja, the most fertile agricultural region. As a consequence, though Bulgaria's overall territory expanded between 1913 and 1919, it suffered a net loss of cultivated land of 6.81 percent.52
Egoroff, “Die Landnutzung,” in Molloff, Die Sozialökonomische Struktur, pp. 105–06.
The result, as is evident in Figure 1 and Table 4, is a dramatic revision of the Clark-Maddison figures. In real terms we find very little difference between Bulgarian national income in 1911 and 1924, once we allow for territorial changes. The difference in per capita terms is entirely attributable to the continuing growth in population. The influx of over 300,000 refugees and the unabated demographic pressure were the factors driving the fall in per capita output.

If such a modest impact of World War I seems implausible we should remind ourselves that 60 percent of Bulgarian GNP was contributed by a largely self-sufficient rural sector, with the rest mainly being contributed by public services and small-scale trades. Agriculture did not depend heavily either on industrial inputs or the intensive application of animal manure. The enforced fallowing of land during the war may actually have increased fertility. According to the official figures the grain harvest was fully recovered by 1925. The harvest of grapes was significantly larger by the early 1920s than in the immediate prewar period. The production of tobacco, the new cash crop of Bulgaria agriculture, was ten times greater in 1922–1923 than in 1913. Furthermore, though the figures for the animal herd do show a modest decrease in horse power between 1911 and 1924, Bulgaria's holdings of pigs almost doubled. There can be little doubt therefore that the physical volume of production in Bulgarian agriculture rebounded quickly from the war. Much the same can be said of output in the industrial sector. The number of workers employed in protected industries was 40 percent greater in 1921 than in 1912. Coal output more than doubled between 1913 and the early 1920s.
LAND-SAVING INTENSIFICATION
Nevertheless, the war did mark a turning point in Bulgaria's economic history, but in a different sense from that implied by the Clark-Maddison figures. As compared to the extensive growth model of the prewar years, it is clear that in the course of the interwar years the Bulgarian economy shifted gear. This shift did not become visible in the aggregate GNP figures until the second half of the 1930s. It was obscured by the political turmoil of the 1920s and the 1930s, the impact of the Great Depression, and the subsequent integration of Bulgaria into the German sphere of influence. But the nature of this transition becomes starkly evident if we focus on the main drivers of the story: land, population, and agricultural output.
With World War I Bulgaria reached the limits of extensive growth. After 1914 there was no further extension of agricultural land to compare with that in the decades following 1878. The area under cultivation inched up of course, but not by enough to substantially affect aggregate output. By contrast, rapid growth in population continued for another 15 years, to reach its peak in 1926, the year in which the Bulgarian population registered a record annual crude growth rate of 2 percent. As a result, in the generation after World War I, land to labor ratios were progressively squeezed and farm sizes fell. If there was an era in which Bulgaria was genuinely in danger of tipping over the Malthusian cliff, with population growth outrunning the capacity of the economy to sustain it, it was the 1920s.
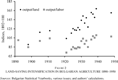
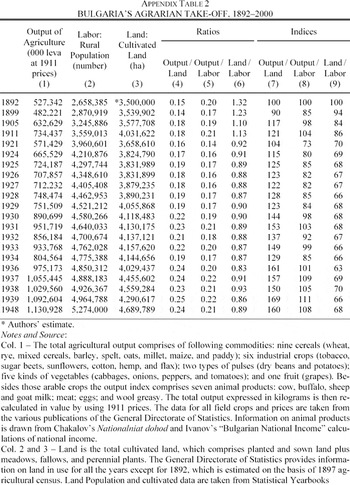
But this was a transitional situation. As economic conditions changed, so did demographic behavior. Beginning in the late 1920s, Bulgaria experienced one of the most rapid demographic transitions on record. By the mid-1930s the rate of population growth in Bulgaria had halved and continued to fall precipitately into World War II. As population pressure on the land intensified, agricultural practices changed as well. With land becoming increasingly scarce, Bulgarian farmers were forced to turn increasingly towards the land-saving strategies of intensification that had characterized the “green revolution” in Western Europe prior to 1914. The significance of this interwar shift is brought out particularly clearly in a long-run perspective offered by Figure 2, which shows an index of gross agricultural output per hectare of cultivated land and per head of rural population stretching from 1890 to 1950.

FIGURE 2 LAND-SAVING INTENSIFICATION IN BULGARIAN AGRICULTURE 1890–1950
As Figure 2 clearly shows, the “take off” in output per unit of land began in interwar period. Taking a four-year average, between 1936 and 1939, returns per hectare were almost 32 percent higher than in 1911, which was by no means a bad year. In 1939 they were fully 40 percent higher and there is no reason to doubt that, but for the interruption of World War II, this trend would have continued, as it was to do in the 1950s.
As Figure 2 also shows, however, this positive trend in per hectare productivity did not translate into an immediate increase in rural standards of living. Per capita output levels struggled to return to their prewar levels for most of the 1920s, an alarming finding given the low levels of income already prevailing prior to 1913. Nor do these figures, which do not distinguish between self-consumed output and marketed output, adequately reflect the savage squeeze on money incomes suffered by the Bulgarian countryside as a result of the worldwide collapse in commodity prices after 1929. There was some rebound in output per capita in the course of the 1930s. However, even then the pre-1913 level was not significantly breached prior to World War II. It was not until the rural population actually began to decline in absolute terms in the early 1950s that per capita output finally took off.
The changes in Bulgarian agriculture in the interwar period did not go unnoticed by contemporaries. The British journalist Hubert H. Tiltman, who traveled widely in eastern Europe, described in admiring terms how Bulgaria was transforming itself from a nation of peasants into a nation of high-value gardeners.53
Tiltman, Peasant Europe, pp. 68–79.
Zagaroff et al., Agricultural Economy, p. 371.
Lampe, Bulgarian Economy.
But one should surely not exaggerate the influence of policy. The most straightforward and compelling explanation for this pattern of lop-sided agricultural advance was simply that Bulgarian agriculture was conforming to the brutal logic of factor proportions. Given the increasing pressure of rural population, it would have been surprising if agricultural productivity growth had not been biased towards land- rather than labor-saving. It was land that was scarce not labor, and peasant families adjusted accordingly.
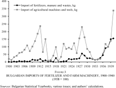
Capital accumulation was certainly part of this story of land-saving intensification. The import of agricultural machinery, interrupted by World War I, was resumed in the 1920s. Most significantly, as we have already noted, there was a sustained investment in new ploughs. Whilst providing rewards from deeper tilling, these also demanded a significant increase in the quantity of labor per hectare. This flow of modernizing equipment was slashed during the depression, as a result of the collapse in the money earnings of agriculture. However, imports revived rapidly in the 1930s and they were now accompanied by an unprecedented import of artificial fertilizers as well (see Figure 3).

FIGURE 3 BULGARIAN IMPORTS OF FERTILIZER AND FARM MACHINERY, 1900–1940 (1938 = 100)
The common source of both crucial inputs to Bulgarian agriculture was Germany. Though the clearing system instituted in Bulgarian-German trade in the 1930s, was in many ways unsatisfactory to Bulgaria, Hitler's Germany did at least offer a large and secure market for Bulgarian agricultural exports, which was not available elsewhere. And this in turn facilitated a marked shift in the composition of Bulgarian agricultural output.
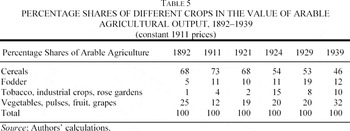
As before 1914, Bulgarian farmers in the interwar period showed remarkable flexibility in responding to market signals. In the 1920s Bulgarian farmers had shifted rapidly into tobacco, a crop particularly suited to the soil and climate of some of the poorest areas of the country. In the 1930s, following the collapse of global tobacco prices, a new phase of diversification brought a shift into fruit and vegetables. This latter move, of course, was fully in line with the trend towards land-saving, labor-intensive farming. And as in Italy, where farmers had pursued this line since the late nineteenth century, it produced rising yields per hectare amidst substantial rural poverty (see Table 5).56
O'Brien and Toniolo, “Poverty.”

Given its limited impact on per capita incomes, the progress in output per hectare in Bulgarian agriculture in the 1920s and 1930s was hardly a recipe for general economic development. It was, at best, a rational response to the increasing pressure of population on a limited stock of land. What was crucial therefore was that Bulgaria was, by the interwar period, capable of combining a new pattern of more labor-intensive agriculture with a sustained investment in human capital.
By the 1930s Bulgarian society began to reap the benefits of two generations of investment in mass literacy. The results were spectacular. For the early years following independence, Bulgarian education statistics show that literacy did not exceed 10 percent. The situation was particularly severe for women, of whom in the 1890s only 6 percent knew how to read. By 1900 general literacy had risen to 18.4 percent. By 1934, 55 percent of the population were literate. The 1946 census recorded almost total literacy for both sexes (91.7 for male and 91.8 for female).57
Mishkova, “Literacy.”
CONCLUSION
Writing on the eve of World War II from the School of Slavonic Studies in London, Doreen Warriner outlined three alternative avenues for the modernization of peasant Europe.58
Warriner, Peasant Farming.
What the data presented here suggest is that the superficially disappointing performance of the Bulgarian economy up to the 1930s should not lead one to dismiss this third, liberal option too easily. It may be tempting to infer from the slow growth of much of Europe's periphery up to the 1930s, that the case for radical, indeed coercive, measures was unanswerable. However, we should be careful not to dismiss the crucial steps towards rural modernization that are evident on closer inspection. Though performance in per capita income terms in the 1920s and 1930s was indeed disappointing, Bulgarian society underwent three key shifts. Firstly, Bulgaria's agricultural economy broke with decades of extensive development and began to move decisively towards intensification. Secondly, Bulgaria underwent virtually complete demographic transition, in the space of only three generations. Thirdly, between 1900 and 1945 Bulgaria achieved virtually complete mass literacy. Before the advent of a strategy of state-centered economic policy, three vital preconditions had already been established for accelerated growth.
Appendix 1: Bulgarian GNP, 1892–1924

Appendix 2: Bulgaria's Agrarian Take-Off, 1892–2000

We thank Şevket Pamuk and Roumen Avramov for reading the article. We are grateful for the support provided for our research by a British Academy South East European Joint Project award.