Introduction
Several mechanisms of glacier calving have been described (Hughes, 1992; Van der Veen, 1995), though their fundamental controls and relationships with calving rate remain poorly known (Warren and others, 1995a). This makes it difficult to explain the climatic sensitivity (or lack of it) of different glaciers, particularly the order-of-magnitude difference in calving rate between tidewater and lake-calving glacier-termini (Warren and others, 1995b). Lake-calving glaciers have received little empirical study. In this paper, we examine the case of the grounded ice cliff of a temperate glacier subject to “normal slab calving” in the sense used by Hughes (1992). The aim is to discover the short-term processes operating at the ice cliff which influence the style, magnitude and rate of calving.
The accepted mechanism for “normal” slab calving involves the development of an overhang prior to failure (Iken, 1977; Vischer and others, 1991; Hughes, 1992), which most authors explain as resulting from deformation of the glacier close to the ice cliff due to unrelieved tensile stresses related to the glacier terminus geometry. Englacial shear bands (small normal faults) have been observed and explained as an expression of forward bending of the cliff (Hughes and Nakagawa, 1989). Sequential profiles of such calving cliffs demonstrate rotation of the cliff profile about the base, as tensile stresses associated with forward bending cause surface crevasses to propagate downwards, defining the size and shape of calved ice blocks. In invoking such a process, Iken (1977) assumes that the glacier terminus is frozen to the bed to create the necessary stress differential between glacier surface and sole, and other observations of the process (Hughes and Nakagawa, 1989) are from cold-based glaciers. We tested the forward-bending hypothesis on a temperate sliding glacier more typical of those in mid-latitude regions.
Methods
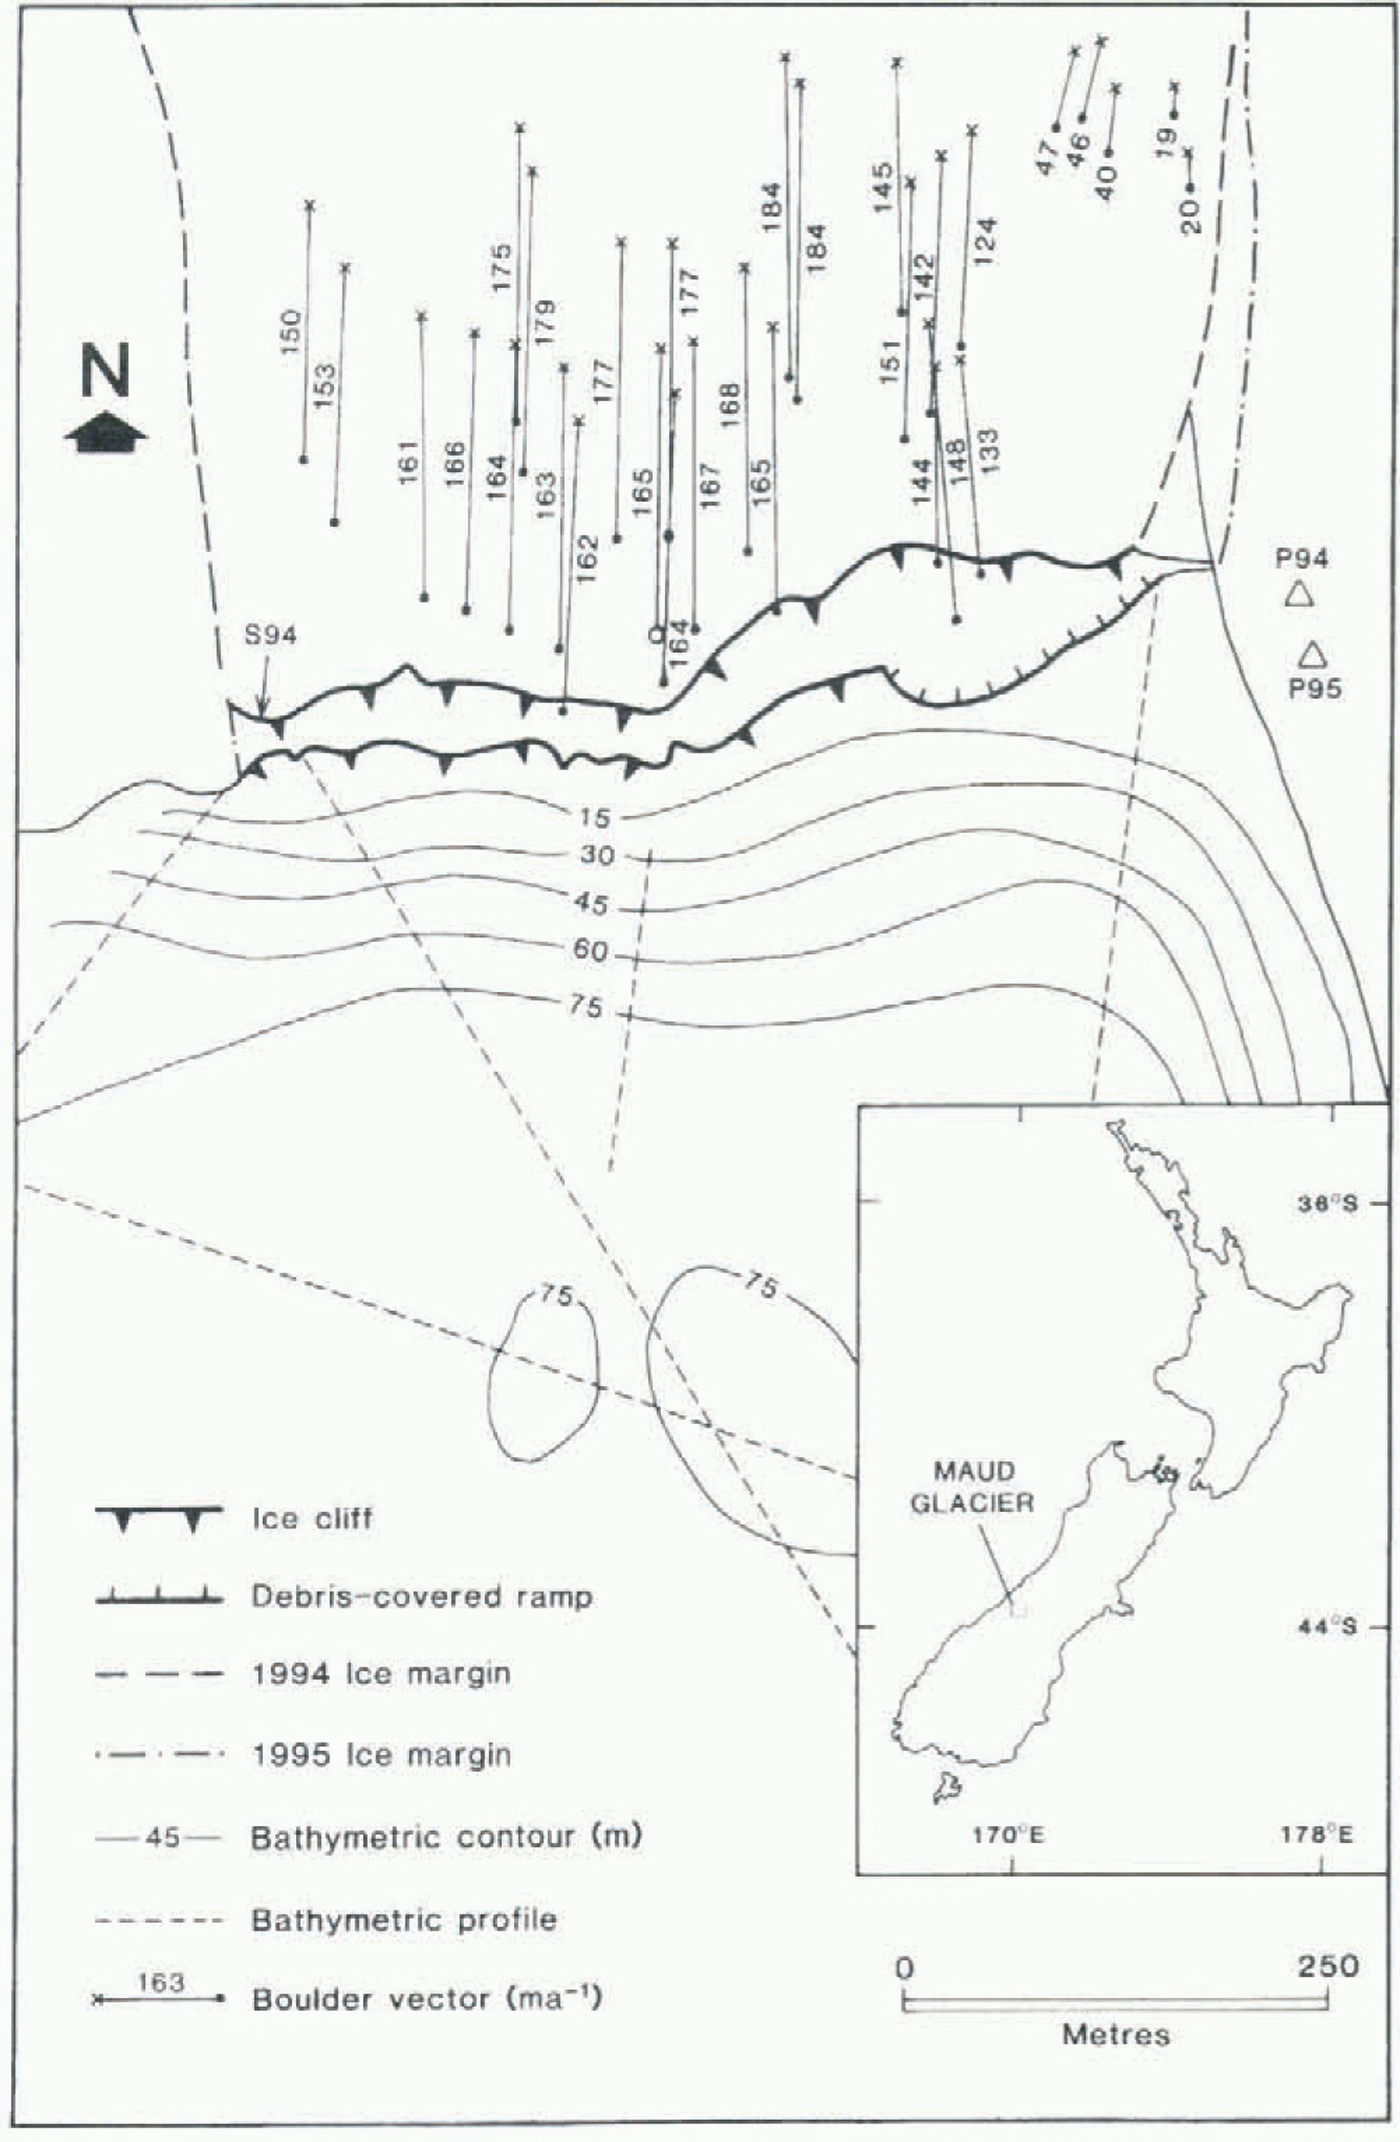
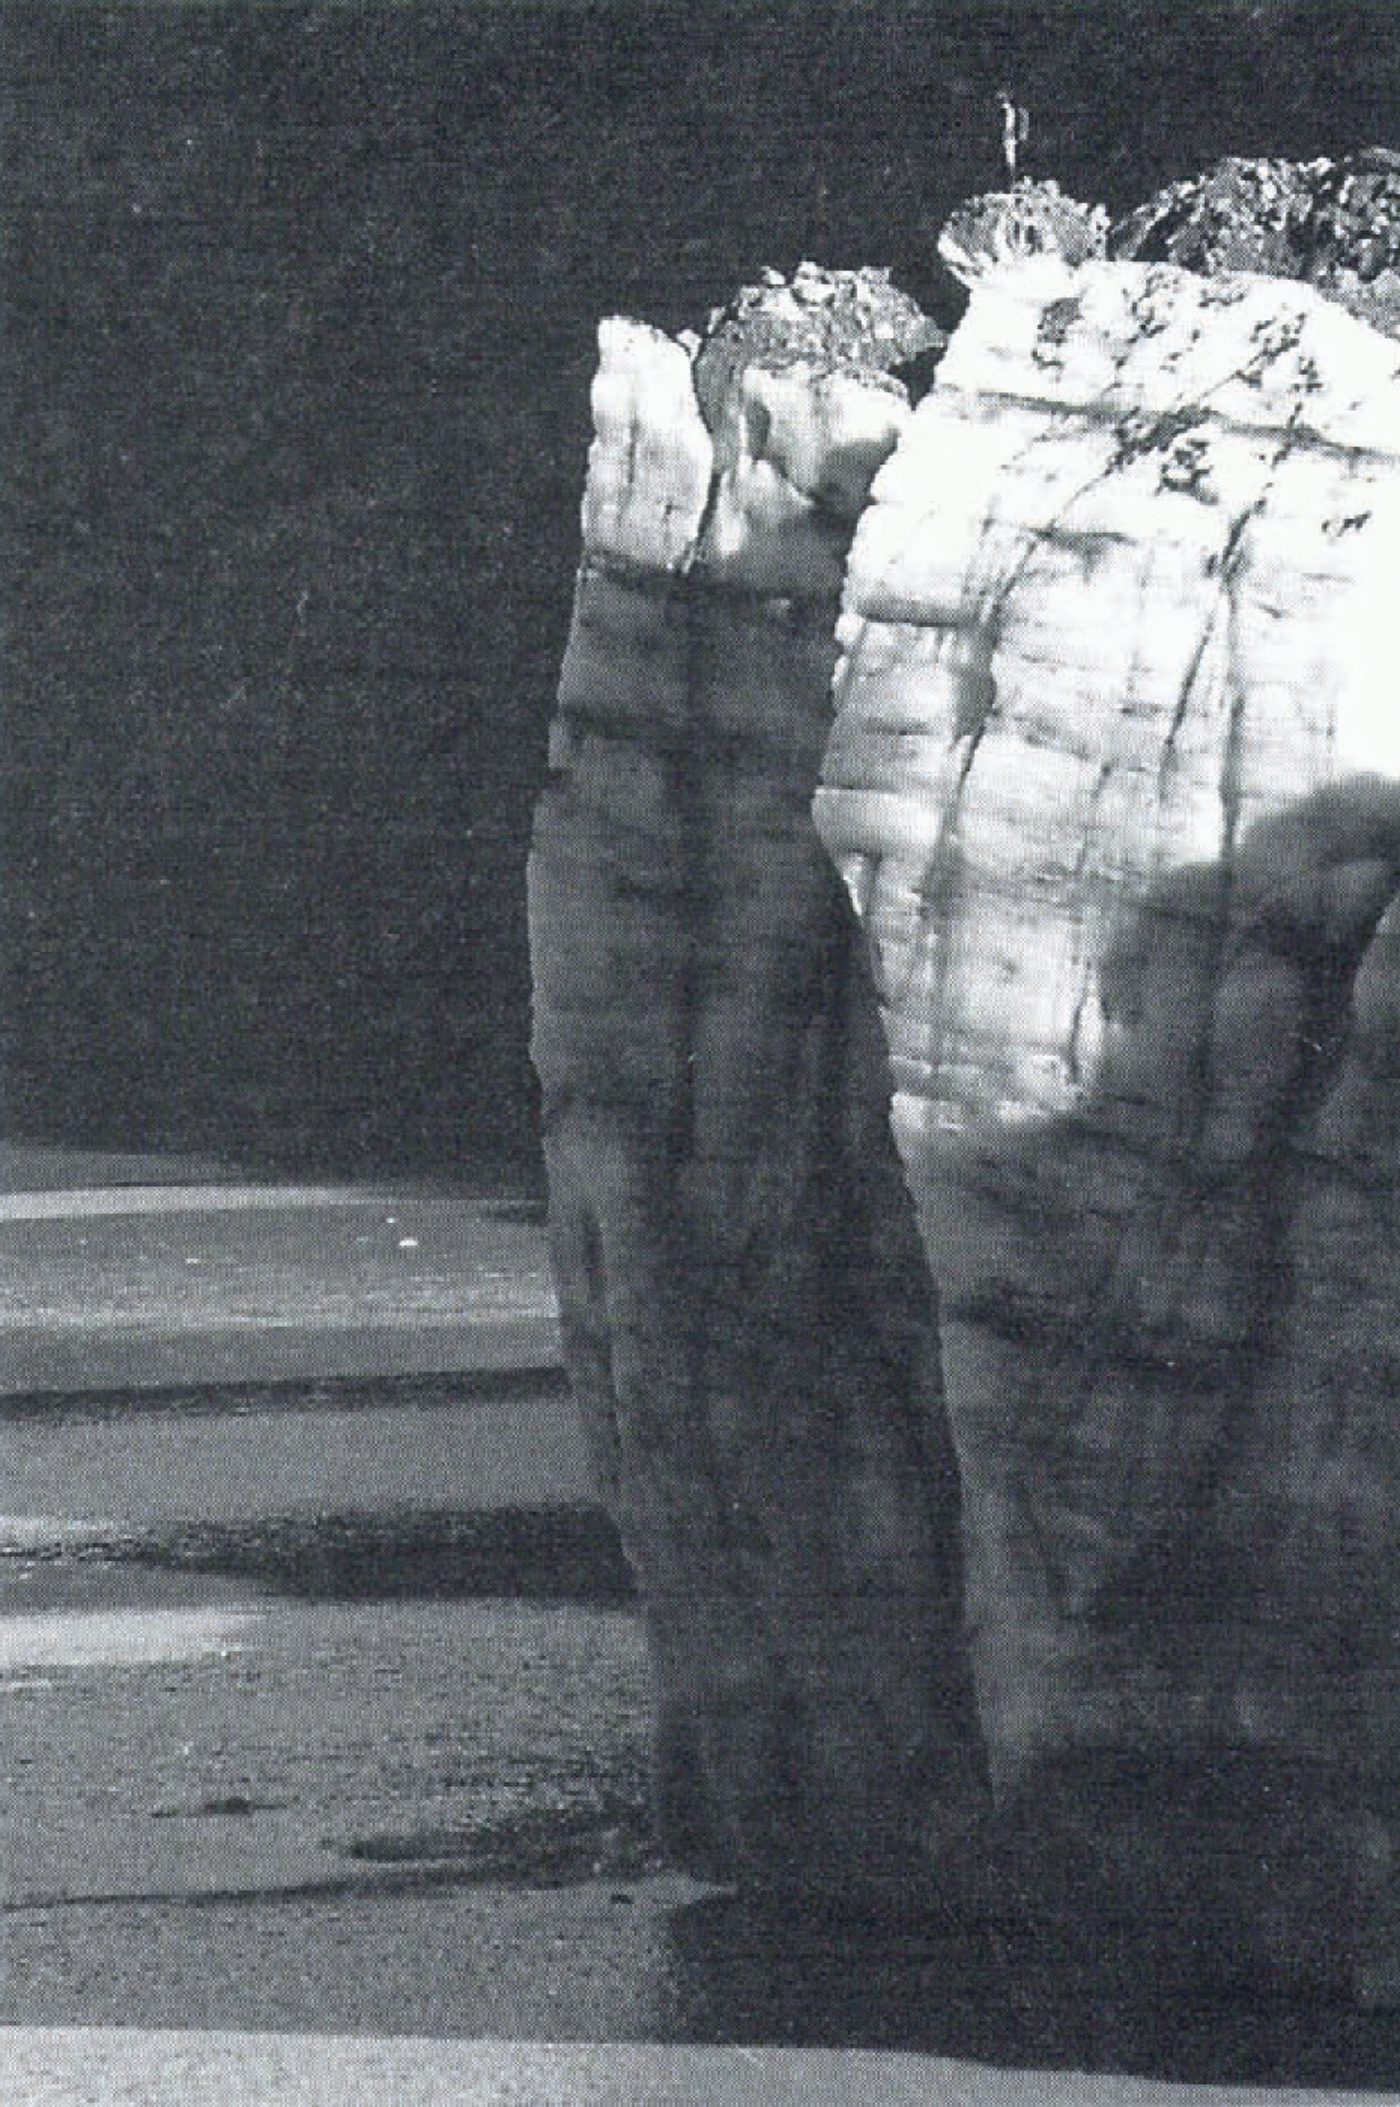
Maud Glacier (43°28ʹ S, 170°30¹ E) lies immediately east of the main divide of the Southern Alps, New Zealand. After many decades of retreat (Kirkbride, 1993), a readvance began in the early 1990s. The glacier terminates in a near-vertical ice cliff up to 39 m high and about 600 m wide, which in plan view forms a chevron projecting into a progiacial lake 26 m deep at 60 m distance from the cliff (Fig. 1). Extrapolation of bathymetric profiles suggests a water depth of < 15 m at the cliff itself, above a projecting ramp of subaqueous ice (see below). The glacier is inferred to be about 75 m thick in the vicinity of the ice cliff. The base of the south-facing cliff is 1035 m a.s.l. The apex of the chevron is a prow of ice which is well seen in profile from the lateral moraine to the east (Fig. 2). The glacier itself, in common with others in the region, is heavily debris-mantled and was covered by two large rock avalanches in 1991 (Evans and Clague, 1994). Ice-front morphology was observed from both the glacier surface and the lake, and measurements of velocity and crevasse pattern supplement the photo survey.
From a fixed point on this moraine, repeat transparency photographs at a focal length of 210 mm were taken at intervals of 0.25–7 d in the austral autumns of 1994 and 1995. Precise ice-cliff profiles were constructed by tracing successive outlines from projected colour slides at a scale of 1: 60. Each image could be accurately positioned with respect to the previous photograph by using background features for reference. A different fixed point was used each year as the glacier advanced. Glacier surface velocities were obtained using three methods. First, short-term velocities were derived from the measured movement of between two and eight supraglacial boulders on each sequential pair of colour slides. Examination of aerial photographs showed that the photograph plane diverged by 5° from the flow vector in both years (Fig. 1), so that the velocities derived from terrestrial photogrammetry
Map of the, terminus region of Maud Glacier showing locations of photo stations, ice cliff in 1994 and 1995, markers used for velocity surveys, and ice-proximal bathymetry based on echo-sounding survey. Boulder vector shown by open circle was surveyed in the field: the rest were measured by aerial photogrammetry. Site of ablation stake in 1994 marked “S94”. Map drawn from corrected near-vertical aerial photographs taken on 16 April 1994 and 6 March 1995. Inset: location of Maud Glacier.
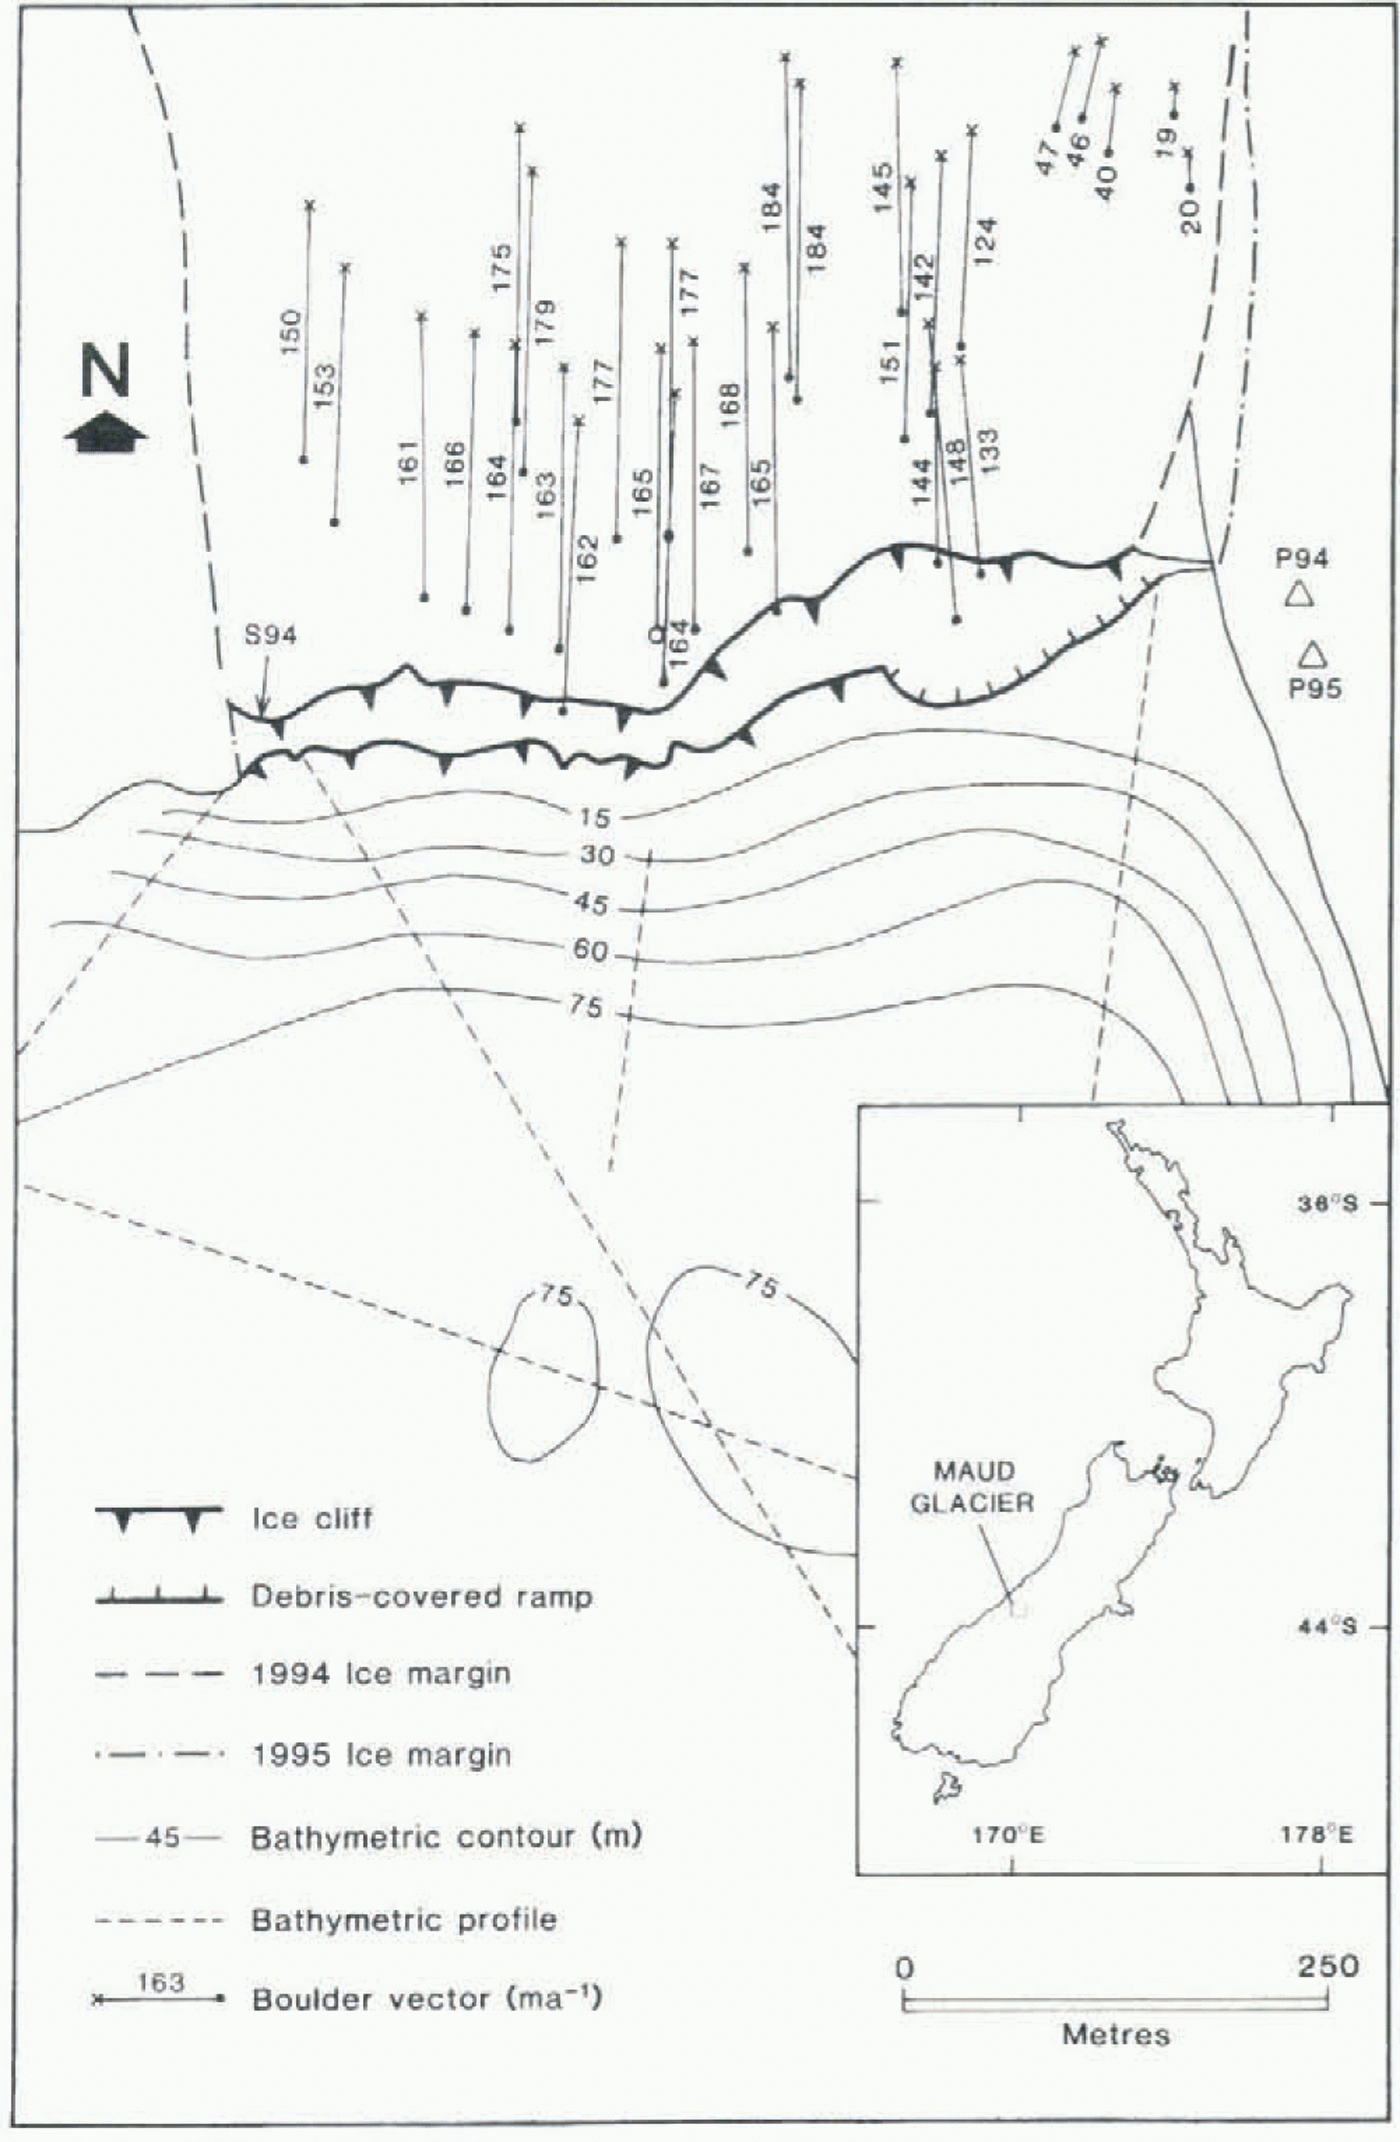
underestimate true velocities by (a negligible) 0.38%. Secondly, electronic-theodolite measurement of glacier velocity at five points along the ice-cliff crest was carried out over intervals of several days. One marker was established in the glacier centre 210 m from the ice cliff in 1994, and was relocated in 1995 to give a measure of annual centre-line velocity (Fig. 1), Thirdly, annual velocities were calculated from aerial photogrammetry of the displacements of over 100 supraglacial boulders identifiable on near-vertical photographs taken from a light aircraft. Boulders close to the ice cliff are illustrated in Figure 1. Photo distortion was adjusted using ER Mapper computer software, and fixed points on the lake shore and moraine. Lake stage was measured against markers on large shoreline boulders. Daily meteorological observations are made at the National Park headquarters in Mount Cook village (765 m), 44 km to the southwest at a similar location leeward of the main divide. Rainfall was also collected in a portable gauge 1.2 km southeast of the ice cliff Ice-cliff ablation was measured at one site in 1994, where access to mid-height of the western end of the ice cliff was
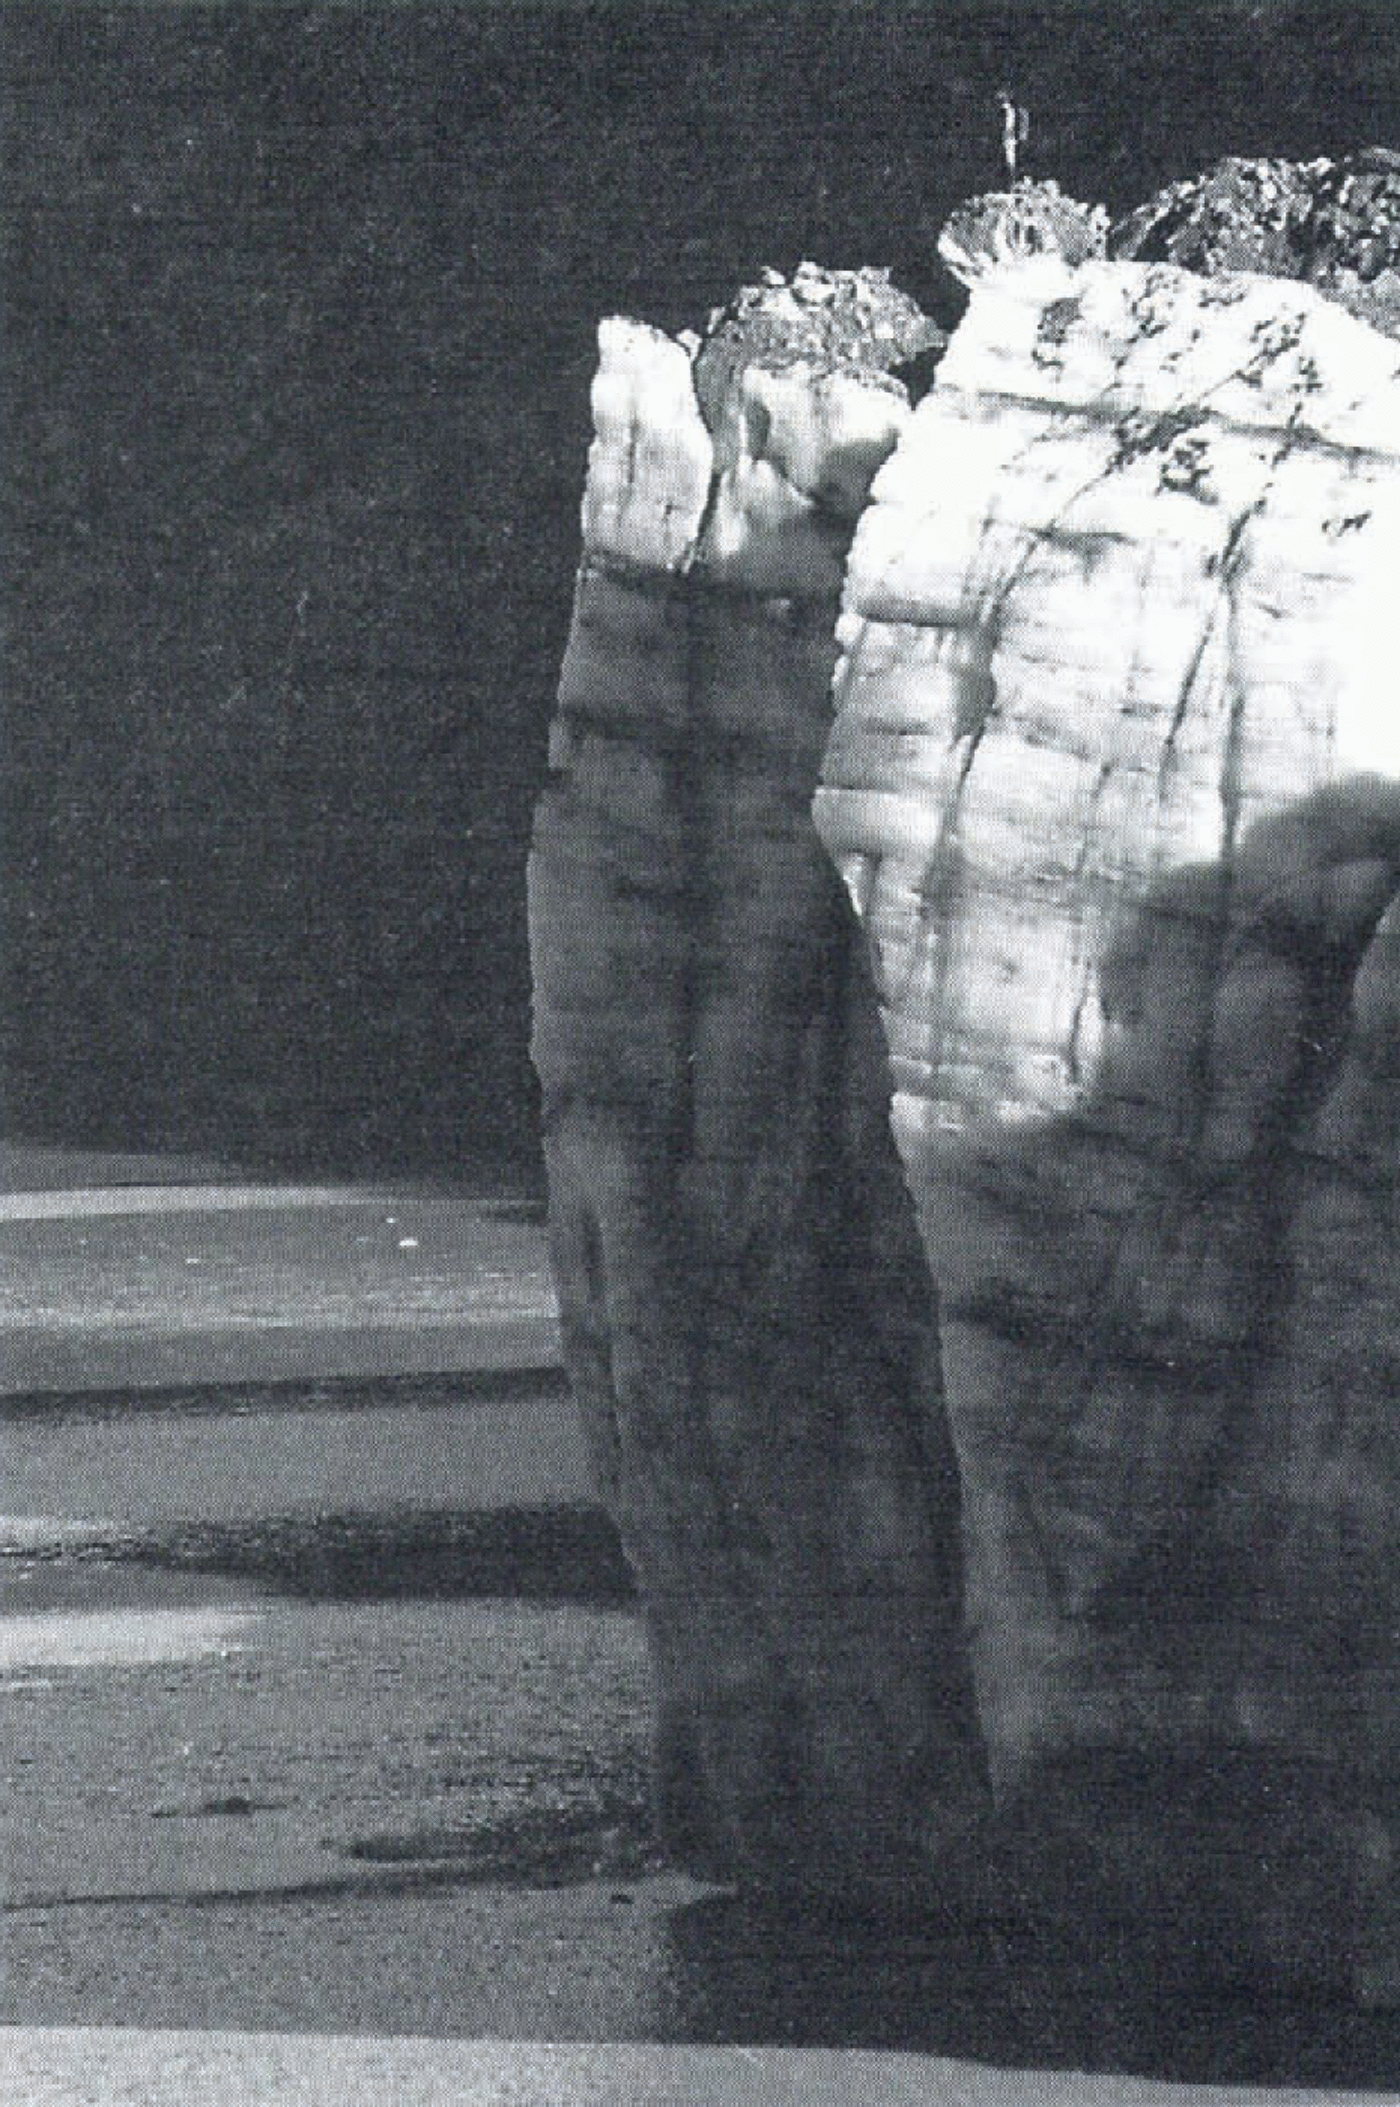
Maud Glacier ice cliff from the photo station on 24 March 1995, showing the profile illustrated in Figure 3. Note the waterline notch and the overhang of the lower two-thirds of the cliff height. Person on glacier for scale.
possible along a ledge. One stake was drilled horizontally into vertical ice. No safe access was possible in 1995.
Results
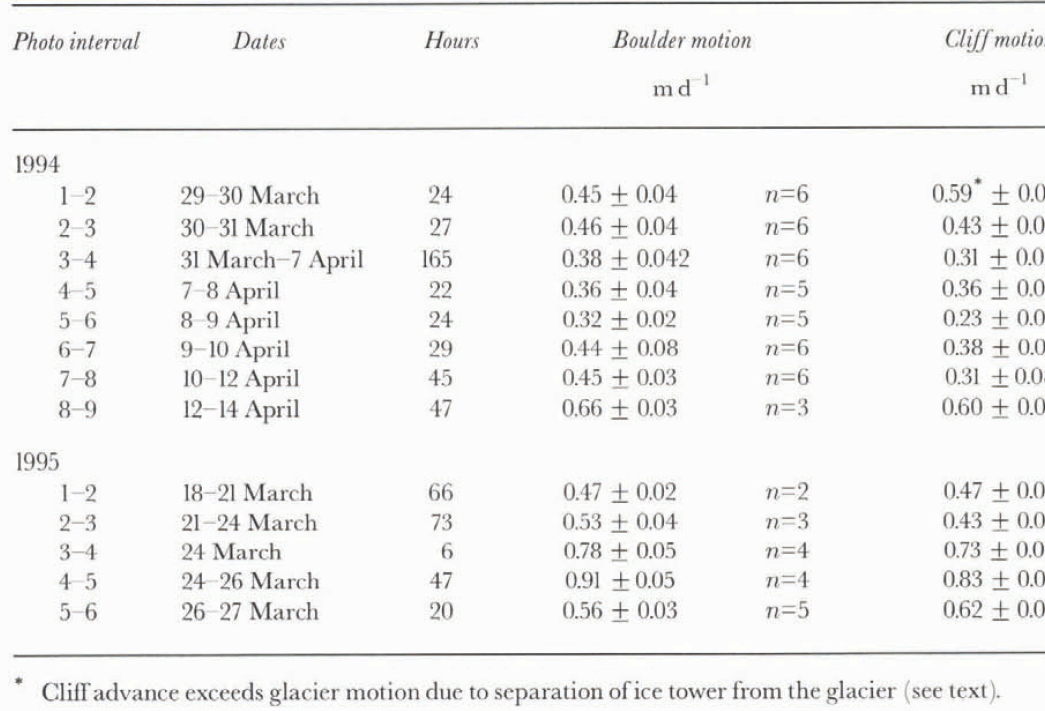
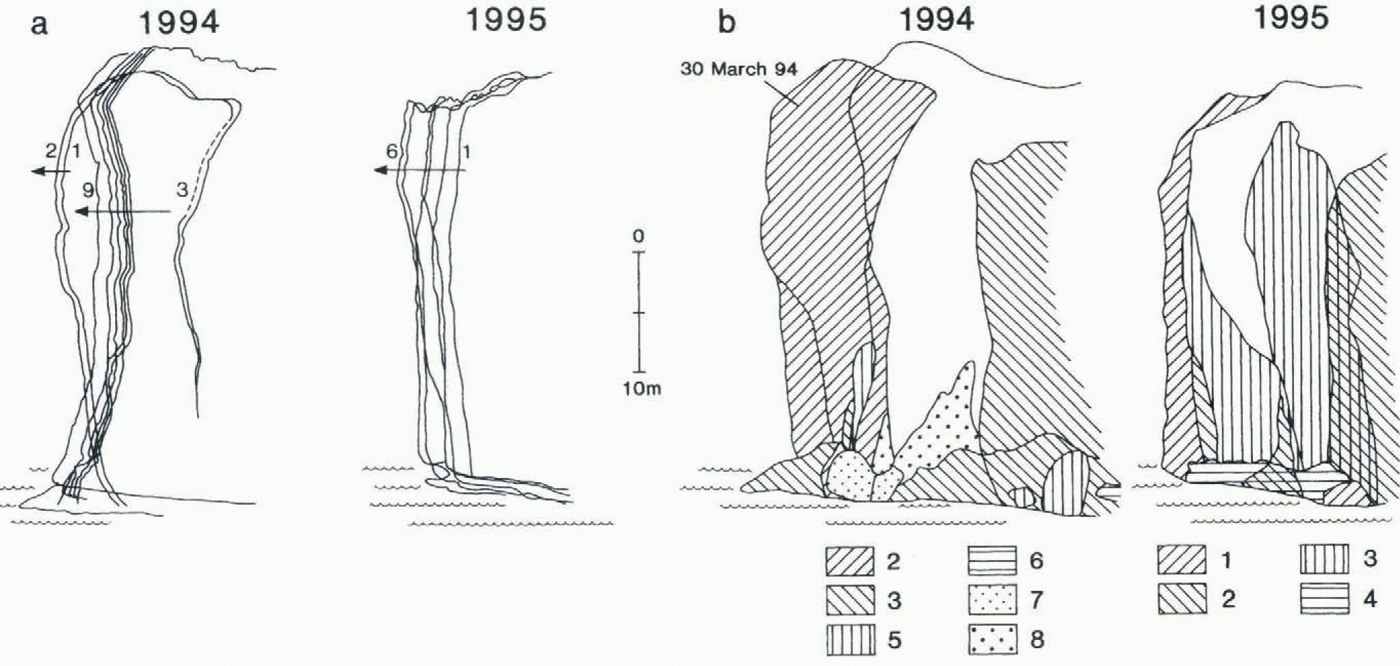
Ice-cliff profiles are illustrated in Figure 3, and temporal changes to glacier motion, frontal advance, lake levels and precipitation in Figure 4. The 1994 study period was marked by fine, dry weather except for three rainstorms which caused the lake surface to rise 0.88 m by the end of the 16 d observation period. A total of 85 mm of rain fell at Mount Cook during this period. The 1995 season was extremely wet; 683 mm of rain fell at Mount Cook in the 11 d of study, including 188.3 mm on 25 March. On the same day, 299 mm was recorded in 14 h in the portable gauge. Lake levels rose by over 1.4 m between 17 and 26 March.
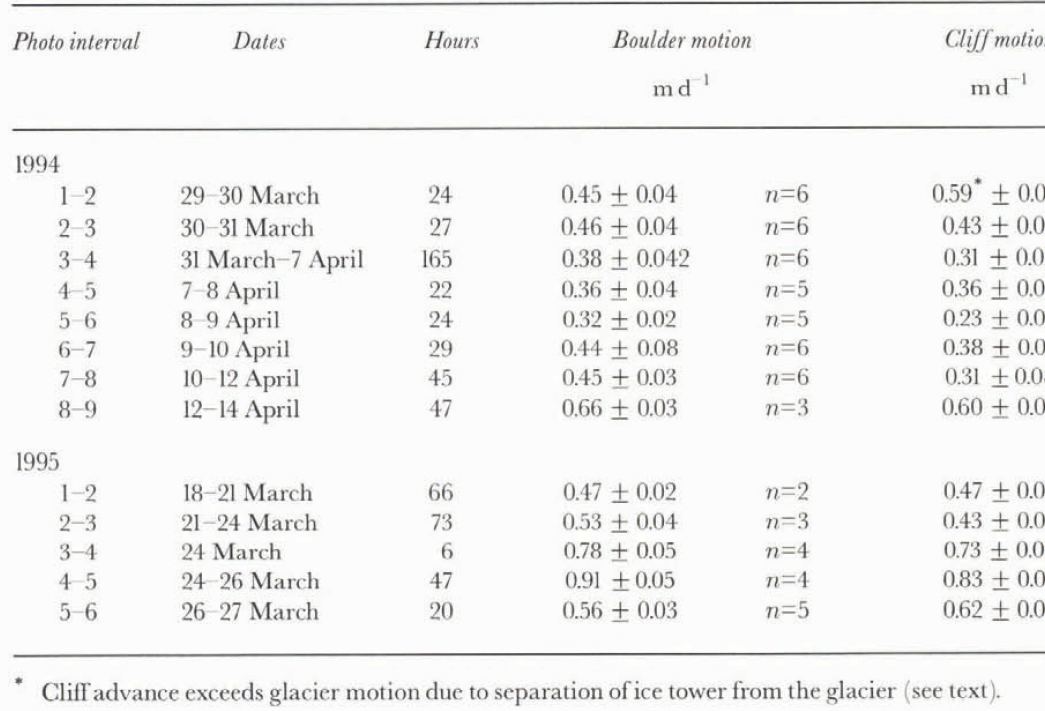
Short-term ice velocities averaged 0.43 m d−1 in 1994 (within a range of 0.32–0.66 m d−1), and 0.65 m d−1 in 1995 (0.47–0.91 m d−1) (Table 1; Fig. 4). Annual velocities are shown in Figure 1. Extending flow only occurs immediately behind the ice cliff and, from our observations at several glaciers, usually creates a single crevasse within 5 m of the cliff edge. At Maud Glacier, aerial photogrammetric measurements (Fig. l) revealed compressive flow with a longitudinal strain rate of −0.121 m−1 between 15 March 1994 and 6 March 1995. Short-term glacier motion varies dramatically with hydrological changes, but appears neither to affect nor to be affected by calving events. Velocities double during and after rainstorms and high lake stages, associated with uplift
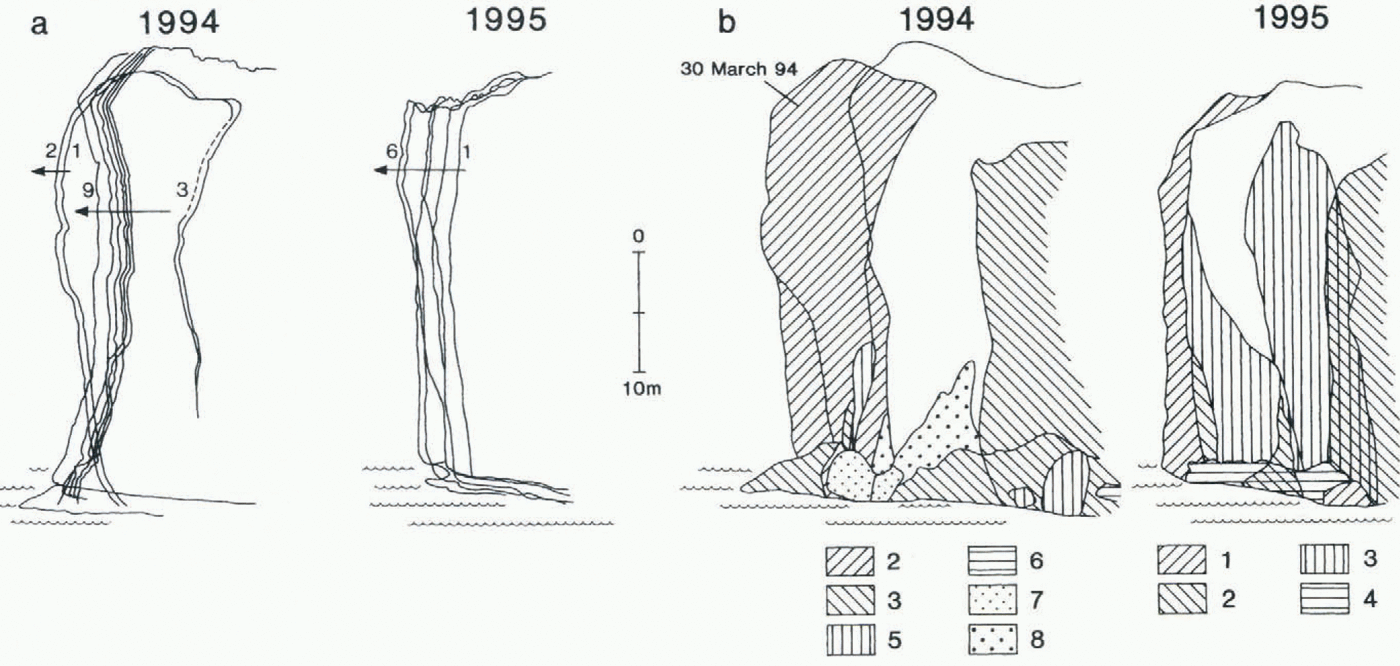
(a) Short-term changes in ice-cliff position traced from superimposed colour slides. Numbers refer to order of photographs: 1994:1=29 March; 2=30 March; 3=31 March; 4=7 April; 5=8 April; 6=9 April; 7=10 April; 8=12 April; 9=12 April. 1995: 1=18 March; 2=21 March; 3=24 March; 4=24 March; 5=26 March; 6=27 March, (b) Distribution of ice calved from the cliff. Numbers refer to periods between photographs. The calving event of 31 March 1994 is indicated (see text).
Time series of glacier surface change, velocity, ice-cliff advance and lake stage for Maud Glacier in the 1994 and 1995 austral autumns. Numbers in italics refer to photographs (see Fig. 3a caption). Dashed lines show surface velocity measured by theodolite survey. Precipitation data are from Mount Cook village.
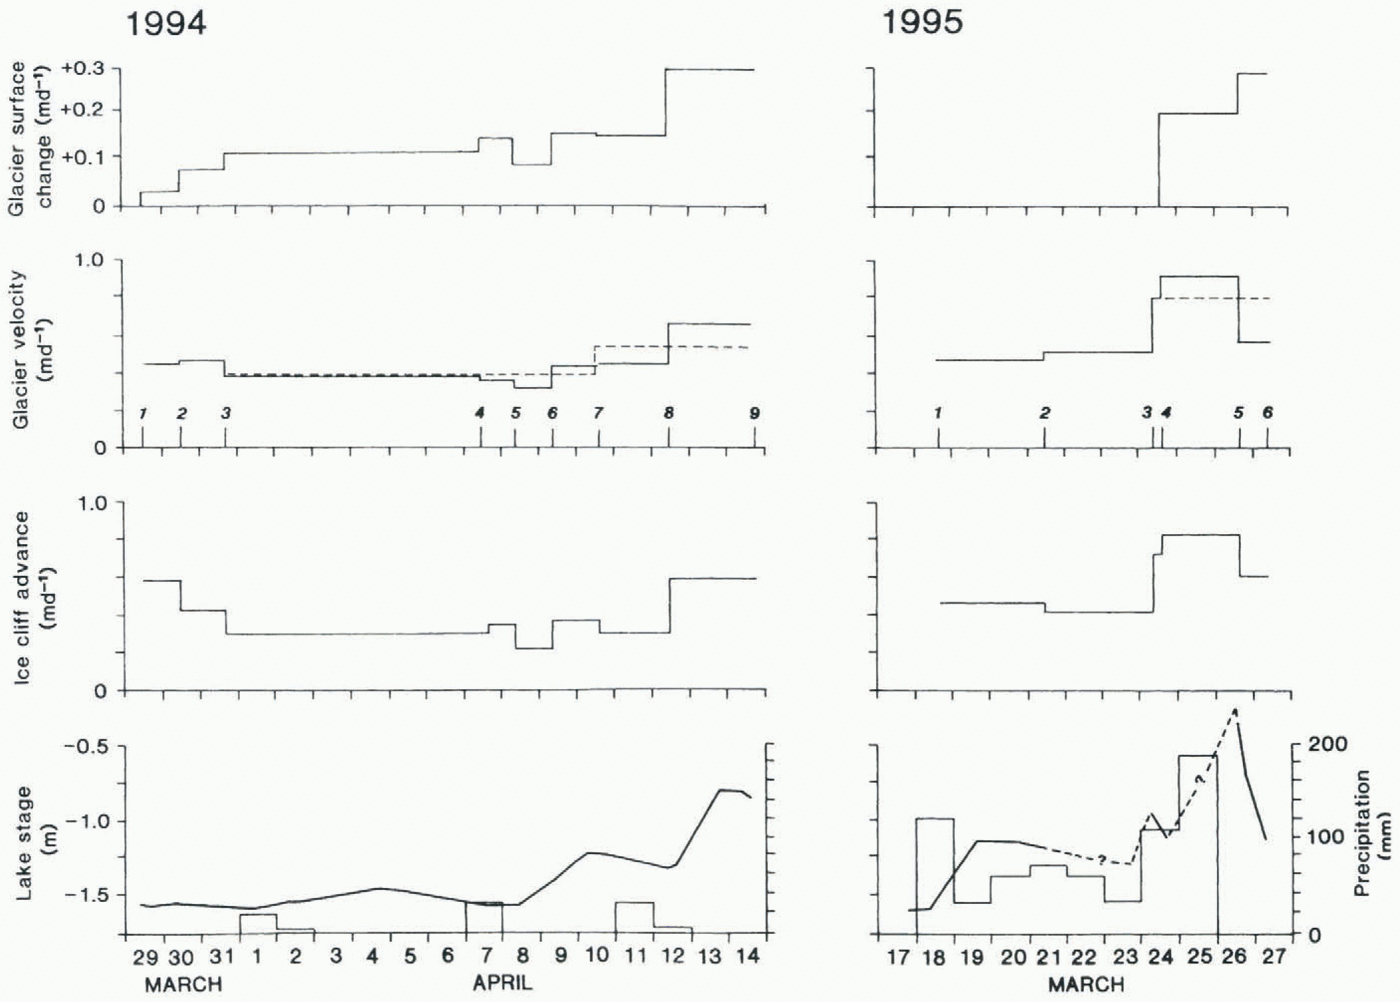
of the glacier surface of up to 0.2 m, implying rapid increases in subglacial water pressures and increased bed separation (Iken and others, 1983). However, there is no evidence that calving frequency is related to short-term hydrological change. Ice velocity and lake stage, averaged over each interval between measurements, show strong positive correlation when lake stage is constant or rising (r 2 = 0.80 at the 99.9% significance level). Regression of the two variables shows that glacier velocity increases by 0.52 mm d−1 for every millimetre rise in lake level, over the observed range of variation.
In between calving events, the advance of the ice cliff was slower than the glacier velocity because of melting of the ice cliff, which averaged 69 mm d−1 based on the difference between surface velocity and change in cliff profile. The ablation stake recorded surface loss of 31–91 mm d−1 between 2 and 12 April 1994, averaging 50 mm d−1 over a period of predominantly fine weather. Overall, the melt rate of the cliff is only half the rate recorded at a stake on the gently sloping bare ice of nearby Grey Glacier, and an order of magnitude less than ice motion. In intervals when calving has not altered the cliff profiles, the photo series shows parallel advance of the ice cliff (Fig. 3a). There is no evidence for rotation of successive profiles (indicating forward bending of the cliff above the waterline) or for local flow extension as precursors to toppling failure similar to those illustrated by Hughes (1992). Nor is there any evidence of associated englacial shear bands (cf. Hughes and Nakagawa, 1989).
The calving itself can be categorized into four sequential stages, based on our observations over 27 d.
(1) Calving at the waterline. The smallest and most frequent events involved the detachment of ice within about 2–5 m of the waterline. Commonly, these events removed small aprons and pedestals of frozen ice breccia left after larger calving events. Calving followed thermal erosion along the waterline, which created a horizontal notch undercutting the ice cliff by 3–4 m after a few days. The almost horizontal overhang of the notch roof commonly calved to form a 45° overhang. Calving volumes are estimated at only a few cubic metres of ice.
(2) Flake calving from cliff face. On several occasions, thin flakes of ice detached from intermediate positions on the ice cliff. Flakes were less than 1 m thick but up to about 22 m in the longest dimension. Calved ice volumes were of the order of 102–103 m3.
(3) Full-height slab calving, in which bergs are defined by near-vertical surface cracks propagating downwards a few metres behind the ice cliff. Typically, ice volumes of the order of > 103 m3 are involved. Full-height events invariably left a pedestal of ice breccia at the basal “hinge zone” close to the waterline, resting on a platform of ice just below the lake surface. This platform is formed by retreat of the subaerial part of the glacier terminus.
The event of 31 March 1994 (Fig. 3b) was observed from the initiation of toppling failure. Prior to calving, inspection of the glacier surface revealed a single deep crevasse about 5 m back from the cliff edge, defining a tower of ice which overhung for 75% of its height, and by 8 m. On the day prior to calving, the tower was advancing at 24.6 mm h−1 while glacier velocity up-glacier of the crevasse was only 18.9 mm h−: the tower was separating from the cliff behind. Profiles (Fig. 3a) show parallel advance of its leading edge and no evidence of rotation, This indicates translatory motion along a developing shear plane or zone close to the waterline, and that progressive failure along the plane caused the tower to move out from the glacier front. Then, following further steepening of the overhang by flake calving and crack growth within the previous 23 h, it toppled outwards. A pedestal of ice breccia close to the waterline was left resting on a platform of ice just below the lake surface.
(4) Subaqueous calving. It is implicit in the thermal undercutting mechanism that cliff retreat above water is faster than that below water. Thus, a submerged ice foot must project lakewards from the base of the ice cliff. At Maud Glacier on 27 March 1995, several bergs rising to the lake surface were observed from a boat on the lake. The bergs were large in comparison to even the largest bergs produced
from slab calving. They broke the lake surface at distances of up to 200 m from the ice cliff, from water ≥75 m deep and across most of the width of the glacier front. Most likely, the bergs detached from a submerged, projecting ice loot. Bathymetric surveys reveal ramps in front of Maud, Grey and Hooker Glaciers. At Maud Glacier (Fig. 1), the ramp descends at an angle of 20–30°. Lake floor morphology is therefore also consistent with a submerged ice foot.
The distribution of calving of the first three types from that part of the subaerial ice cliff visible on repeat photographs is shown in figure 3b. Shaded areas represent ice identifiable in one photograph but missing in the subsequent image. Many small calving events and several larger ones were seen. Other events, not observed, were obvious from their effect on the morphology of the ice front. The pattern of calving varies from the waterline to the crest of the cliff Close to the waterline, calving is relatively frequent, and resultant berg volumes are only a few cubic metres. With increasing height, calving becomes less frequent, but bergs become larger. Over the 27 d of observations, 17 identifiable calving events affected the lower 25% of cliff height, and direct observation showed that they were much more common than this statistic suggests. In contrast, only five identifiable events extended from the cliff top.
The four calving types are linked, whereby initially a notch is created which then “grows upwards” by flake calving. Eventually a geometry is established whereby most of the cliff overhangs, a condition conducive to crevasse propagation and full-height slab calving. This recreates a vertical profile to the waterline, and begins another cycle of waterline melting and pedestal removal, flake calving and then slab calving. Many such cycles would form a submerged ice foot, which calves infrequently.
Discussion
An outstanding research question in the study of calving lies in the marriage of statistical correlations with process explanations. Correlations between calving velocities (v c) and other variables vary according to time-scale. Thus, annual variations in v c show significant correlations with width-averaged water depth at the terminus (h w), in both tide- and freshwater (Brown and others, 1982; Funk and Röthlisberger, 1989; Warren and others, 1995b), while seasonal variation in v c has been correlated with the discharge of meltwater from the tidewater Columbia Glacier (Sikonia, 1982). The notch mechanism described in this paper over the weekly time-scale is similarly anticipated to vary seasonally according to lake surface temperature, where winter caking into frozen lakes is suppressed and summer caking enhanced by rapid notch formation in surface water warmed to ≥12°C (Claridge, 1982). Examination of many winter photographs of the Mount Cook glaciers shows no evidence of calving into ice-covered lakes. While the notch mechanism describes short-term calving behaviour, it cannot be extrapolated to explain the V c/h w, relationship of Funk and Röthlisberger (1989) and Warren and others (1995b), because notch formation is influenced by lake surface conditions (surface water temperature and current velocity). Either water depth exerts no control on calving at Maud Glacier, or another mechanism as yet unidentified must operate on longer time-scales. Multi-annual study of short-term processes at lake-calving glaciers is required to bridge the gap between short-term process and statistical correlation at the annual scale.
One proposed mechanistic link with water depth is Hughes’ (1992) bending creep mechanism, identified at a calving ice cliff whose base did not stand in water (Hughes and Nakagawa, 1989). However, this does not appear to be the rate-controlling mechanism at Maud Glacier, because the full height of the ice cliff calves too frequently to allow bending creep to create the shear bands and overhang which are the precursor to failure. We have shown how the overhang develops by small-scale calving of the notch roof in response to waterline melting, and repeat photography between calving events shows no evidence of gradual flow-induced overhang development. The relevance of the bending creep mechanism to temperate lake-calving glaciers must therefore be questioned.
Finally, at sites where the rate of calving is controlled by waterline melting, interannual variation in calving rate is likely to be limited. Because ice velocity at the Maud Glacier ice cliff exceeds ablation by an order of magnitude, the advance or retreat of the cliff is predominantly a response to changes in glacier velocity, in turn governed by mass-balance induced thickness variations. Therefore, although the transition from a non-calving to a calving terminus may produce more negative mass balance (Kirkbride, 1993), lake-calving glaciers may continue to fluctuate in response to climatic variability at the interannual scale. This is typically not the case for tidewater glaciers (Brown and others, 1982).
Conclusions
There is no direct evidence for a forward-bending mechanism at the Maud Glacier ice cliff, and the absence of shear bauds disrupting ice foliation close to the cliff supports this conclusion. Our results demonstrate that at the terminus of Maud Glacier an overhang develops by progressive calving up from waterline, culminating in full-height slab calving, following a cyclic pattern over several weeks at a rate depending on the rate of thermal erosion at the waterline. A longer-term cycle involves calving of the submerged ice foot formed by subaerial ice-cliff retreat.
Acknowledgements
This research was funded by U.K. Natural Environment Research Council grant GR9/1199. We are grateful to V. Brazier, A. Hayward, K. Humphreys and S. Warren for valuable preparation and field assistance, and to R. Bellringer and the staff of Mount Cook National Park for permission to carry out the research and for their help at all stages of the project. We gratefully acknowledge R. DeLuca and T. Chinn of the Institute of Geological and Nuclear Sciences, Dunedin, for logistical support in 1994. The manuscript benefited from comments by two anonymous referees.