Implications
Meat quality traits have increasingly attracted more attention due to the selection for high growth rate and lean meat deposition. The muscle fibre characteristics play a key role in meat quality. The contractile protein troponin I (TnI), a constituent protein of the troponin complex located on the thin filaments of striated muscle is encoded by a multigene family. Three isoforms of TnI are known and each is expressed in a muscle fibre-type specific manner. TnI slow- and TnI fast-twitch isoforms are expressed exclusively in slow-twitch and fast-twitch skeletal fibres, respectively. TnI slow has been used as a model gene to study mechanisms of slow fibre-specific expression. However, very little is known about the temporal expression of the porcine TnI genes during muscle development until now. This study provided the TnI genes expression and laid the foundation for future research on the TnI genes as the model gene to study mechanisms of muscle fibre-specific gene regulation.
Introduction
Troponin I (TnI) is a constituent protein of the troponin complex located on the thin filament of striated muscle that provides a calcium-sensitive switch for striated muscle contraction. Troponin proteins associate with tropomyosin and regulate the calcium sensitivity of the myofibril contractile apparatus of striated muscles. Troponin was shown to be a complex of troponin C, I and T, each protein being under individual genetic control and existing in a tissue-specific and developmentally regulated manner (Schiaffino et al., Reference Schiaffino, Gorza and Ausoni1993). TnI is the inhibitory subunit, blocking actin–myosin interactions and thereby mediating striated muscle relaxation (Greaser and Gergely, Reference Greaser and Gergely1971). The TnI subfamily contains three genes: TnI slow-twitch (TNNI1), TnI fast-twitch (TNNI2) and TnI cardiac (TNNI3). Three isoforms of TnI are encoded by separate genes in mammals and expressed differentially in various classes of muscles (Banerjee-Basu and Buonanno, Reference Banerjee-Basu and Buonanno1994; Corin et al., Reference Corin, Juhasz, Zhu, Conley, Kedes and Wade1994; Bhavsar et al., Reference Bhavsar, Brand, Yacoub and Barton1996; Guenet et al., Reference Guenet, Simon-Chazottes, Gravel, Hastings and Schiaffino1996; Murphy et al., Reference Murphy, Thompson, Peng and Jones1997; Mullen and Barton, Reference Mullen and Barton2000). TNNI1 and TNNI2 genes are switched on during skeletal muscle myogenesis and are co-expressed during the early periods of development, later becoming restricted to slow and fast skeletal muscle fibres seperately (Mullen and Barton, Reference Mullen and Barton2000). The expression of these two genes is partitioned between adult striated muscle types, and their expression during development shows a different pattern. As the TnI isoforms are expressed at particular muscle of the fibre types, they have been used as a model gene to study mechanisms of muclse fibre-specific gene regulation (Polly et al., Reference Polly, Haddadi, Issa, Subramaniam, Palmer, Tay and Hardeman2003). Recently, the full length cDNA and genomic sequence of three porcine TnI isoforms were cloned and characterized (Yang et al., Reference Yang, Xu, Ma, Xiong, Deng and Zuo2010). However, so far very little is known about the expression of the porcine TnI genes during pig growth. Therefore, the expression change of TnI slow- and fast-twitch isoforms in Biceps femoris (BF) and masseter muscle (MM) differing in myosin heavy chain (MyHC) expression was examined in this study.
Material and methods
Animals and tissue collection
Thirty-five Yorkshire and fifty-six Meishan pigs were used for growth analysis. The Yorkshire and Chinese Meishan pigs were all raised at the Jingpin pig farm of Huazhong Agriculture University. All of them were fed twice daily with diets formulated according to age under a standardized feeding and management regimen and free access to water. The body weight was measured at birth, weaning, beginning and end of testing (Xu et al., Reference Xu, Xiong, Lei, Li and Zuo2009). Association between breed and phenotypic variation was analysed using two-way ANOVA including sex and breed (PROC GLM, SAS 8.0, SAS Inc., Cary, NC, USA).
BF was sampled from Yorkshire and Meishan pigs of five stages including the foetal 60 days of pregnant females and four stages after birth (35, 60, 120 and 180 days), with each stage three pigs. MM was sampled from Yorkshire and Meishan pigs of 60, 120 and 180 days after birth, with each stage three pigs. All of the muscle samples were collected and immediately frozen in liquid nitrogen, then stored at −80°C until RNA extraction.
RNA isolation and reverse transcription-PCR
Total RNA was prepared using TRIpure (Biotech, Beijing, China) according to the manufacturer’s instruction. Total RNA was precipitated in ethanol, washed and dissolved in RNAase-free water. RNA was subjected to DNaseI (TaKaRa, Dalian, China) digestion to remove genomic DNA contamination and re-extracted. The concentration of total RNA was determined by measuring the optical density value at 260 nm and the purity was checked as the 260/280 nm ratio with expected values between 1.8 and 2.0. First strand cDNA was prepared in a total volume of 25 μl containing 1 μg DNase treated total RNA, 1 μg Oligo(dT)15 Primer (Promega, Madison, USA), 1 × M-MLV reaction buffer (Promega), 20 mM dNTPs, 200 units of M-MLV Reverse Transcriptase (Promega) and 25 units RNasin Ribonuclease Inhibitor (Huamei Biological Engineering Company, Wuhan, China). The mixture was performed at 70°C for 5 min, then incubated at 37°C for 60 min with a final denaturation at 95°C for 5 min.
Real-time PCR and statistical analysis
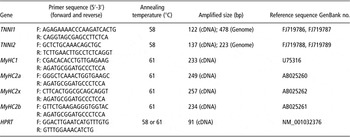
The expression of TnI genes was detected by SYBR Green I assay using ABI 7300 real-time PCR thermal cycle instrument (Applied Biosystems, Foster City, CA, USA). Primer sequences were given in Table 1. The primers of four MyHC isoforms were designed according to Kim et al. (Reference Kim, Lim, Song, Kim, Park, Kim, Hwang and Lee2008). The reactions contained 1 × SYBR Green real-time PCR Master Mix, 1 μl prediluted cDNA template and each primer at 200 nM in a 25 μl reaction volume. After an initial denaturation step at 95°C for 3 min amplification was performed with 40 cycles of 95°C for 15 s, 58°C for 15 s, 72°C for 20 s; plate read; melting curve from 55°C to 95°C, read every 0.2°C, hold for 1 s. Hypoxanthine phosphoribosyl transferase (HPRT) was included in the same plate as internal control. Three replicate animals were used for the analysis and for each animal, reactions were set up in triplicate to ensure the reproducibility of the results. The PCR experiments were also controlled with no-RT reactions and blanks. To ascertain the specificity of the reactions, the PCR amplicons were directly sequenced by commercial service. In order to determine if there were equal amplification efficiencies of TNNI1 and TNNI2 primers, Ct values of the two primers were obtained from standards of four dilutions of the porcine genomic DNA template (1 : 10, 1 : 50, 1 : 250 and 1 : 1250 dilution).
Primers used for real-time PCR

Gene expression level was quantitated relative to the expression of HPRT by employing the 2−ΔΔCt value models (Livak and Schmittgen, Reference Livak and Schmittgen2001) with ΔΔCt = ΔCtj−ΔCtcontrol, that is (Ctij−CtHPRTj)−(Cticontrol−CtHPRTcontrol), where Ctij and CtHPRTj were the Ct for gene i (TNNI1, TNNI2, MyHCI, IIa, IIx and IIb) and HPRT in sample j and where Cticontrol and CtHPRTcontrol were the Ct in control sample which was represented by the sample with the largest ΔCt value. The expression data were calculated using the SigmaPlot version 9.0 software (Systat software Inc., USA). For each gene, pair-wise multiple comparisons were performed by analysing these normalized data using a linear mixed ANOVA model and Bonferroni test in SAS version 8.0 (SAS Institute, Cary, NC). The fixed factors included breed, age, muscle and interactions among these effects and animals within the breed by age interaction as a random effect. The P < 0.05 was deemed to be significant and P < 0.01 highly significant level. Data were presented as means ± s.d.
Results
Comparison of growth traits between Yorkshire and Meishan pigs
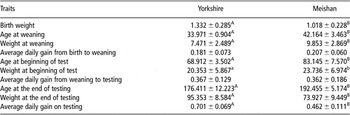
Comparison of growth traits between two breeds was given in Table 2. There was significant difference between two breeds for all traits analysed with the exception of average daily gain from birth to testing. The Meishan pigs needed about 14 days more to reach the testing weight than Yorkshire pigs. The average daily gain during testing was highly significant different between two breeds, although there was no significant difference before testing. Together, Yorkshire pigs had a higher growth rate and reached a certain weight at earlier stage than Meishan pigs.
Comparison of growth traits between Yorkshire and Meishan pigs

Data in each row with different lower case superscripts were significantly different at P < 0.05, and with capital superscripts different at P < 0.01. Data were expressed as means ± s.d.
MyHC isoforms expression analysis
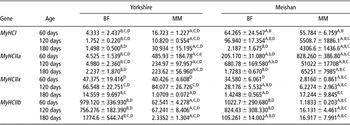
Expression of four MyHC isoforms in BF and MM of Yorkshire and Meishan pigs was shown in Table 3. For the MyHC expression in BF between Yorkshire and Meishan pigs, significant difference was observed for MyHCI and MyHCIIa expression at 60 and 120 days, but significant difference for MyHCIIx and MyHCIIb at 180 days, with lower expression of MyHCI and MyHCIIa and higher expression of MyHCIIx and MyHCIIb in Yorkshire pigs. For the MyHC expression in MM, significant difference between Yorkshire and Meishan pigs was observed. Meishan pigs had significantly higher expression of MyHCI and MyHCIIa at 60, 120 and 180 days, but lower expression of MyHCIIx and MyHCIIb at 60 and 120 days. For the MyHC expression between MM and BF in Yorkshire pigs, MyHCI and MyHCIIa expression in MM was significantly higher than that in BF at 60, 120 and 180 days, but it was opposite for MyHCIIx at 60 days and MyHCIIb at 60, 120 and 180 days. In Meishan pigs, MyHCI and MyHCIIa expression in MM was significantly higher than that in BF at 60, 120 and 180 days with the exception of MyHCI expression at 60 days, while MyHCIIx and MyHCIIb expression in MM was significantly lower than those in BF at 60 and 120 days.
Expression of four MyHC isoforms in BF and MM mRNA

BF = biceps femoris; MM = masseter muscle.
Data were calculated using the expression of 2−ΔΔCt of three animals and expressed as means ± s.d. For each gene, the sample with the largest ΔCt value was set as control. Pair-wise multiple comparisons were analysed by a linear mixed ANOVA model and Bonferroni test. A, B, C, D in each row indicated significance difference at P < 0.01 level compared with BF, MM of Yorkshire pigs, BF and MM of Meishan pigs, respectively. a, b, c, d in each row indicated significant difference at P < 0.05 level compared with BF, MM of Yorkshire pigs, BF and MM of Meishan pigs, respectively.
Temporal expression of TnI slow- and fast-twitch isoforms
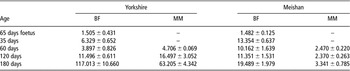
In Meishan pigs, TNNI1 expression reached its highest level at foetal 60 days and decreased until postnatal 35 days, and then reached its expression peak at postnatal 60 days after which exhibited a slow upward trend with the time (Figure 1A). TNNI2 showed the similar expression trend as TNNI1, with the highest expression level at postnatal 60 days (Figure 1B). In Yorkshire pigs, TNNI1 and TNNI2 expression level increased gradually from foetal 65 days to postnatal 35 days, and then became lower in the later period (Figure 1). The mean Ct values of TNNI1 (TNNI2) primer in genomic DNA were 26.28 (25.74), 28.63 (27.96), 30.74 (30.27) and 33.12 (32.46), respectively. Close overlap of Ct values over the range of dilutions suggested equal efficiency of primers. The expression ratio of TNNI1 relative to TNNI2 at the mRNA level was shown in Table 4. The ratio favoured TNNI2 expression in BF and MM of Yorkshire and Meishan pigs.
The expression curve of TNNI1 and TNNI2 in biceps femoris (BF) of Yorkshire and Meishan pigs at five stages: (a) expression curve of TNNI1, (b) expression curve of TNNI2. The data presented in Y-axis were calculated using the expression of 2−ΔΔCt of three animals and expressed as means ± s.d. For each gene, the sample with the largest ΔCt value was set as control. Pair-wise multiple comparisons were analysed by a linear mixed ANOVA model and Bonferroni test; **represented the significant difference at P < 0.01 level.

Expression ratio of TNNI2 to TNNI1 in BF and MM mRNA

BF = biceps femoris; MM = masseter muscle; ‘–’=not measured.
Data were depicted as ratio of TNN12/TNN11 mRNA from three animals and expressed as means ± s.d.
In order to study if there was expression difference between two muscles differing in MyHC expression, we compared the relative expression of TNNI1 and TNNI2 between BF and MM (Table 5). In Yorkshire pigs, TNNI1 showed significantly higher expression level in MM than BF at 120 and 180 days. In Meishan pigs, TNNI1 expression in MM was significantly higher than that in BF at 60, 120 and 180 days. However, no significant difference of TNNI2 expression between MM and BF was found except for Yorkshire pigs of 180 days.
Expression of TNNI1 and TNNI2 between BF and MM

BF = biceps femoris; MM = masseter muscle.
Data were calculated using the expression of 2−ΔΔCt of three animals and expressed as means ± s.d. For each gene, the sample with the largest ΔCt value was set as control. Pair-wise multiple comparisons were analysed by a linear mixed ANOVA model and Bonferroni test. Data in each row with different lower case superscripts were significantly different at P < 0.05, and with capital superscripts different at P < 0.01.
Discussion
Chinese indigenous Meishan pig breed and the Western lean-type pig breed showed obvious differences in muscle growth and quality traits (Zhang et al., Reference Zhang, Li and Chen1986). Compared with the Chinese Meishan pigs, the lean-type Yorkshire pigs have a higher average daily gain on testing, reaching the slaughter weight at earlier age. The number and type of muscle fibres are two main factors that influence postnatal growth of muscle tissue, muscle mass and meat quality. MyHC isoforms are generally considered as the molecular markers of the muscle fibre type. Selecting for leaner livestock animals with higher growth rate, for example, lean-type Yorkshire pigs, can result in large muscle fibres, especially type IIb fibre, which seems to be associated with poorer meat quality (Choi and Kim, Reference Choi and Kim2009). In this study, the differential expression of MyHC isoforms between Yorkshire and Meishan pigs also reflected this phenomenon. As expected, Yorkshire pigs have higher expression of MyHCIIx and MyHCIIb and lower expression of MyHCI and MyHCIIa in two muscles than Meishan pigs at most of the stages. This selective postnatal decreased expression of the glycolytic fibres in Meishan pigs likely contributed to its lower postnatal muscle growth. This results were also consistent with the previous studies that strong differences occurred for fast type MyHC in longissimus muscle between Large White and Meishan pigs (Lefaucheur et al., Reference Lefaucheur, Milan, Ecolan and Le Callennec2004).
BF is a large muscle of the caudolateral part of the thigh and its function is to extend the hindlimb when propelling the body. MM is one of the most powerful muscles for its size in the body and acts to raise the jaw and clench the teeth. This muscle functions to chew food and is associated with angry and aggressive states. BF and MM are the mixture of slow oxidative and fast-twitch fibres, and the predominant fibre type of two muscles is fast-twitch muscle fibre (Froytein et al., Reference Froytein, Slinde and Standal1981; Strom et al., Reference Strom, Clemensson and Holm1994). However, in this study strong difference between two muscles was observed for MyHC expression. The MyHCIIb (glycolytic fibre), MyHCIIx (intermediate fibre) were significantly higher expressed in BF, but the MyHCIIa (intermediate fibre) and MyHCI (oxidative fibre) was significantly lower expressed in MM. Therefore, the MM was composed of relatively more oxidative type of muscle fibres than composition of BF.
In general, the expression peak of TNNI1 and TNNI2 was at around postnatal 35 days in Yorkshire pigs of which the average weight was about 7.677 kg, but in Meishan pigs it happened at around postnatal 60 days of which the average weight was about 16.31 kg, assuming the pigs had the linear growth during these stages. Therefore, the expression of TNNI1 and TNNI2 in BF peaked at earlier stage or lower weight in Yorkshire than Meishan pigs. The significant higher expression of TNNI1 and TNNI2 was found in Meishan pigs than Yorkshire pigs at the foetal 60 days, whereas the opposite occurred at postnatal 35 days. At postnatal 60, 120 and 180 days, there was no significant expression difference of two genes between two breeds, which was different from the expression pattern of four MyHC isoforms. Taken together, it can be inferred that the phenotypic difference of muscle protein deposition between Yorkshire and Meishan pigs might be partly due to the differentially expression of TnI slow and fast isoforms in two breeds during the early stages.
Interestingly, the ratio of TNNI2/TNNI1 favoured TNNI2 expression in BF and MM regardless of Yorkshire and Meishan pigs. The physiological significance of higher expression of TNNI2 than TNNI1 was not clear, but suggested that TNNI2 gene may play more important roles in the contraction of skeletal muscle. Mainly the expression of TNNI1 between MM and BF was significantly different, but no difference for TNNI2. The reasons for these results were needed to be further explored. However, fibre composition seemed to explain the expression difference of TNNI1 gene in two muscles, as the MM was relatively more oxidative than biceps femoris. In addition, the fibre composition of muscle was also influenced by many factors, such as age, group, sex and nutrition (Bianospino et al., Reference Bianospino, Moura, Wechsler, Fernandes and Dal-Pai-Silva2008; Markham et al., Reference Markham, Latorre, Lawlor, Ashton, McNamara, Natter, Rowlerson and Stickland2009), so it was not surprising to find opposite or no significant difference at 60 and 120 days in Yorkshire pigs.
Conclusions
In this study, the temporal expression of the TNNI1 and TNNI2 in BF and MM differing in MyHC expression was presented. The expression peak of TNNI1 and TNNI2 in two muscles was at around postnatal 35 days in Yorkshire pigs, but in Meishan pigs it happened at around postnatal 60 days. At the foetal 60 days and postnatal 35 days, significant difference of both TNNI1 and TNNI2 expression was observed between Yorkshire and Meishan pigs. Generally, there was significant difference of TNNI1 expression between BF and MM, but no significant difference for TNNI2 expression.
Acknowledgements
This study was supported financially by the Agricultural Innovation Fund of Hubei Province, National Key Technology R&D Program during the 11th Five Year Plan (2008BADB2B02), National High Technology Development Project (2007AA10Z162; 2008AA101008), National Natural Science Foundation of P.R. China (30500358), the creative team project of Education Ministry of China (IRT0831) and the National ‘973’ Program of P.R. China (2006CB102102).