Implications
This study showed that different pig breeds are characterized by different metabolomics profiles. The statistical approach that was adopted identified a few biomarkers whose level in plasma and serum described the differences between two heavy pig breeds. The results we obtained will prompt other studies that will define if metabolomic information can clarify the basic biological mechanisms underlying production traits. Then, practical applications of the identified biomarkers could be foreseen in pig breeding and nutrition. In addition, the metabolomic profiles described in pigs will strengthen this species as interesting animal model.
Introduction
Metabolomics is an omics approach to characterize the ‘metabolome’ that is the catalog of small chemical compounds (the metabolites) present in a biological fluid or system (Hollywood et al., Reference Hollywood, Brison and Goodacre2006). Metabolites are biochemical intermediates or final products of metabolic pathways that constitute the basic biological mechanisms that directly or indirectly affect phenotypic traits, like production traits in farm animals. Therefore, metabolites can represent intermediate links between gene activities and complex phenotypes (Fiehn, Reference Fiehn2002). For this reason, they can be considered the targets for the identification of biomarkers for specific endpoint phenotypes (Monteiro et al., Reference Monteiro, Carvalho, Bastos and Guedes de Pinho2013). The high dimensional data sets that are produced by metabolomics techniques (e.g. mass spectrometry, nuclear magnetic resonance (NMR)) need the application of appropriate statistical approaches, including specific supervised and unsupervised models to correctly interpret the metabolic information from these measurements (Bartel et al., Reference Bartel, Krumsiek and Theis2013).
In pigs, many phenotypes with economic relevance are known to vary among breeds or lines, meaning that several traits are expressed or determined in different ways in different genetic backgrounds. As such, many breeds and lines are characterized by peculiar performances related to many traits, like muscle mass, carcass lean meat and fat contents, growth rate and feed efficiency, and reproduction parameters, as well as other traits (Buchanan and Stalder, Reference Buchanan and Stalder2011; Čandek-Potokar and Škrlep, Reference Čandek-Potokar and Škrlep2012), which are main objectives of pig breeding programs and the basis for crossbreeding (Sellier, Reference Sellier1976). These traits can be considered end phenotypes or external traits as they are the final results of complex biological interactions and processes, which are by definition, empirically explained following the quantitative genetic theory. However, the fine biological mechanisms affecting these complex traits are still largely unknown.
Comparative metabolomics analyses between breeds indirectly assume that genetic differences might be the origin of the differences if all other factors are maintained constant, as it is clear that pig breeds are genetically different. This is the simplest way to demonstrate that genetic factors affect the level of metabolites, even if not precise in terms of definition of the exact mechanisms. The application of metabolomics to identify metabolic markers characterizing different pig breeds is emerging as a novel and interesting first approach to understand breed specific physiological and biological parameters, and, in turn, to pose the basis for the biological dissection of complex traits that differ among breeds and might contribute to the heterosis of crossbred pigs. A few metabolomics studies have been recently published in pigs comparing different breeds or lines, even if they did not clearly control all environmental sources of variations, making it difficult to attribute reported differences to the different genetic backgrounds of the tested groups of animals. For example, D’Alessandro et al. (Reference D’Alessandro, Marrocco, Zolla, D’Andrea and Zolla2011) analysed about 20 metabolites to identify muscle metabolic biomarkers that can distinguish two highly phenotypically differentiated breeds (Casertana and Large White). In another study (Straadt et al., Reference Straadt, Aaslyng and Bertram2014), an NMR-based metabolomics investigation of longissimus dorsi meat extracts from different crossbreds identified metabolites that could explain meat quality traits. Metabolomics differences between breeds have been also indirectly determined by Rohart et al. (Reference Rohart, Paris, Laurent, Canlet, Molina, Mercat, Tribout, Muller, Iannuccelli, Villa-Vialaneix, Liaubet, Milan and San Cristobal2012) who used NMR data produced on plasma of Large White, Landrace and Pietrain pigs to predict performance traits. He et al. (Reference He, Ren, Kong, Wu, Wu, Li, Hao, Tang, Blachier and Yin2012) compared the serum metabolic profile of genetically obese (the Chinese Ningxiang breed) and lean (Duroc×Landrace×Yorkshire crossbred) pigs, to establish an NMR serum metabolic profile in an obese animal model useful to study childhood obesity. As far as we know, no other studies have been carried out in pigs to characterize metabolomic differences between breeds or lines.
Plasma and serum are both obtained from blood samples using different procedures. Plasma is obtained if an anticoagulant is introduced in the blood and after centrifugation to remove cellular components and other non-cellular portions. Serum is the supernatant fluid that is obtained if no anticoagulant is added and the blood is allowed to clot. Serum is different from plasma as it lacks fibrinogen, prothrombin and other clotting proteins although other small organic molecules may differ in terms of quantity and quality in the two biological liquids. These two biofluids could provide similar metabolomic information (Yu et al., Reference Yu, Kastenmüller, He, Belcredi, Möller, Prehn, Mendes, Wahl, Roemisch-Margl, Ceglarek, Polonikov, Dahmen, Prokisch, Xie, Li, Wichmann, Peters, Kronenberg, Suhre, Adamski, Illig and Wang-Sattler2011).
In this study we used a targeted metabolomic approach based on mass spectrometric detection of about 180 metabolites and applied a statistical validation pipeline to compare plasma and serum metabolomic profiles of animals of two heavy pig breeds, Italian Large White and Italian Duroc, raised and treated in the same way to attribute differences to their different genetic background defined by the two breeds. These breeds are relevant as they are used as maternal and paternal lines for the production of final heavy crossbred pigs and differ on several production traits, in particular on intermuscular fat that is in general higher in Italian Duroc.
Material and methods
All animal used in this study were kept according to the Italian and European legislations for pig production. All procedures described were in compliance with Italian and European Union regulations for animal care and slaughter. Pigs were not raised or treated in any way for the purpose of this study and for this reason no other ethical statement is needed.
Animals and blood samples
The metabolomics study was conducted on 24 pigs of two different breeds: 12 Italian Large White pigs (six castrated males and six entire gilts) and 12 Italian Duroc pigs (six castrated males and six entire gilts). Animals did not have common grand-parents. Pigs of both breeds were performance-tested during the same period and in the same batch at the Test Station of the National Pig Breeder Association (ANAS). Performance evaluation started when the pigs were 30 to 45 days of age and ended when the animals reached about 155±5 kg live weight (Fontanesi et al., Reference Fontanesi, Bertolini, Scotti, Trevisi, Buttazzoni, Dall’Olio, Davoli, Bosi and Russo2012). All animals were fed and handled in the same ways. Then, after a fasting period of 12 h, all pigs were transported to a commercial abattoir and slaughtered with standard procedures in the morning at about 0800 h, after electrical stunning. Animals entered the slaughtering plant within 5 min. Blood was collected just after jugulation directly from the draining carotid artery into two different tubes: (1) a tube with EDTA to avoid the coagulation for the preparation of plasma (Vacutest Kima, Padua, Italy) and (2) a tube without anticoagulant with gel separator and clot activator allowing blood to clot for the preparation of serum (Vacutest Kima). Samples were refrigerated on ice after collection for 2 h, then they were centrifuged at 3000 rpm for 10 min, divided in several aliquots and stored at −80°C till metabolomic analysis.
Analysis of metabolites and quality control
The measurement of plasma and serum metabolites was performed using the Biocrates AbsoluteIDQTM p180 Kit (Biocrates Life Science AG, Innsbruck, Austria) that allows to quantify a panel of 186 metabolites, covering five analyte classes (Supplementary Table S1): acylcarnitines (n=40), amino acids (n=21; including 19 proteinogenic+ornithine and citrulline), biogenic amines (n=19), phospho- and sphingolipids (total n=105: including phosphatidylcholine diacyl, n=38; phosphatidylcholine acyl-alkyl, n=38; lysoPhosphatidylcholine acyl, n=14; sphingomyelins, n=15) and hexoses (n=1; mainly represented by glucose but not distinguishable from other hexoses in this system). Both plasma and serum of the 24 pigs were analyzed on the same Biocrates Kit Plate, in which we included three replicates of two quality controls (QCs) each prepared by pooling 10 different pig plasma or serum samples, necessary to validate and determine within plate error and stability measurements.
The analytical platform was composed by a Serie 200 HPLC system (Perkin Elmer, Inc., Waltham, MA, USA) coupled with an API 4000 QTrap mass spectrometer (AB-Sciex, Framingham, MA, USA). The plate preparation was performed according to manufacturer instructions (Biocrates Life Science AG). Metabolites belonging to amino acid and biogenic amine classes were analyzed by liquid chromatography – tandem mass spectrometry (LC-MS/MS) and quantified by isotopic dilution on a seven point calibration curve. Metabolites belonging to acylcarnitines, phospho- and sphingolipids and hexose were analyzed by flow injection analysis (FIA) – MS/MS and quantified by their relative intensity over the chosen isotopically labeled internal standard. The quantification of a subset of compounds determined by FIA-MS/MS was stated as semi-quantitative by the supplier. The complete analytical process was performed using the MetIQ software package, which is an integral part of the AbsoluteIDQTM p180 Kit (Biocrates Life Science AG). Concentrations of all analyzed metabolites are reported as micromolar unit (μM).
Data and statistical analyses
All analyses described below have been performed in R v. 3.0.2 (R Development Core Team, 2008).
The quality assessment of the metabolite measurements was calculated computing for each metabolite the coefficient of variation (CV%) on the QCs. Metabolites that were retained for further analyses were those with CV%<20%. Then, summary statistics (mean, standard deviation and range of variation for each metabolite concentration) were computed on the plasma and serum data sets, separately.
To evaluate metabolite differences between breeds, potential confounding factors (sex and weight of the animals) were removed by using a linear regression model. The basic linear model was:
 $$Y{\rm \,{\equals}}\,\beta _{{\rm 0}} {\rm {\plus}}\beta _{{\rm 1}} {\times}{\rm factor}_{{\rm 1}} {\rm {\plus}\!\ldots }\beta _{p} {\times}{\rm factor}_{p} {\rm {\plus}\!\ldots}\!{\rm .}\,\beta _{P} {\times}{\rm factor}_{P} {\rm {\plus}}\xi $$
where Y was the concentration of a metabolite, β 0 the intercept term, factor p was the pth confounding factor and β p was the corresponding regression coefficient.
Confounding effects were removed by computing the residuals of model (1), which represented the part of the concentration that could not be explained by the factors inserted in the model:
 \scale93%{$$e\,{\rm {\equals}}\,Y{\rm {\minus}}\left( {b_{{\rm 0}} {\rm {\plus}}b_{{\rm 1}} {\times}{\rm factor}_{{\rm 1}} {\rm \!{\plus}\ldots\!{\plus}}b_{p} {\times}{\rm factor}_{p} {\rm {\plus}\!\ldots}\!{\rm .}\,b_{P} {\times}{\rm factor}_{P} } \right)}$$
where b 0, b 1, …, b P were the least squares estimates of the model parameters. Residuals were computed with the function ‘lm’ from ‘stats’ package.
All subsequent described analyses were based on these residuals.
Differences in metabolite concentrations between Italian Large White and Italian Duroc pigs were investigated in both biofluids applying the multivariate approach of sparse Partial Least Squares Discriminant Analysis (sPLS-DA; Chun and Keleş, Reference Chun and Keleş2010) using the ‘spls’ package (function ‘cv.splsda’ and ‘splsda’). Results were plotted using the scores of the first two components, where each point represents an individual sample. sPLS was used because is particularly suited for dealing with data from a small number of samples, presence of many irrelevant predictors for the considered factor, high collinearity among candidate predictors and for the sparsity constraint that allows for variables selection. In this study, breed was modeled as the sole response variable (Italian Duroc=1, Italian Large White=0) and metabolites as predictors (after scaling). In order to use sPLS-DA, it is necessary to choose the value for two quantities: a penalization coefficient η and the number of hidden components. The optimal values for both these quantities were selected by minimizing the misclassification error rate. The misclassification error rate is based on the comparison, for each pig, between the actual breed and the predicted breed obtained from the sPLS-DA model. More specifically, a grid of values for η ranging from 0.1 to 0.9 and values for the hidden components ranging from 2 to 3 were considered, and for any combination of these values, an unbiased estimate for the misclassification error rate was obtained using 10-fold cross-validation procedure (10CV). A detailed description of cross validation can be found, for example, in Hastie et al. (Reference Hastie, Tibshirani and Friedman2009). The resulting optimal values were η=0.9 and a number of component equal to 2 for both the two analyzed biofluids. The corresponding misclassification error rate was equal to 0.22 and 0.18 for plasma and serum, respectively.
On the basis of this technique, a statistical pipeline was developed with two parallel processes whose aim was to assess both the stability (stability test) and the significance (significance test) of metabolite selection. The stability test was based on (i) a Leave One Out (LOO) procedure coupled with (ii) a Permutation Test (Legendre and Legendre, Reference Legendre and Legendre1998). For this purpose, 1000 artificial data sets were obtained by randomly permuting the breed trait values. In the first phase the LOO procedure was applied using sPLS-DA on the original data set, meaning that sPLS-DA was computed on 23 of the 24 samples: at each cycle the code checked for each metabolite if this had been selected (regression weight different from 0) and, at the end of the 24 cycles, it was counted the total number of times that a metabolite had been selected. In the second phase, this procedure was applied to each of the 1000 different artificial data set. The evaluation of the stability was obtained counting for each metabolite the number of times that the frequency of selection in the 1000 permutated data sets was larger or equal to the frequency obtained in the original data set. More precisely, denoting by ‘t’ the number of times that a given metabolite was selected in the LOO procedure (0⩽t⩽24) and by ‘t*’ the number of times that this metabolite was selected in the LOO after a given permutation, the following relative frequency was computed:
 $$P\,{\equals}\,{{{\rm number}\,{\rm of}\,{\rm times}\,(t^{\asterisk}\,\gt\,t)} \over {1000}}$$
According to the theory of permutation test (see, e.g., Good (Reference Good2013) for a detailed review), this relative frequency can be interpreted as a P-value, since it is an estimate of the probability that the selection of that metabolite inside the data set is due to chance rather than a particular structure of the data set. Note that the use of a permutation test allows the computation of this P-value without introducing any assumption about the distribution of the test statistic under the null hypothesis. In this application, the test statistic is the number of times a given metabolite was selected in the LOO procedure, and the null hypothesis is that the selection of the given metabolite is due to chance. This test allowed to generate a ranking of the metabolites according to their stability. From now on the P referred to the stability test will be denoted as P st . Metabolites with P st <0.05 were considered stable. A suggestive threshold was set at P st =0.20.
The significance test was based on the comparison between the value of the sPLS-DA regression coefficient (β) of a given metabolite estimated on the original data set and the values of the same coefficient estimated on each of the 1000 different permuted data sets. The significance test was obtained by counting how many times the absolute value of the β obtained on the original data set was larger or equal to the absolute value of the β obtained on the generic permuted data set. The corresponding P-value was computed using equation (3) considering ‘t’ as the absolute value of β estimated on the original data set and ‘t*’ as the absolute value of β estimated on the generic permuted data set. The obtained relative frequency, P, represents an estimate of the probability that sPLS-DA β estimate differs from 0 only by chance. From now on the P referred to the significance test will be denoted as P si . A P si <0.05 was taken in order to declare that a given metabolite is significantly related to breed. A suggestive threshold was set at P si =0.20.
The results obtained with the two tests were crossed in order to select metabolites that resulted ‘valid’ with respect to both stability and significance analyses.
Results
Metabolomic information
Coefficients of variation for all metabolites are reported in the Supplemetary Table S1. The final data set was obtained considering a very stringent CV% (<20%), compared with previous studies in humans that used the same Biocrates metabolomics platform (25% or 30%; e.g. Kastenmüller et al., Reference Kastenmüller, Römisch-Margl, Wägele, Altmaier and Suhre2011; Siegert et al., Reference Siegert, Yu, Wang-Sattler, Illig, Adamski, Schreiber, Krawczak, Nothnagel and Nöthlings2012), to eliminate metabolites whose level was close to the detection limits of this system or that were not stable across individuals. In this way 26 out of 186 metabolites were excluded. Other six metabolites (Asp, Histamine, Nitro-Tyr, OH-Pro, PEA, SDMA; see Supplementary Table S1 for full name of the metabolites) were excluded since their concentration could not be obtained in all QCs. This data set was also checked for the presence of an excessive number of non-assigned (NA) measures (due to concentrations above or below the curve of calibration for the metabolites) and for the presence of outliers, considered as additional quality parameters (Kastenmüller et al., Reference Kastenmüller, Römisch-Margl, Wägele, Altmaier and Suhre2011). None of the metabolites had a number of NA>5%. None of the samples had more than 30% of the total set of measures with their values that was within 1.5 times the interquartile range below or above the corresponding median, suggesting a high reliability of the measures of the remaining 154 metabolites in the 24 investigated pigs.
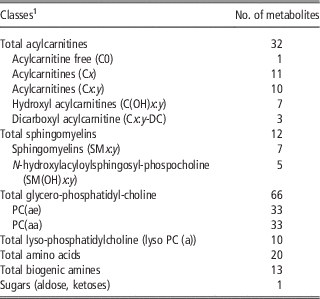
The final data set for both plasma and serum (Table 1) included measures for 32 acylcarnitines [1 acylcarnitine free (C0), 11 acylcarnitines (Cx), 10 acylcarnitines (Cx : y), 7 hydroxyl acylcarnitines (C(OH)x : y), 3 dicarboxyl acylcarnitine (Cx : y-DC), where ‘x’ indicates the number of carbon atoms and ‘y’ the position of the double bonds], 12 sphingomyelins [seven different sphingomyelins (SMx : y) and five sphingomyelins derivatives N-hydroxylacyloylsphingosyl-phospocholine (SM(OH)x : y)], 66 glycero-phosphatidyl-choline [divided in 33 PC(ae) with two fatty acids linked to the glycerol with ester (a) and ether (e) bonds (acyl-alkyl) and 33 PC(aa) with two fatty acids linked to the glycerol with two ester (a)bonds (di-acyl)], 10 lyso-phosphatidylcholine [lyso PC (a) with only one fatty acid linked to the glycerol molecule with an ester (a) bond], 20 amino acids, 13 biogenic amines and 1 indicated as hexose (comprising aldoses and ketoses).
Metabolite panel after the quality control

x=Number of carbon atoms; y=position of the double bonds; a=ester bond; e=eter bond.
1 The raw titles indicate the total of each biochemical class, while the raw sub-titles indicate the metabolite sub-classes. Full names are reported in Supplementary Table S1.
Mean, standard deviation and the range of variation for the 154 metabolites in plasma and serum for both investigated breeds are reported in Supplementary Table S2 and Supplementary Table S3, respectively. Mean correlation between measures obtained on the same pigs in plasma and serum was equal to 0.9991 (minimum 0.9966 and maximum 0.9999), suggesting that the relative concentration of the metabolites is not affected by the type of biofluid.
Comparison between Italian Large White and Italian Duroc metabolomic profiles
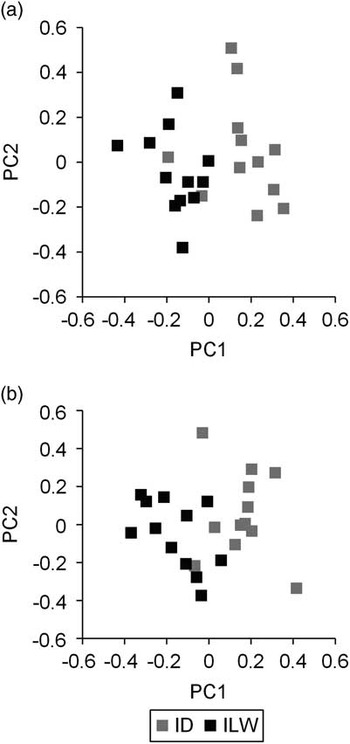
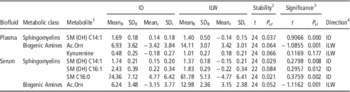
Differences in the metabolic profiles between Italian Large White and Italian Duroc pigs were investigated by using the sPLS-DA on both biofluids (plasma and serum). Figure 1 shows that Italian Large White and Italian Duroc pigs are plotted in two clearly distinguished groups using plasma as well as serum metabolomic data, indicating that metabolites can discriminate these two heavy pig breeds, even if few overlapping individuals were observed. Statistics for all tested metabolites in plasma and serum are reported in Supplementary Table S4 and Supplementary Table S5, respectively. The designed statistical pipeline that assessed the stability and significance of the investigated metabolites identified a few metabolites with P<0.20 for both statistics (Table 2). These results indicated that the discriminatory power was mainly due to few analytes with a breed-dependent level. In addition, there was a relevant overlapping between the discriminating metabolites in the two investigated biofluids, further confirming that both plasma and serum could provide similar metabolomics information in pigs. In particular, the sphingomyelin SM (OH) C14:1 and the biogenic amine acetylornithine were highly significant (P si <0.01) and stable (P st <0.05 and P st <0.10, respectively) both in plasma and in serum. In both biofluids, the level of SM (OH) C14:1 was higher in Italian Duroc pigs than in Italian Large White pigs. The level of acetylornithine was higher in Italian Large White pigs than in Italian Duroc pigs in both analysed biofluids. The level of other two sphingomyelins in serum (SM C16.0 and SM (OH) C16:1) was higher in Italian Duroc pigs than in Italian Large White animals (P si <0.01 and P si <0.05, at the significance test and P st <0.05 and P st <0.10, at the stability test). In plasma, the level of another biogenic amine (kynurenine) was higher in Italian Large White than in Italian Duroc pigs, even if considering only a relaxed threshold for the significance test (P si <0.20), and P st <0.10 at the stability test.
Scatter plots of the first two sPLS-DA components obtained from plasma (a) and serum (b) metabolomic information for the Italian Large White (ILW) and Italian Duroc (ID) pigs. Scatter plots were constructed by using the two hidden components selected by the sPLS-DA. These hidden components are obtained as linear combinations of the metabolites, using the estimated regression weights. Only metabolites having a regression weight different from zero contribute to the values of the hidden components.

Metabolites selected by sPLS-DA that were stable and significant in plasma and serum (P<0.20)

ID=Italian Duroc; ILW=Italian Large White; MeanR=mean of raw data computed after the quality control; SDR=standard deviation of raw data computed after the quality control; Meanr=mean of residuals computed after the quality control; SDr=standard deviation of residuals computed after the quality control.
1 Full names are listed in Supplementary Table S1. Metabolite concentrations are reported in μM.
2 For the Stability, ‘t’ represent the number of time that the metabolite was selected in the Leave One Out validation procedure (LOO) while ‘t*’ represents the number of time that the metabolite was selected in the LOO obtained after the permutation. n(t) indicates the number of times that (t*⩾t) and P st the associated probability.
3 For the Significance, ‘t’ represents the absolute value of the regression coefficient of the metabolite, while ‘t*’ represents the relative one obtained after the permutation. n(t) indicates the number of times that (|t*|⩾|t|) and P si the associated probability.
4 Direction: ‘ID’ indicates metabolite concentration higher in Italian Duroc than Italian Large White, while ‘ILW’ indicates metabolite concentration higher in Italian Large White than Duroc.
Discussion
The characterization of metabolomics profiles in pigs could be important to understand, from one hand, the basic biological processes underlying production traits and, from the other hand, the differences between this species and the humans to establish animal models from which pathology-based variations can be compared (Merrifield et al., Reference Merrifield, Lewis, Claus, Beckonert, Dumas, Duncker, Kochhar, Rezzi, Lindon, Bailey, Holmes and Nicholson2011; Benahmed et al., Reference Benahmed, Elbayed, Daubeuf, Santelmo, Frossard and Namer2014). Several studies analysed metabolites in different pig biological systems (tissues or biofluids) to try to capture metabolomic signatures that could explain, at least in part, differences between the tested experimental designs, including different diets, other treatments or environmental factors (e.g. Nissen et al., Reference Nissen, Nebel, Oksbjerg and Bertram2011). However, most of these studies (the largest part of them produced using untargeted approaches) obtained very preliminary descriptions of the metabolomic state of the pigs, as a relatively small number of metabolites (about 10 to 40) could be detected and measured. Only few studies were able to investigate more than 100 metabolites. For example, the Biocrates platform that, as far as we know, is one of the largest targeted metabolomic platform in terms of number of detectable metabolites already applied in pigs, was used in five other published works investigating this species for different reasons not related to our study (Solberg et al., Reference Solberg, Enot, Deigner, Koal, Scholl-Bürgi, Saugstad and Keller2010; Urban et al., Reference Urban, Enot, Dallmann, Körner, Forcher, Enoh, Koal, Keller and Deigner2010; Renner et al., Reference Renner, Römisch-Margl, Prehn, Krebs, Adamski, Göke, Blum, Suhre, Roscher and Wolf2012; Metzler-Zebeli et al., Reference Metzler-Zebeli, Ertl, Klein and Zebeli2015; Trevisi et al., Reference Trevisi, Colombo, Priori, Fontanesi, Galimberti, Calò, Motta, Latorre, Fanelli, Mezzullo, Pagotto, Gherpelli, D’Inca and Bosi2015). It is clear that many more metabolites could be present in different animal systems. For example, the Human Metabolome Database enlists about 42 000 different metabolites, most of them should be considered as intermediate or final products of biochemical pathways common to most mammals (Wishart et al., Reference Wishart, Jewison, Guo, Wilson, Knox, Liu, Djoumbou, Mandal, Aziat, Dong, Bouatra, Sinelnikov, Arndt, Xia, Liu, Yallou, Bjorndahl, Perez-Pineiro, Eisner, Allen, Neveu, Greiner and Scalbert2013). Therefore, despite the recent progresses in this field, the main limitations in metabolomics are derived by technological gaps that cannot make it possible to detect and measure all (or almost all) metabolites that might be present in a biofluid, in a tissue or even in a cell (Monteiro et al., Reference Monteiro, Carvalho, Bastos and Guedes de Pinho2013).
In this study we took advantage from a target metabolomic approach that made it possible to analyze a quite large number of metabolites (n=186), most of which (n=154) passed the stringent filtering steps and were retained in the investigated pigs for further analyses. Studies in humans that used the Biocrates AbsoluteIDQTM p180 Kit, for example, retained all metabolites or missed a few of them, depending, in part from the type of tissue or the statistical filters and pipeline used (e.g. Breier et al., Reference Breier, Wahl, Prehn, Fugmann, Ferrari, Weise, Banning, Seissler, Grallert, Adamski and Lechner2014), similarly to the number of metabolites that passed our data processing steps from porcine plasma and serum.
In this study sPLS-DA was applied to derive a list of biomarkers that might differentiate two heavy pig breeds (Italian Large White and Italian Duroc). To statistically support the selection of variables (i.e. metabolites), sPLS-DA was coupled with a resampling and permutation procedure aiming at assessing the stability and the significance of its results. The use of such computational techniques for validation purposes is well established in the statistics literature to assess the overall prediction accuracy of a statistical model, and to check for possible overfitting. Resampling and permutation procedures have been recently used to support variable selection techniques for logistic and linear regression models (e.g. Sauerbrei et al., Reference Sauerbrei, Buchholz, Boulesteix and Binder2015). For classification problems in metabolomics studies, these computational approaches were used to evaluate the significance of regression coefficients in partial least squares discriminant analysis (PLS-DA) (e.g. Holmes et al., Reference Holmes, Loo, Stamler, Bictash, Yap, Chan, Ebbels, De Iorio, Brown, Veselkov, Daviglus, Kesteloot, Ueshima, Zhao, Nicholson and Elliott2008). However, to our knowledge, our study applied for the first time this approach to validate sPLS-DA results. Correction for multiple testing in this case is not appropriate as biomarkers might be correlated and have been pre-selected by sPLS.
This study was designed to compare the baseline metabolomic profiles of pigs belonging to two different breeds that are clearly genetically separated and selected for different purposes. The Italian Duroc is used as paternal line and is expected to pass to the final slaughtered pigs traits that could maximize rusticity, meat quality (including a right level of intermuscular fat in the hybrids) and growth efficiency, whereas the Italian Large White breed is usually used as maternal line in hybrid sows with Italian Landrace to produce heterosis for reproductive traits. A particular selection objective in the Italian Duroc breed is addressed to reduce the excessive intermuscular fat (a common problem in many Duroc lines) that might be a negative trait for the production of dry-cured hams.
The obtained results indicates that the different level of only few metabolites, among the 153 investigated metabolites, distinguished the two compared pig breeds. This might be expected considering that these differences might be derived by genetic differences between the two groups of pigs, which should affect significantly the level of some molecules in plasma and serum (as all other environmental factors were the same for all animals). That means that we probably observed the effect of a few loci, acting in different ways in the two breeds, on specific products of metabolic pathways that could, in turn, affect other upstream or downstream pathways and functions.
A higher level of the sphingomyelins SM (OH) C14:1 (both in plasma and serum), SM (OH) C16:1 (in serum) and SM C16:0 (in serum) was observed in Italian Duroc than in Italian Large White pigs. Sphingomyelins are sphingolipids that are enriched in membranes of mammalian cells. The general biofunctions of sphingomyelins are related to cell signaling, membrane integrity and stability and energy storage. The direct roles played by sphingomyelins in different cellular processes and functions span from the regulations of endocytosis and receptor-mediated ligand uptake, to ion channel and G-protein coupled receptor function and protein sorting in addition to several other functions, related also to the interaction with cholesterol in plasma membranes (Slotte, Reference Slotte2013). It is also recognized that obesity-induced inflammatory response leads to modulation of sphingolipid metabolism (Kang et al., Reference Kang, Kim, Lee and Park2013). This might be a potential relevant biochemical mechanism explaining through the pathway that produces ceramide a link between sphingomyelins and differences in production traits between the two breeds, in particular the well known higher intermuscular fat deposition in Italian Duroc than in Italian Large White.
It is interesting to note that the three sphingomyelins whose level is higher in Italian Duroc are biochemically closely related: just an elongation step transforms SM (OH) C14:1 into SM (OH) C16:1 and a desaturation/saturation step in addition to a hydroxylation/dehydroxylation separates SM (OH) C16:1 from SM C16:0. According to the fact that these three sphingomyelins are in the same biochemical pathway, and the direction of the ‘effect’ is the same (higher in Italian Duroc pigs), it could be possible that the same genetic difference(s) between the investigated Italian Duroc and Italian Large White pigs could contribute to modify the level of all these three molecules in these breeds. From the other hand, the result for these three close metabolites could indirectly prove the robustness of the metabolomic data and statistical approach designed in this study.
The level of the biogenic amine acetylornithine (Ac.Orn) was higher in Italian Large White than in Italian Duroc in both analyzed biofluids. Acetylornithine is an intermediate of the amino acid synthesis pathway and is a precursor of ornithine that enters in the urea cycle. Therefore, Ac.Orn is indirectly connected with the biochemical pathways that produce arginine and proline. For this reason, this information could be useful to investigate if there would be a link between Ac.Orn level and needs of amino acids provided by the diet opening new perspectives for precise feeding in pigs.
Similar potential applications could be derived by the results that showed that in plasma, Italian Large White pigs contained a higher level of kynurenine than Italian Duroc pigs. Kynurenine is a key intermediate metabolite of the tryptophan catabolism pathway. Capozzalo et al. (Reference Capozzalo, Kim, Htoo, de Lange, Mullan, Hansen, Resink, Stumbles, Hampson and Pluske2012) showed that plasma kynurenine level varied according to different ratios of dietary tryptophan to lysine in weaned pigs. It is also well known that the depletion of tryptophan and formation of kynurenine derived metabolites modulates the activity of the mammalian immune, reproductive, and central nervous systems, linking several production relevant traits (Ball et al., Reference Ball, Jusof, Bakmiwewa, Hunt and Yuasa2014).
Conclusions
Metabolomics could potentially produce data useful to explore the biochemical mechanisms underlying physiological differences defined by the experimental design. In this study we compared plasma and serum metabolomic profiles of two heavy pig breeds. The level of a few metabolites (including three sphingomyelins and two biogenic amines), was significantly different between the two groups of pigs as shown using a sPLS-DA based statistical validation approach. These results identified biomarkers that could be important to understand the molecular factors explaining differences between the Italian Duroc and the Italian Large White breeds, with potential practical applications in pig breeding and nutrition. However, based only on this metabolomic information, it is not possible to define what could be the effects of the biochemical differences between the two breeds in terms of production traits. Additional studies will be needed to link these biomarkers to traits of economic relevance in pigs.
Acknowledgments
The authors thank Dr Emilio Scotti for technical assistance and ANAS for help in designing this study. This work was funded by Italian MiPAAF Innovagen project and University of Bologna FARB project.
Supplementary material
To view supplementary material for this article, please visit http://dx.doi.org/10.1017/S1751731116000483