1. Introduction
1.1 Current Statistical Techniques
1.1.1 Current modelling techniques use the generalised linear modelling framework to estimate parameters for a given model structure based upon calculating the minimum deviance (maximum likelihood) estimates for the parameters from a given dataset.
1.1.2 First the structure of the model to be produced (both appropriate link function and distribution) is established using an understanding of the data, and then considering residual plots and the results of the Tweedie distribution test (Box-Cox transformation).
1.1.3 The significance of parameter estimates can then be judged according to the standard errors calculated from the information matrix, and various statistical tests for example the Chi Squared and F-Tests can be used to compare two competing models.
1.1.4 A range of other statistics such as the Akaike Information Criteria ‘AIC’, and Bayesian Information Criteria ‘BIC’ can also be considered.
1.1.5 These statistical approaches were originally utilised in the context of relatively few factors and levels and relatively few interactions. The range of factors, number of levels within factors and the number of interactions has increased significantly in UK personal lines insurance as insurers have sought competitive advantage and more recently to prevent anti-selection on price comparison sites (‘Winner's Curse’).
1.2 Short-comings of Statistical Techniques
1.2.1 As discussed, over time the size of modelling datasets has increased (datasets up to 100m rows are becoming more common), and this has highlighted the differences between academic methods designed for a few thousand rows and actual insurance specific models deployed to determine prices.
1.2.2 In particular the Degrees of Freedom is defined by the number of rows of data – number of parameters (unaliased). This becomes effectively constant where the dataset is large, and the parameter list rarely exceeding 1000.
1.2.3 The Deviance for a model decreases as new parameters are added. Hence the ratio of residual deviance to number of degrees of freedom always improves when the degrees of freedom is effectively constant. This causes Chi Squared tests on nested models and F-Tests to accept parameters which would be rejected from a business perspective as spurious and over-parameterised.
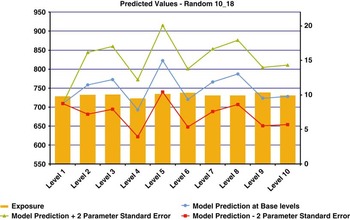
1.2.4 For example Figure 1 shows a completely random factor which when added to the dataset, proves to be a significant factor using traditional methods. Both the parameter values are accepted by the standard errors, and the Chi-Square test proves significant. If a 95% significance test is used, then this would be expected to happen once in twenty times.
A Random Factor – the 18th attempt

1.2.5 The likelihood of over-fitting clearly increases the more parameters that are added to the model, be it factors, levels or interactions.
1.3 Current Business Techniques
1.3.1 There is wide recognition that modelling is not a pure science and better results can be achieved using domain knowledge (by applying some ‘art’). The statistical techniques are usually supported by checking the models against business understanding of the factors, their usual significance and trends from past time periods and other datasets.
1.3.2 Time consistency testing is used to ensure that a factor shape is both consistently present for given time periods, and to establish if there is trend for the shape to strengthen, weaken or change shape over time. This is essential if the chosen values of the parameters are to be predictive for a future time period, which is normally the business objective.
1.3.3 To mitigate the problems outlined in 1.2, extensive use is also often made of hold-out sample data. This is where a model is built on a sample of the data, say 80% (modelling or training data) and then the performance is judged by comparing results scored against the remaining 20% (hold-out sample).
1.4 Price Comparison Website Developments, Efficient Market, Winners Curse
1.4.1 In recent years the rise of price comparison websites, particularly in the UK motor market, has created a near perfect market for consumers. Which, coupled with the fact that many view motor insurance as a commodity product, has resulted in observed new business elasticities ranging in magnitude from 10 to 100.
1.4.2 The estimates from a pricing model are best estimates in the statistical sense and hence are subject to uncertainty. In these circumstances the Winner's Curse operates as a powerful anti-selection effect which imposes a heavy penalty where the uncertainty randomly results in an estimate which is below the true value.
1.4.3 In this business context insurers have responded by increasing the range of factors, levels within factors and number of interactions as they have tried to minimise the level of anti-selection. But in doing so there is an increased likelihood of over-fitting which does present a real business dilemma. When presented with a new factor to implement which makes sense from a business viewpoint and is significant, the view will, more often than not, be to introduce the factor. In fact it is very likely that when one systematically reviews the inclusion of each term in a sophisticated model that a business sense argument can be made for each and every one, but it is likely when taking together there will be an element of over-fitting.
1.4.4 In addition to the parameter estimates, the modelling process makes available results which reveal the uncertainty attached to these expressed as a Variance/Covariance matrix. Also the Hat matrix which displays the influence that each data point has had on its corresponding estimate.
1.4.5 There are a number of elements which influence how this uncertainty varies from model to model, and by risk within the model. Two elements of this uncertainty will be tackled by this paper; the remainder can only be properly treated in another paper.
1.4.6 The first is the tendency for over-parameterised models to replicate noise within the data which will not be repeated in future observations. This noise is one source of estimate uncertainty.
1.4.7 The second is the tendency for models to be used over a heterogeneous domain. Some areas of the domain are well populated and hence estimates are subject to less uncertainty. The fringes of the domain which tend to be sparsely populated with observations resulting in greater levels of uncertainty. Extrapolation to future time periods is a special case of this which is necessary for the deployment of most predictive models.
1.4.8 The aim of this paper is to consider if the ‘best estimates’ produced by a model can be adjusted to make them more predictive.
1.4.9 More formally the aim is to temper the model outputs by penalising uncertain parameters to the extent that they are only rewarded for improving the likelihood (reducing Deviance) of the estimates as measured against hold-out sample data.
1.5 Nirvana Method of Scaling Back Parameters
1.5.1 A true mechanism for scaling back parameters will also help in another way. Simply allowing a model to become over-parameterised as it is developed, and reporting parameter errors which state they are not significant is not enough. With this method we can go further, and scale back the poor parameters effectively neutralising them from the model. Pruning processes can then operate to remove them altogether. This will allow the user to focus upon finding potential factors in the knowledge that unsuccessful attempts will not damage the output.
1.5.2 A company may choose to build the model on top of a market rates model, so that rather than scaling back towards the mean, parameters are scaled back towards market rates instead. Therefore a company would only differ from market structures where it had sufficient data to confirm a significant difference in experience.
2. Case Deletion
2.1 Elimination of Outliers by Case Deletion
2.1.1 Using a measure of residuals such as the Cook's Statistic, Outlier points can be excluded from the model based on their undue influence on the parameter estimates.
2.1.2 This technique is supported by leading statistical packages, but for datasets of the scale currently in use, deleting outliers is an onerous and unproductive task.
2.2 Effect of Case Deletion
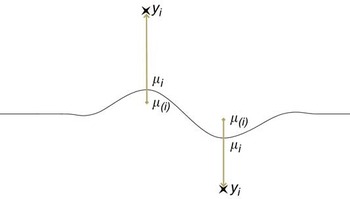
2.2.1 In essence each data point acts to pull the model towards itself, and the exclusion of that point and refitting the parameters will result in a new set of parameter values and hence new “Case Deleted” Estimate for that data point. By definition that estimate will lie further from the observed data point than the estimate produced by the full model (see figure 2).
Standard and ‘Case Deleted’ estimates

2.3 “Case Deleted” Deviance
2.3.1 The Standard Deviance is a measure of the distance from the observed values to the estimate. For an identity link, Normal distribution error structured model, this equates to the sum of squared distances of each observed to estimate. For more general model structures the parameters are found by maximising the likelihood function, and the deviance is defined from this. However it can still be usefully thought of as a form if distance measure.
2.3.2 In the extreme case where the model contains a parameter for every data point, the estimates and the observed values will be equal and the deviance will have a minimum value. The model here is replicating both the Pattern in the data and the Noise.
2.3.3 Taking the set of ‘Case Deleted’ Estimates, one for each data point, provides a means to calculate a new ‘Case Deleted’ Deviance. This is in effect the limiting case of calculating the estimate for a hold-out sample of one row against a model based on ‘n-1’ rows, as the new estimate is not influenced by the observed value itself. The deviance is then calculated in the normal way from the estimates, and summing over the dataset.
2.3.4 Because the ‘Case Deleted’ Deviance is calculated from estimates which are independent of the observed values it represents the pattern but without the noise related to the observed data point in question. An extreme model will still include noise generated by the other data points, but provided the data points are independent these should average to zero.
2.3.5 A number of practical tests have been conducted comparing the Standard and ‘Case Deleted’ Deviances. From these it is helpful to define some terms. Let SD 1, SD 2 be the Standard Deviances from a base model and an adjusted model. If the adjusted model is created by adding parameters to the base model, then we know that SD 1 > SD 2. Similarly take CDD 1, CDD 2 to be the ‘Case Deleted’ equivalents. Interestingly it is possible for CDD 2 to be larger than CDD 1 in circumstances where the extra parameters are adding more noise to the model than pattern.
2.3.6 To assist with the investigation of these intuitive concepts of ‘pattern’ and “noise”, we will now propose a more formal definition.  $Patter{{n}_{1,2}}\, = \,CD{{D}_1}{\rm{ - }}CD{{D}_2}\,{\rm{and}}\,\,Nois{{e}_{1,2}}\, = \,S{{D}_1}{\rm{ - }}S{{D}_2}{\rm{ - }}Patter{{n}_{1,2}}$.
This allows us to consider the value of these measures and compare them to existing tests.
2.4 Correlation with Standard Errors
2.4.1 The first example involved a Log-Poisson model with an Accident Damage Frequency dataset containing 1m rows, with around 200 parameters covering a range of factors.
2.4.2 For each parameter in the model a new sub-model was created with that single parameter deleted. Then the Noise and Pattern measures were calculated between the full model and the sub-model.
2.4.3 When testing a parameter with a normal distribution error structure, a 95% significance test would reject parameters where the standard error exceeds 50% of the parameter value itself. For other error structures the 50% ratio is also used as an acceptance threshold.
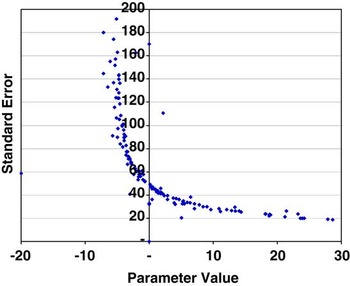
Pleasingly the two tests showed a strong correlation. Defining  $Valu{{e}_{1,2}}\, = \,Patter{{n}_{1,2}}{\rm{ - }}{{5}\,^\ast}\, Nois{{e}_{1,2}}$ (x-axis) shows a positive value when the Standard Error % (y-axis) is less than 50% and negative above, as Figure 3 demonstrates. While 5 appears a sensible value to choose in this example, work remains to investigate whether this is a stable value, or changes for other model structures and datasets.
Correlation between the ‘Value’ Measure and Standard Errors

3. Applications to Model Comparison
3.1 Random Factor Example
3.1.1 Using the same random factor example mentioned in 1.2.4
3.1.2 Deviance values calculate as CDD 1 = 10242, CDD 2 = 10249 SD 1 = 14631, SD 2 = 14605 and this gives Pattern 1,2 = CDD 1 − CDD 2 = −7 and Noise 1,2 = SD 1 − SD 2 − Pattern 1,2 = 33 which would reject the random factor as detrimental  $Valu{{e}_{1,2}}\, = \,Patter{{n}_{1,2}}{\rm{ - }}{{5}\,^\ast}\, Nois{{e}_{1,2}}\, = \,{\rm{ - }}172$.
3.1.3 Hence the Case Deleted Deviance rejects the random factor where traditional tests would accept it.
3.2 Optimal Knot Position Application for Factor Splines
3.2.1 This example is a case study using the same dataset as 2.4.1, and using the ‘Value’ measure from 2.4.3 above.
3.2.2 For a number of factors Policyholder Age, Vehicle Group, Rating Area, NCD, Convictions, Number of Years Licence Held, a number of different spline functions were compared. In all cases a standard cubic, with x, x2 and x3 terms, is fitted to the data. Then in addition, one or many corrections to the standard cubic were added corresponding to the different knot positions.
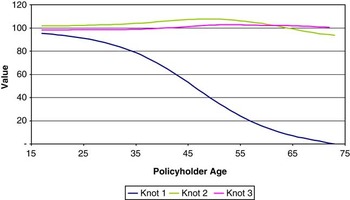
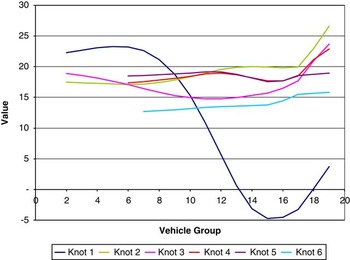
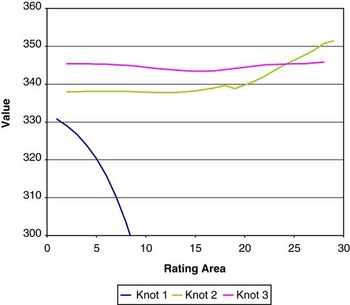
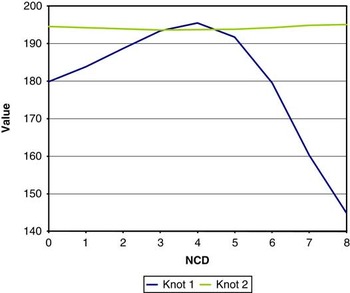
3.2.3 The first line shows how the ‘Value’ measure varies as the knot position for the spline is varied. The second line shows the effect when the first knot position is fixed and the position of a second knot is changed and so forth. The charts below show the knot position on the x-axis, and the ‘Value’ measure on the y-axis. The best position for the knot was selected and then the process repeated adding another knot. Continuing until an extra knot reduces ‘Value’.
3.2.4 This is not an efficient process since the smooth results obtained indicate the maximum ‘Value’ position could be obtained with fewer steps. However the result graphs are more complete if every position is calculated for the result charts below.
3.2.5 Once an extra knot has been added, this method did not recheck that the existing ones should remain in their current positions. An efficient implementation would first derive the number of knots required, then find their approximate positions, and finally jiggle them to find the global optimum.
3.2.6 Although the process of calculating the additional ‘Noise’ was performed at each step, this turned out to be quite stable, hence the knot position could be estimated from the unadjusted deviance alone. The ‘Noise’ adjustment only being needed to define the absolute ‘Value’ of adding an extra knot.
3.2.7 The method suggests two knots at ages 17 and 49, but rejects a third one at 53 (see figure 4).
The ‘Value’ Measure as the Number and Position of Knots are varied by Policyholder Age

3.2.8 Standard Error values would also accept these two knots and reject the third, as would F-Tests.
3.2.9 Vehicle Group
3.2.9.1 This factor suggests two knots at 5 and 19 (see figure 5).
The ‘Value’ Measure as the Number and Position of Knots are varied by Vehicle Group

3.2.9.2 The Standard Error test is confusing here. Testing each of the knot definitions built up by the procedure, ultimately it would accept knot positions 5 and 2, but only from a five knot spline.

3.2.9.3 The F-Test considers the splines (5) similar to (5, 19), (5, 19, 2) and (5, 19, 2, 14), but claims the spline (5, 19, 2, 14, 6) is different from (5, 19, 2, 14) yet similar to (5, 19, 2).
3.2.9.4 Hence the ‘Value’ measure appears useful as a global absolute statistic. The standard error only describes the certainty of an individual parameter, and becomes difficult when the SE values of several parameters vary from one model to the next. The F-Test only describes if two models are significantly different, not if one is better than the other. Whilst assuming the simplest model from two similar models, and the complex model from two different models is standard practice, this does not ensure that the ultimate model is the most predictive.
3.2.10 Rating Area
3.2.10.1 This factor gives two knots at 1 and 29. In agreement with SE and F-Tests (see figure 6).
The ‘Value’ Measure as the Number and Position of Knots are varied by Rating Area

3.2.11 NCD
3.2.11.1 This factor gives one knot at 4. In agreement with SE and F-Tests (see figure 7).
The ‘Value’ Measure as the Number and Position of Knots are varied by NCD

3.2.12 Conclusion
3.2.12.1 The “Value” measure has therefore proved consistent with existing test results where small changes are being made from one model to the next, lending to its credibility for use as a single global measure by which to compare the results of any two models.
4. Calculation of ‘Case Deleted’ Estimates
4.1 Formula for Case Deleted Parameters
4.1.1 McCullagh & Nelder (Reference McCullagh and Nelder1989) suggest two methods for calculating ‘Case Deleted’ parameters.
4.1.2 McCullagh & Nelder (Reference McCullagh and Nelder1989:396) discusses the idea of Case Deletion in the standard sense, as a means to identify whether to exclude individual outlier points from an analysis. They talk about the impact on the model fit of removing the point. Also that this is slow if the model needs to be refitted, and suggest that a first step approximation is used. For our purposes even if a single iteration was accurate enough a set of ‘Case Deleted’ Parameters is still required for every data point which as noted in Berry would be impractically slow.
4.1.3 On p406 they quote a result from Atkinson (Reference Atkinson1987) for the linear case  ${{\hat{\beta }}_{\left( j \right)}}{\rm{ - }}{{\hat{\beta }}_j}\, = \,\frac{{{\rm{ - }}{{{\left( {{{X}^T} WX} \right)}}^{{\rm{ - }}1}} {{x}_i}\left( {{{y}_i}{\rm{ - }}{{\mu }_i}} \right)}}{{\left( {1{\rm{ - }}{{h}_i}} \right)}}$ where the Hat diagonal is defined as
 ${{h}_i}\, = \,dia{{g}_i}\left( {{{W}^{{1 \mathord{\left/ {\vphantom {1 2}} \right. \kern-\nulldelimiterspace} 2}}} X{{{\left( {{{X}^T} WX} \right)}}^{{\rm{ - }}1}} {{X}^T} {{W}^{{1 \mathord{\left/ {\vphantom {1 2}} \right. \kern-\nulldelimiterspace} 2}}} } \right)$ and suggest a modification for the generalised linear case
 ${{\hat{\beta }}_{\left( j \right)}}{\rm{ - }}{{\hat{\beta }}_j}\, = \,\frac{{{\rm{ - }}{{{\left( {{{X}^T} WX} \right)}}^{{\rm{ - }}1}} {{x}_i}\left( {{{z}_i}{\rm{ - }}{{\eta }_i}} \right)}}{{\left( {1{\rm{ - }}{{h}_i}} \right)}}$ where
 ${{z}_i}\, = \,g\left( {{{y}_i}} \right)$.
4.1.4 For the linear case this can be used to generate the estimate directly  ${{\eta }_{\left( i \right)}}\, = \,{{\eta }_i}{\rm{ - }}\left( {\frac{{{{h}_i}}}{{1{\rm{ - }}{{h}_i}}}} \right)\frac{{\left( {{{y}_i}{\rm{ - }}{{\mu }_i}} \right)}}{{{{W}_i}}}$ with the
 ${{h}_i}\, = \,\mathop{\sum}\sidelimits_{jk} {{{X}_{ij}}{{C}_{jk}}{{X}_{ik}}{{W}_i}} $.
4.2 Formula for Generalised Linear “Case Deleted” Estimates
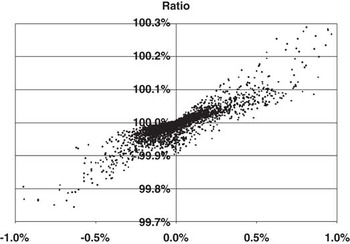
4.2.1 This same formula was also tested in the generalised linear case of a Log-Poisson model and found to be 99.8% accurate, albeit with a slight bias. Figure 8 shows  ${\rm{ - }}\left( {\frac{{{{h}_i}}}{{1{\rm{ - }}{{h}_i}}}} \right)\frac{{\left( {{{y}_i}{\rm{ - }}{{\mu }_i}} \right)}}{{{{W}_i}}}$ on the x-axis and
 $\left( {{{\eta }_{\left( i \right)}}{\rm{ - }}{{\eta }_i}} \right)/\left( {{\rm{ - }}\left( {\frac{{{{h}_i}}}{{1{\rm{ - }}{{h}_i}}}} \right)\frac{{\left( {{{y}_i}{\rm{ - }}{{\mu }_i}} \right)}}{{{{W}_i}}}} \right)$ on the y-axis where the actual η(i) have been calculated with a full model fit per data point.
‘Case Deleted’ Estimate approximation for Log-Poisson

4.2.2 Likewise the second formula  ${{\hat{\beta }}_{\left( j \right)}}{\rm{ - }}{{\hat{\beta }}_j}\, = \,\frac{{{\rm{ - }}{{{\left( {{{X}^T} WX} \right)}}^{{\rm{ - }}1}} {{x}_i}\left( {{{z}_i}{\rm{ - }}{{\eta }_i}} \right)}}{{\left( {1{\rm{ - }}{{h}_i}} \right)}}$ was also tested and rejected.
4.2.3 The formula from 4.1.4 has also been checked on a Logit-Binomial model, giving the results illustrated in Figure 9.
‘Case Deleted’ Estimate approximation for Logit-Binomial

4.2.4 Armed with this new method we now have the ability to generate η(i) directly from a single model fit.
4.3 Bayesian Understanding of the ‘Case Deleted’ Estimates
4.3.1 The Hat matrix provides the influence of each data point on the parameters. The total of each row adding to one, and hence can be thought of as a credibility in a Bayesian context.
4.3.2 For a linear model the estimate will be formed as follows:  ${{\eta }_i}\, = \,\mathop{\sum}\sidelimits_p {{{h}_p}{{y}_p}} $. This can be rearranged as follows
 ${{\eta }_i}\, = \,{{h}_i}{{y}_i}\, + \,\mathop{\sum}\sidelimits_{p\, \ne \,i} {{{h}_p}{{y}_p}} $ then observing that η(i) is the equivalent developed from one less data point
 ${{\eta }_{\left( i \right)}}\, = \,\frac{{\mathop{\sum}\sidelimits_{p\, \ne \,i} {{{h}_p}{{y}_p}} }}{{\mathop{\sum}\sidelimits_{p\, \ne \,i} {{{h}_p}} }}\, = \,\frac{{\mathop{\sum}\sidelimits_{p\, \ne \,i} {{{h}_p}{{y}_p}} }}{{\left( {1{\rm{ - }}{{h}_i}} \right)}},\,{{\eta }_i}\, = \,{{h}_i}{{y}_i}\, + \,{{\left( {1{\rm{ - }}{{h}_i}} \right)}_{}}{{\eta }_{\left( i \right)}}\;{\rm{so}}\;{{\eta }_{\left( i \right)}}\, = \,\frac{{{{\eta }_i}{\rm{ - }}{{h}_i}{{y}_i}}}{{1{\rm{ - }}{{h}_i}}}\, = \,{{\eta }_i}{\rm{ - }}\left( {\frac{{{{h}_i}}}{{1{\rm{ - }}{{h}_i}}}} \right)\left( {{{y}_i}{\rm{ - }}{{\eta }_i}} \right)$
4.3.3 For the Generalised Linear Model a first order approximation would be  ${{\eta }_{\left( i \right)}}\, = \,{{\eta }_i}{\rm{ - }}\left( {\frac{{{{h}_i}}}{{1{\rm{ - }}{{h}_i}}}} \right)\frac{{\partial {{\eta }_i}}}{{\partial {{\mu }_i}}}\left( {{{y}_i}{\rm{ - }}{{\mu }_i}} \right) = {{\eta }_i}{\rm{ - }}\left( {\frac{{{{h}_i}}}{{1{\rm{ - }}{{h}_i}}}} \right)g^{\prime}\left( {{{\mu }_i}} \right)\left( {{{y}_i}{\rm{ - }}{{\mu }_i}} \right).$
For Log-Poisson and Logit-Binomial models it can be shown that  $g^{\prime}\left( {{{\mu }_i}} \right)V\left( {{{\mu }_i}} \right)\, = \,1$, giving 4.1.4
 ${{\eta }_{\left( i \right)}}\, = \,{{\eta }_i}{\rm{ - }}\left( {\frac{{{{h}_i}}}{{1{\rm{ - }}{{h}_i}}}} \right)\frac{{\left( {{{y}_i}{\rm{ - }}{{\mu }_i}} \right)}}{{{{W}_i}}}$ for unit weights.
4.3.4 We undertook a numerical checking of a Log-Gamma model as for this structure  ${{W}_i}g^{\prime}\left( {{{\mu }_i}} \right)\, = \,\frac{{{{\omega }_i}}}{{{{\varphi }_{}}{{\mu }_i}}}$. For this model we found that
 ${{\eta }_{\left( i \right)}}\, = \,{{\eta }_i}{\rm{ - }}\left( {\frac{{{{h}_i}}}{{1{\rm{ - }}{{h}_i}}}} \right)g^{\prime}\left( {{{\mu }_i}} \right)\left( {{{y}_i}{\rm{ - }}{{\mu }_i}} \right)$ and hence reject 4.1.4.
5. Noise Reduced Parameters
5.1 Desire for an Amended Set of Parameters
5.1.1 The realisation that the ‘Case Deleted’ Estimate μ (i ) is a useful noise independent measure, and easily calculated, led to a couple of initial attempts to use it directly to influence the model output estimates.
5.2 First and Second Attempts, Mean Adjustors
5.2.1 The first thought was that the noise in the model output could be reduced by artificially offsetting each data point to remove an equivalent amount,  $y_{i}^{\ast} \, = \,{{y}_i}\, + \,{{\mu }_{\left( i \right)}}{\rm{ - }}{{\mu }_i}$. These can then be refitted to obtain a new set of estimates,
 $\mu _{i}^{\ast} $.
5.2.2 The second attempt applied a second tier model to the ‘Case Deleted’ Estimates from the first  $y_{i}^{\ast} \, = \,{{\mu }_{\left( i \right)}}$ to try to produce some new estimates
 $\mu _{i}^{\ast} $ with less noise.
5.2.3 Neither of these produces results which are significantly different from the original estimates. This can be understood by reflecting on the way that GLM models select their parameters by placing them at the ‘mean’ position of the sub-domain for each parameter. Hence the data has a symmetry about this mean, and the noise μi − μ (i ) reflects this too. So both methods above represent symmetrical adjustments to the data which have little effect on the new estimates.
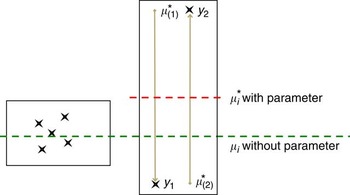
5.2.4 Consider the example illustrated in figure 10. Here we have a well populated domain with data points on the left defining a value of μi shown as the lower green dashed line. Then a new parameter based solely upon two data points y 1,y 2 is considered, this will move the ordinary estimates to the mid-point of the two points shown as  $\mu _{{_{i} }}^{\ast} $ the red dashed line. With this parameter included the Case Deleted model for y 1 will produce
 $\mu _{{_{{\left( 1 \right)}} }}^{\ast} \, = \,{{y}_2}$ and similarly the Case Deleted model for y 2 will produce
 $\mu _{{_{{\left( 2 \right)}} }}^{\ast} \, = \,{{y}_1}$.
‘Case Deleted’ Deviance – Increasing with Model Complexity

5.2.5 The Deviances calculated for this parameter will show  $SD\left( {{{y}_i},{{\mu }_i}} \right)\, \gt \,S{{D}^\ast} \left( {{{y}_i},\mu _{{_{i} }}^{\ast} } \right)$ but here the “Case Deleted” Deviance will be substantially worse
 $CDD_{{}}^{\ast} \left( {{{y}_i},\mu _{{\left( i \right)}}^{\ast} } \right)\, \gt \gt \,SD\,( {{{y}_i},{{\mu }_i}} \right)$. The symmetry of the adjustments can be seen easily here, and hence despite the failure of the extra parameter to add value, we can see why its value remains unchanged.
5.3 The Need for a Variance Penalty Function to Drive the Adjustor
5.3.1 Looking again at the formulation of the ‘Case Deleted’ Estimates μ(i), notice that they involve terms representing the mean μi and through the Hat diagonal hi the variance. Instead therefore we need to develop a penalty function to reward the model for good mean values and penalise by increasing variance.
5.3.2 However we cannot simply replace μi with μ(i) in the likelihood and refit, since the extra deviance introduced already possesses the symmetry above, and hence there is little impact on the parameters values by the method.
5.3.3 Now let's focus instead on a more direct penalty function. Take the results of the free fit μi with corresponding μ (i ). Now consider that the variance introduced by a parameter, as expressed by the Variance/Covariance matrix, will be scaled if the parameter itself is artificially scaled. Specifically the impact on the covariances will allow the model to rebalance in the presence of correlated parameters.
5.3.4 The Variance/Covariance matrix itself will adjust simply according to the normal result for scaled variances.  $Var\left( {\lambda {{Y}_i}} \right)\, = \,{{\lambda }^2} Var\left( {{{Y}_i}} \right)$. In this case the elements of the Variance/Covariance matrix need to be replaced with
 $$C_{{jk}}^{\ast} \, = \,\left\{ {\matrix{ {Var\left( {{{\lambda }_j}{{\beta }_j}} \right)\, = \,\lambda _{j}^{2} Var\left( {{{\beta }_j}} \right)} & {,j\, = \,k} \cr\ {Cov\left( {{{\lambda }_j}{{\beta }_j},{{\lambda }_k}{{\beta }_k}} \right)\, = \,{{\lambda }_j}{{\lambda }_k}Cov\left( {{{\beta }_j},{{\beta }_k}} \right)} & {,j\, \ne \,k} \\\end{}} \right\;{\rm{where}}\;{{\lambda }_j}\, = \,\frac{{\beta _{j}^{\ast} }}{{{{\beta }_j}}}$$
5.3.5 From this a scaled version of the Hat diagonal can be calculated.  $h_{i}^{\ast} \, = \,\mathop{\sum}\sidelimits_{jk} {{{X}_{ij}}C_{{jk}}^{\ast} {{X}_{ik}}{{W}_i}} \, = \,\mathop{\sum}\sidelimits_{jk} {\frac{{{{X}_{ij}}\beta _{j}^{\ast} {{C}_{jk}}{{X}_{ik}}\beta _{k}^{\ast} {{W}_i}}}{{{{\beta }_j}{{\beta }_k}}}} $ which produces new Linear Predictors
 $\eta _{{\left( i \right)}}^{\ast} \, = \,\eta _{i}^{\ast} {\rm{ - }}\left( {\frac{{h_{i}^{\ast} }}{{1{\rm{ - }}h_{i}^{\ast} }}} \right)g^{\prime}\left( {{{\mu }_i}} \right)\left( {{{y}_i}{\rm{ - }}{{\mu }_i}} \right)$ and “Case Deleted” Estimates
 $\mu _{{\left( i \right)}}^{\ast} \, = \,{{g}^{{\rm{ - }}1}} \left( {\eta _{{\left( i \right)}}^{\ast} } \right)$.
5.4 Idea of a Model Depreciation Index
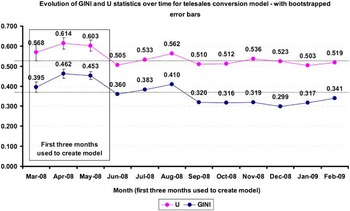
5.4.1 To draw an analogy, the value of a model is like that of a used car. The instant it rolls off the forecourt it loses a chunk of its predictive power simply by virtue of the fact that it is now being used on new data rather than measured in a circular fashion against the data used to define it.
5.4.2 As time passes, the value decreases further, as was illustrated by the Model Validation working party last year. Figure 11 is an extract from page 10 of their report (Berry et al., Reference Berry, Hemming, Matov and Morris2009).
Source: Model Validation Working Party

5.4.3 The Noise Reduction technique provides an indication of that initial depreciation, by reference to the scale factors which have been derived.
5.4.4 Without applying the scale factors, deploying the full model, would result in a worse model than the scaled one.
6. Calculation Of Noise Reduced Model
6.1 Specification of Penalty Function and Two Tier Modelling Process
6.1.1 First obtain the results of the normal Generalised Linear Model fit, as outlined in A.1.10. Next calculate the ‘Case Deleted’ Linear Predictors  ${{\eta }_{\left( i \right)}}\, = \,{{\eta }_i}{\rm{ - }}\left( {\frac{{{{h}_i}}}{{1{\rm{ - }}{{h}_i}}}} \right)g^{\prime}\left( {{{\mu }_i}} \right)\left( {{{y}_i}{\rm{ - }}{{\mu }_i}} \right)$, and Estimates
 $\mu _{{\left( i \right)}}^{{}} \, = \,{{g}^{{\rm{ - }}1}} \left( {\eta _{{\left( i \right)}}^{{}} } \right)$. Now using the superscript * to denote new parameters and estimates
 $\beta _{j}^{\ast}, \,\eta _{i}^{\ast}, \,\mu _{i}^{\ast} $ which we will estimate from the new penalty function.
6.1.2 The Hat diagonal hi is a measure of the influence attaching to the data point y 1 with (1−hi) the influence of the remaining points. This includes the effect of the Variance of parameter βj, Var(βj) and the Covariance of this with the other parameters Cov(βj, βk). Now suppose that βj is scaled back to a value  $\beta _{j}^{\ast} $, this will reduce the variance to
 $Var\left( {\beta _{j}^{\ast} } \right)\, = \,{{\left( {\frac{{\beta _{j}^{\ast} }}{{{{\beta }_j}}}} \right)}^2} Var\left( {{{\beta }_j}} \right)$ and the Covariances to
 $C_{{jk}}^{\ast} \, = \,Cov\left( {\beta _{j}^{\ast}, \beta _{k}^{\ast} } \right)\, = \,\left( {\frac{{\beta _{j}^{\ast} }}{{{{\beta }_j}}}\frac{{\beta _{k}^{\ast} }}{{{{\beta }_k}}}} \right)Cov\left( {{{\beta }_j},{{\beta }_k}} \right)$. These are not the same as the variance results that would occur from a model which had generated these parameter values directly. Using these values we can scale back the ‘Case Deleted’ Estimates that would apply to the new parameters.
 $\eta _{{\left( i \right)}}^{\ast} \, = \,\eta _{i}^{\ast} {\rm{ - }}\left( {\frac{{h_{i}^{\ast} }}{{1{\rm{ - }}h_{i}^{\ast} }}} \right)g^{\prime}\left( {{{\mu }_i}} \right)\left( {{{y}_i}{\rm{ - }}{{\mu }_i}} \right)$ where
 $h_{i}^{\ast} \, = \,\mathop{\sum}\sidelimits_{jk} {\frac{{{{X}_{ij}}\beta _{j}^{\ast} {{C}_{jk}}{{X}_{ik}}\beta _{k}^{\ast} {{W}_i}}}{{{{\beta }_j}{{\beta }_k}}}} $. The superscript * quantities are then derived using a similar method to original parameters, described in Appendix A, with non-linear adjustments (Murphy, Reference Murphy, Lee and Brockman2005) to allow for the more complex definition of η(i).
7. Worked Example
7.1 Log Poisson Frequency Model
7.1.1 This example is taken from a Motor Third Party Bodily Injury example dataset. This model has a large sample size of 500,000 with around 30,000 responses.
7.1.2 A full complexity model was built upon the data, using 31 factors with 54 parameters, of which 8 were interactions.
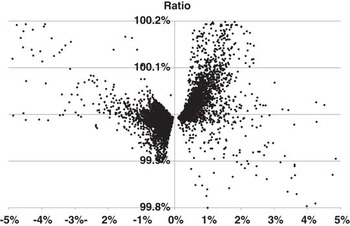
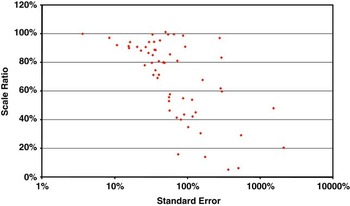
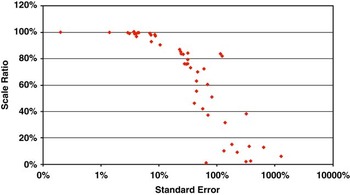
7.1.3 Figure 12 shows the relationship between the Standard Error (x-axis) reported by the GLM and the Scale Factor (y-axis) recommended by the Noise Reduction technique.
Scatter Chart of GLM Standard Error and Noise Reduced Scale Factor for a Log-Poisson Frequency Model

7.1.4 A few parameters were retained beyond the normal acceptance threshold, to show the fall-off between higher errors and the scale factor.
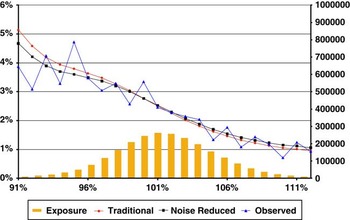
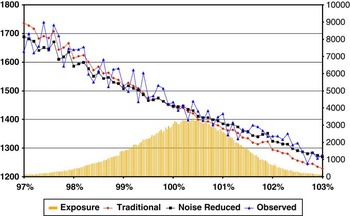
7.1.5 Figure 13 shows the ratio of the two models (x-axis), and the average observed response and model prediction values (y-axis), plus the exposure as bars (2nd y-axis). Models here have been fitted on the training dataset, and then rescored against the hold-out dataset, the chart then measures their value against observed data from the hold-out dataset.
Out of Sample Model Comparison Chart for a Log-Poisson Frequency Model

7.1.6 The models show varying predictions with a ratio substantially between +/− 5%. The noise reduced model produces predictions which are scaled towards the mean, which temper the predictions made by the GLM at the extremes of the distribution.
7.1.7 Using a simple business model with a price comparison website level of elasticity fixed at 10 shows a profit margin improvement in this example of 0.57% at constant volumes.
7.2 Log Gamma Severity Model
7.2.1 This example is taken from a Motor Accidental Damage Severity example dataset. To contrast with the previous frequency model, a sample size of 12,000 was used with an average response of 1,450.
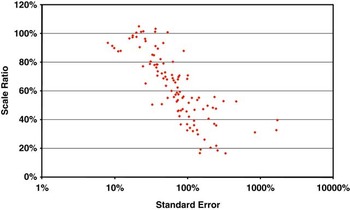
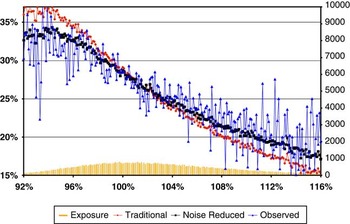
7.2.2 A full complexity model was built upon the data, using 18 factors with 59 parameters, of which 17 were interactions (see figures 14 and 15).
Scatter Chart of GLM Standard Error and Noise Reduced Scale Factor for a Log-Gamma Severity

Out of Sample Model Comparison Chart for a Log-Gamma Severity Model

7.2.3 Using a simple business model with a price comparison website level of elasticity fixed at 10 shows a profit margin improvement in this example of 0.69% at constant volumes.
7.3 Logit Binomial Proportion of Collisions with Bodily Injury Model
7.3.1 This example is a propensity model built on a Motor dataset using collision as the exposure measure, and proportion of Bodily Injuries on the claim as the response. Such an approach is sometimes used to increase the patterns detected in sparse Bodily Injury data. The sample size was 22,000.
7.3.2 The model is using 19 factors with 108 parameters with no interactions (see figures 16 and 17).
Scatter Chart of GLM Standard Error and Noise Reduced Scale Factor for a Logit-Binomial Propensity Model

Out of Sample Model Comparison Chart for a Logit-Binomial Propensity Model

7.3.3 Using a simple business model with a price comparison website level of elasticity fixed at 10 shows a large profit margin improvement in this example of 3.4% at constant volumes.
7.4 Poor Model
7.4.1 In this example a particularly poor set of parameters were retained to find out how effectively the technique was at removing ones that are not significant. The chart below shows that scale factors quite close to zero are achieved. The resultant model however was still very poor, as the technique does nothing to add significant factors which are missing from the original model (see figure 18).
Scatter Chart of GLM Standard Error and Noise Reduced Scale Factor for a Poor Model

8. Conclusions
8.1 Summary of results
8.1.1 Larger datasets and increased competition spurred by price comparison websites have created a natural environment for the development of models at the limit of complexity. In this situation over-fitting is an increasing problem that cannot simply be avoided by the rejection of borderline parameters, as this would risk the penalty of anti-selection.
8.1.2 The Case Deleted Deviance measure discussed in this paper provides an objective method to compare two models that is consistent with the standard error when the two models only differ by a single parameter. It can also be used to compare more complex differences between nested models, and also where the two models are not nested. This is an improvement on the current deviance measure.
8.1.3 The Noise Reduction technique then makes use of this measure to produce scaled back parameters for a model. This is a novel alternative to the standard approach of accepting or rejecting a parameter completely. It also represents a mechanism to select parameters which will be most predictive on a hold-out dataset, rather than simply optimising the parameter values based on the training dataset.
8.1.4 Given the real business risks of anti-selection from using a model which is too simple, another alternative using this technique would be to deliberately over-fit the model including some borderline parameters, and then use this method to scale them back. Further research could be conducted to investigate the relative benefits of this new process compared to the standard method.
8.1.5 This technique clearly will not directly solve the issue of identifying patterns not in the data due to insufficient exposure in the ‘corners’ of risk segments. Currently this issue is dealt with by underwriting overlays either through additional loadings or acceptance/referral criteria and this process will still need to be applied after the “pure” modelling process.
8.1.6 Beyond the demonstration of this technique to GLM modelling, this concept can be applied to any model forms where parameters are derived from a dataset. Classification techniques for postcode smoothing and vehicle grouping may benefit from this, as could other methods such as decision trees and neural networks.
Acknowledgements
The authors would like to thank the following people for their helpful comments and input during the production of this paper: Mark Sinclair-McGarvie, Duncan Anderson, Catherine Scullion, Sami Abdel-Gadir, Michael Korner, Karl Murphy, Colin Towers, John Berry.
Generalised Linear Models
A.1 Derivation and Notation
A.1.1 The following derivation is drawn from Anderson et al. (Reference Anderson, Feldblum, Modlin, Schirmacher, Schirmacher and Thandi2007) and Dobson (Reference Dobson2001) and although well known is included so that the non-linear variant can be derived using the same notation in the main body of the text. Another useful overview can be found in Hocking (Reference Hocking1996).
A.1.2 Let Yi be a series of random variables belonging to the exponential family of distributions, expressed in canonical form with natural parameter θi by the pdf.  $f\left( {{{y}_i},{{\theta }_i}} \right)\, = \,\exp \left( {{{{\frac{{{{\omega }_i}}}{\varphi }}}_{}}\left( {{{y}_i}{{\theta }_i}{\rm{ - }}a\left( {{{\theta }_i}} \right)} \right)\, + \,b\left( {{{y}_i},\varphi } \right)} \right)$ where ωi is a constant related to Yi representing the weight which is commonly the exposure for insurance applications, and φ is the scale parameter
A.1.3 Given  ${{\int \!{f\left( {{{y}_i},{{\theta }_i}} \right)} }_{}}d{{y}_i} = 1$ we have
 $\int \!{\frac{\partial }{{\partial {{\theta }_i}}}} f\left( {{{y}_i},{{\theta }_i}} \right) = 0 = \int {{{{\frac{{{{\omega }_i}}}{\varphi }}}_{}}{{{\left( {{{y}_i}{\rm{ - }}a^{\prime}\left( {{{\theta }_i}} \right)} \right)}}_{}}f\left( {{{y}_i},{{\theta }_i}} \right)} $ and
 $\int \!{\frac{{{{\partial }^2} }}{{\partial \theta _{i}^{2} }}} f\left( {{{y}_i},{{\theta }_i}} \right) = 0 = \int {{{{\left[ {{{{\frac{{{{\omega }_i}}}{\varphi }}}_{}}\left( {{\rm{ - }}a^{\prime\prime}\left( {{{\theta }_i}} \right)} \right)\, + \,{{{\left( {{{{\frac{{{{\omega }_i}}}{\varphi }}}_{}}\left( {{{y}_i}{\rm{ - }}a^{\prime}\left( {{{\theta }_i}} \right)} \right)} \right)}}^2} } \right]}}_{}}f\left( {{{y}_i},{{\theta }_i}} \right)}.$
A.1.4 The first of these gives  $E\left[ {{{Y}_i}} \right]\, = \,a^{\prime}\left( {{{\theta }_i}} \right)$ and substituting this into the second gives
 $a^{\prime\prime}\left( {{{\theta }_i}} \right)\, = \,{{\frac{{{{\omega }_i}}}{\varphi }}_{}}E\left[ {{{{\left( {{{Y}_i}{\rm{ - }}E\left[ {{{Y}_i}} \right]} \right)}}^2} } \right]\, = \,{{\frac{{{{\omega }_i}}}{\varphi }}_{}}Var\left[ {{{Y}_i}} \right]$ we define
 ${{\mu }_i}\, = \,E\left[ {{{Y}_i}} \right]\, = \,a^{\prime}\left( {{{\theta }_i}} \right)$ and
 $V\left( {{{\mu }_i}} \right)\, = \,a^{\prime\prime}\left( {{{\theta }_i}} \right)\, = \,a^{\prime\prime}\left( {{{{a^{\prime}}}^{{\rm{ - }}1}} \left( {{{\mu }_i}} \right)} \right)\, = \,{{\frac{{{{\omega }_i}}}{\varphi }}_{}}Var\left[ {{{Y}_i}} \right].$
A.1.5 Let the log likelihood function be denoted by  $l\left( {{{y}_i},{{\theta }_i}} \right)\, = \,\mathop{\sum}\sidelimits_i {{{{\frac{{{{\omega }_i}}}{\varphi }}}_{}}\left( {{{y}_i}{{\theta }_i}{\rm{ - }}a\left( {{{\theta }_i}} \right)} \right)\, + \,b\left( {{{y}_i},\varphi } \right)} $
A.1.6 Further define the linear predictor and the link function for the model  ${{\eta }_i}\, = \,g\left( {{{\mu }_i}} \right)$, where the linear predictor is a linear combination of the parameters
 ${{\eta }_i}\, = \,\mathop{\sum}\sidelimits_j {{{X}_{ij}}{{\beta }_j}} $.
A.1.7 First we define the score statistic  ${{U}_j}\, = \,\frac{{\partial l}}{{\partial {{\beta }_j}}}$ and obtain the result by deriving each of the following terms in order:
 ${{U}_j}\, = \,\mathop{\sum}\sidelimits_i {\frac{{\partial {{l}_i}}}{{\partial {{\theta }_i}}}\frac{{\partial {{\theta }_i}}}{{\partial {{\mu }_i}}}\frac{{\partial {{\mu }_i}}}{{\partial {{\eta }_i}}}\frac{{\partial {{\eta }_i}}}{{\partial {{\beta }_j}}}}\frac{{\partial {{l}_i}}}{{\partial {{\theta }_i}}}\, = \,{{\frac{{{{\omega }_i}}}{\varphi }}_{}}\left( {{{y}_i}{\rm{ - }}a^{\prime}\left( {{{\theta }_i}} \right)} \right)\, = \,{{\frac{{{{\omega }_i}}}{\varphi }}_{}}\left( {{{y}_i}{\rm{ - }}{{\mu }_i}} \right)$,
 $\frac{{\partial {{\mu }_i}}}{{\partial {{\theta }_i}}}\, = \,a^{\prime\prime}\left( {{{\theta }_i}} \right)\, = \,V\left( {{{\mu }_i}} \right),\; \; \frac{{\partial {{\eta }_i}}}{{\partial {{\mu }_i}}}\, = \,g^{\prime}\left( {{{\mu }_i}} \right)\; \; \frac{{\partial {{\eta }_i}}}{{\partial {{\beta }_j}}}\, = \,{{X}_{ij}}.$ Giving
 ${{U}_j}\, = \,\frac{{\partial l}}{{\partial {{\beta }_j}}}\, = \,\mathop{\sum}\sidelimits_i {\frac{{{{\omega }_i}{{X}_{ij}}\left( {{{y}_i}{\rm{ - }}{{\mu }_i}} \right)}}{{{{\varphi }_{}}g^{\prime}\left( {{{\mu }_i}} \right)V\left( {{{\mu }_i}} \right)}}} \, = \,\mathop{\sum}\sidelimits_i {{{W}_i}g^{\prime}\left( {{{\mu }_i}} \right){{X}_{ij}}\left( {{{y}_i}{\rm{ - }}{{\mu }_i}} \right)} $. Where
 ${{W}_i}\, = \,\frac{{{{\omega }_i}}}{{{{\varphi }_{}}{{{\left( {g^{\prime}\left( {{{\mu }_i}} \right)} \right)}}^2} V\left( {{{\mu }_i}} \right)}}$ for reasons that will become clearer below. Note also that
 $E\left[ {{{U}_j}} \right]\, = \,E\left[ {\mathop{\sum}\sidelimits_i {{{W}_i}g^{\prime}\left( {{{\mu }_i}} \right){{X}_{ij}}\left( {{{y}_i}{\rm{ - }}{{\mu }_i}} \right)} } \right]\, = \,\mathop{\sum}\sidelimits_i {{{W}_i}g^{\prime}\left( {{{\mu }_i}} \right){{X}_{ij}}\left( {E\left[ {{{Y}_i}} \right]{\rm{ - }}{{\mu }_i}} \right)} \, = \,0.$
A.1.8 Next, Dobson (Reference Dobson2001) derives an approximation by first defining the information matrix  ${{J}_{jk}}\, = \,Cov\left( {{{U}_j},{{U}_k}} \right)$, and using
 $E\left[ {{{U}_j}} \right]\, = \,0.$
 ${{J}_{jk}}\, = \,E\left[ {( {{{U}_j}{\rm{ - }}E[ {{{U}_j}} \right]} \right)\left( {{{U}_k}{\rm{ - }}E\left[ {{{U}_k}} \right]} \right)} \right]\, = \,E\left[ {{{U}_j}{{U}_k}} \right]\, = \,\mathop{\sum}\sidelimits_i {{{{\left( {\frac{{{{\omega }_i}}}{{{{\varphi }_{}}g^{\prime}\left( {{{\mu }_i}} \right)V\left( {{{\mu }_i}} \right)}}} \right)}}^2} {{X}_{ij}}{{X}_{ik}}E\left[ {{{{\left( {{{Y}_i}{\rm{ - }}{{\mu }_i}} \right)}}^2} } \right]}. $
 $\scale95%{{{J}_{jk}} = \,\mathop{\sum}\sidelimits_i {{{{\left( {\frac{{{{\omega }_i}}}{{{{\varphi }_{}}g^{\prime}\left( {{{\mu }_i}} \right)V\left( {{{\mu }_i}} \right)}}} \right)}}^2} {{X}_{ij}}{{X}_{ik}}Var\left[ {{{Y}_i}} \right]} \, = \,\mathop{\sum}\sidelimits_i {\frac{{{{\omega }_i}}}{{{{\varphi }_{}}{{{\left( {g^{\prime}\left( {{{\mu }_i}} \right)} \right)}}^2} V\left( {{{\mu }_i}} \right)}}{{X}_{ij}}{{X}_{ik}} \, = <$>$<>\mathop{\sum}\sidelimits_i {{{X}_{ij}}{{W}_i}{{X}_{ik}}} .$
A.1.9 To solve for the parameters in the general case we use an extension of the Newton Raphson formula (Press, Reference Press, Flannery, Teukolsky and Vetterling2002)  ${\pre}^{{m\, + \,1}}{{\beta }_j} = \,{\pre}^{m}{{\beta }_j}{\rm{ - }}\mathop{\sum}\limits_k {{{{\left( {{\pre}^{m}{{{U^{\prime}}}_{jk}}} \right)}}^{{\rm{ - }}1}} {\pre}^{m}{{U}_k}} $ to find the root of
 $\mathop{\sum}\sidelimits_j {{{U}_j}} \, = \,0,\; {{U^{\prime}}_{jk}}\, = \,\frac{{\partial {{U}_j}}}{{\partial {{\beta }_k}}}\, = \,\mathop{\sum}\sidelimits_i {\frac{{\partial \left( {{{W}_i}g^{\prime}\left( {{{\mu }_i}} \right)} \right)}}{{\partial {{\beta }_k}}}{{X}_{ij}}\left( {{{y}_i}{\rm{ - }}{{\mu }_i}} \right) + {{W}_i}g^{\prime}\left( {{{\mu }_i}} \right){{X}_{ij}}\left( {\frac{{\partial \left( {{{y}_i}{\rm{ - }}{{\mu }_i}} \right)}}{{\partial {{\eta }_i}}}\frac{{\partial {{\eta }_i}}}{{\partial {{\beta }_k}}}} \right)}. $
At the stationary point we are seeking  $\mathop{\sum}\limits_i {{{\omega }_i}{{X}_{ij}}\left( {{{y}_i}{\rm{ - }}{{\mu }_i}} \right)} $ will be close to zero.
For the structures noted in 4.3.3 this will be exactly zero, and  $g^{\prime}\left( {{{\mu }_i}} \right)V\left( {{{\mu }_i}} \right)\, = \,1$, giving
 $\frac{{\partial \left( {{{W}_i}g^{\prime}\left( {{{\mu }_i}} \right)} \right)}}{{\partial {{\beta }_k}}}\, = \,0$. Hence the first term is normally ignored.
 ${{U^{\prime}}_{jk}}\, = \,\frac{{\partial {{U}_j}}}{{\partial {{\beta }_k}}}\, = \,\mathop{\sum}\sidelimits_i {{\rm{ - }}{{W}_i}g^{\prime}\left( {{{\mu }_i}} \right){{X}_{ij}}} \left( {\frac{{\partial {{\mu }_i}}}{{\partial {{\eta }_i}}}\frac{{\partial {{\eta }_i}}}{{\partial {{\beta }_k}}}} \right)\, = \,\mathop{\sum}\sidelimits_i {{\rm{ - }}{{X}_{ij}}{{W}_i}{{X}_{ik}}} \, = \,{\rm{ - }}{{J}_{jk}}.$
A.1.10 Then we obtain the usual formula for iteration m, where  $\scale85%{{\pre}^{{m\, + \,1}}{{\hat{\beta }}_j}\, = \,{\pre}^{m}{{\hat{\beta }}_j}\, + \,\mathop{\sum}\sidelimits_{ik} {{{{\left( {\mathop{\sum}\sidelimits_p {{{X}_{pj}}{\pre}^{m}{{W}_p}{{X}_{pk}}} } \right)}}^{{\rm{ - }}1}} <$>$<>\scale85%{{{X}_{ik}}{\pre}^{m}{{W}_i}g^{\prime}\left( {{\pre}^{m}{{\mu }_i}} \right)\left( {{{y}_i}{\rm{ - }}{\pre}^{m}{{\mu }_i}} \right)} $ sometimes written as
 $\scale85%{{\pre}^{{m\, + \,1}}{{\hat{\beta }}_j} = \mathop{\sum}\sidelimits_{ik} {{{{\left( {\mathop{\sum}\sidelimits_p {{{X}_{pj}}{\pre}^{m}{{W}_p}{{X}_{pk}}} } \right)}}^{{\rm{ - }}1}}{{X}_{ik}}{\pre}^{m}{{W}_i}{\pre}^{m}\left( {{{\eta }_i}\, + \,g^{\prime}\left( {{\pre}^{m}{{\mu }_i}} \right)\left( {{{y}_i}{\rm{ - }}{\pre}^{m}{{\mu }_i}} \right)} \right)} $ English (Reference English2000–9).
A.1.11 From these results the Variance-Covariance matrix is available  ${{C}_{jk}}\, = \,{{\left( {\mathop{\sum}\sidelimits_p {{{X}_{pj}}{\pre}^{m}{{W}_p}{{X}_{pk}}} } \right)}^{{\rm{ - }}1}} $ along with the Hat Matrix
 ${{H}_{ip}}\, = \,\mathop{\sum}\sidelimits_{jk} {W_{i}^{{1/2}} {{X}_{ij}}{{C}_{jk}}{{X}_{pk}}W_{p}^{{1/2}} } $ and the Hat diagonal hi = Hii.