Introduction
Worldwide, cannabis remains one of the most widely used illicit drugs (United Nations Office on Drugs & Crime, 2016) which is associated with a number of adverse mental and psychosocial outcomes (Moore et al. Reference Moore, Zammit, Lingford-Hughes, Barnes, Jones and Burke2007; Crippa et al. Reference Crippa, Zuardi, Martin-Santos, Bhattacharyya, Atakan and McGuire2009; Meier et al. Reference Meier, Caspi, Ambler, Harrington, Houts and Keefe2012; Marconi et al. Reference Marconi, Di Forti, Lewis, Murray and Vassos2016; Patel et al. Reference Patel, Wilson, Jackson, Ball, Shetty and Broadbent2016; Schoeler et al. Reference Schoeler, Kambeitz, Behlke, Murray and Bhattacharyya2016a, Reference Schoeler, Monk, Sami, Klamerus, Foglia and Brownb, Reference Schoeler, Petros, Di Forti, Klamerus, Foglia and Ajnakinac, Reference Schoeler, Petros, Di Forti, Pingault, Klamerus and Fogliad, Reference Schoeler, Theobald, Pingault, Farrington, Jennings and Piqueroe). Hence, effects of cannabis use on brain structure and function that may underpin its effects on cognition and behaviour are of particular interest, more so in light of the legislative changes governing its use, for example in the USA (Volkow et al. Reference Volkow, Swanson, Evins, DeLisi, Meier and Gonzalez2016). The residual cognitive effects of cannabis use have been most robustly observed in memory (Grant et al. Reference Grant, Gonzalez, Carey, Natarajan and Wolfson2003) and its various sub-domains (Schoeler et al. Reference Schoeler, Kambeitz, Behlke, Murray and Bhattacharyya2016a) suggesting that the medial temporal lobe (MTL) structures, which play a critical role in learning and memory (Eichenbaum et al. Reference Eichenbaum, Yonelinas and Ranganath2007), are of particular interest in terms of the effects of cannabis use on their structure and function. Pharmacological challenge studies offering greater experimental control consistently show acute effects of cannabinoids on MTL function using fMRI (Borgwardt et al. Reference Borgwardt, Allen, Bhattacharyya, Fusar-Poli, Crippa and Seal2008; Phan et al. Reference Phan, Angstadt, Golden, Onyewuenyi, Popovska and de Wit2008; Bhattacharyya et al. Reference Bhattacharyya, Fusar-Poli, Borgwardt, Martin-Santos, Nosarti and O'Carroll2009; Bhattacharyya et al. Reference Bhattacharyya, Morrison, Fusar-Poli, Martin-Santos, Borgwardt and Winton-Brown2010; Bhattacharyya et al. Reference Bhattacharyya, Atakan, Martin-Santos, Crippa, Kambeitz and Prata2012a; Reference Bhattacharyya, Crippa, Allen, Martin-Santos, Borgwardt and Fusar-Polib; Bossong et al. Reference Bossong, van Hell, Jager, Kahn, Ramsey and Jansma2013; Batalla et al. Reference Batalla, Crippa, Busatto, Guimaraes, Zuardi and Valverde2014; Bossong et al. Reference Bossong, Jager, Bhattacharyya and Allen2014; Bhattacharyya et al. Reference Bhattacharyya, Atakan, Martin-Santos, Crippa, Kambeitz and Malhi2015a; Reference Bhattacharyya, Falkenberg, Martin-Santos, Atakan, Crippa and Giampietrob; Bhattacharyya et al. Reference Bhattacharyya, Egerton, Kim, Rosso, Riano Barros and Hammers2017; Bhattacharyya et al. Reference Bhattacharyya, Sainsbury, Allen, Nosarti, Atakan and Giampietro2018). However, studies investigating the long-term effects of cannabis use on brain structure and function have been less consistent in terms of effects on MTL structure and function [reviewed here (Batalla et al. Reference Batalla, Bhattacharyya, Yucel, Fusar-Poli, Crippa and Nogue2013; Lorenzetti et al. Reference Lorenzetti, Solowij, Fornito, Lubman and Yucel2014)], potentially because of modest sample sizes, differing degrees of cannabis exposure, genetic differences between participants and potential differences in strains of cannabis used by them (Bhattacharyya et al. Reference Bhattacharyya, Morrison, Fusar-Poli, Martin-Santos, Borgwardt and Winton-Brown2010; Bhattacharyya et al. Reference Bhattacharyya, Atakan, Martin-Santos, Crippa, Kambeitz and Prata2012a; Bhattacharyya et al. Reference Bhattacharyya, Iyegbe, Atakan, Martin-Santos, Crippa and Xu2014; Bhattacharyya et al. Reference Bhattacharyya, Falkenberg, Martin-Santos, Atakan, Crippa and Giampietro2015b). Furthermore, available evidence from cross-sectional studies do not help disentangle whether group differences in brain structure and function are a result of cannabis use or alternatively may predispose to cannabis use. In the absence of ethically impermissible randomised controlled studies involving long-term experimental treatment with cannabis or placebo or logistically complex longitudinal study designs with multipoint assessment over the life course (Schoeler et al. Reference Schoeler, Theobald, Pingault, Farrington, Jennings and Piquero2016e), cross-sectional observational studies using sibling or twin data offer the best possibility of disentangling cause and effect relationships. Using this approach Pagliaccio et al. (Reference Pagliaccio, Barch, Bogdan, Wood, Lynskey and Heath2015) have recently shown that cannabis exposure was associated with smaller left amygdala volume, which was attributable to shared predispositional factors rather than being a consequence of cannabis use. In another large study, adolescent cannabis use was associated with lower mean cortical thickness (across the entire cortex) in males with a high genetic risk for schizophrenia (French et al. Reference French, Gray, Leonard, Perron, Pike and Richer2015) with the largest differences between those exposed and those unexposed to cannabis being in brain regions with high cannabinoid receptor expression, e.g. entorhinal and anterior cingulate cortex. However, conflicting evidence has emerged from smaller studies that have examined the relationship between cannabis exposure and cortical thickness measures especially in the entorhinal cortex (Jacobus et al. Reference Jacobus, Squeglia, Sorg, Nguyen-Louie and Tapert2014; Jacobus et al. Reference Jacobus, Squeglia, Meruelo, Castro, Brumback and Giedd2015).
Within the MTL structures that play a critical role in mnemonic processing, evidence suggests distinct contributions of different regions of the medial temporal cortex to memory. While the hippocampus plays a critical role in the recall of information along with the parahippocampal cortex, the entorhinal and perirhinal cortices are particularly necessary for familiarity-based recognition (Eichenbaum et al. Reference Eichenbaum, Yonelinas and Ranganath2007). In particular, the entorhinal and adjacent parahippocampal cortices are thought to be involved in the representation of object-related and spatial information during encoding (Navarro Schroder et al. Reference Navarro Schroder, Haak, Zaragoza Jimenez, Beckmann and Doeller2015; Schultz et al. Reference Schultz, Sommer and Peters2015). The entorhinal and adjacent parahippocampal cortices are of particular interest in terms of the effects of cannabis use as unimodal and polymodal neocortical projections that bring information to the hippocampus for this to be bound into an integrated memory trace, pass through them before they converge on the hippocampus (Munoz & Insausti, Reference Munoz and Insausti2005; Navarro Schroder et al. Reference Navarro Schroder, Haak, Zaragoza Jimenez, Beckmann and Doeller2015). Furthermore, the relationship between cannabis expsoure and hippocampal and amygdala structure has already been investigated using the HCP cohort in a couple of other studies. For example, Pagliaccio et al. (Reference Pagliaccio, Barch, Bogdan, Wood, Lynskey and Heath2015) did not find evidence of an association between cannabis use and hippocampal volume supportive of either causal or predispositional relationship. Another study by Orr and colleagues (Orr et al. Reference Orr, Paschall and Banich2016) has also investigated the parametric relationship between cannabis use measures and white matter intergity as well as volume and shape of cortical and subcortical structures using a larger dataset from the HCP cohort. They showed an association between number of times of cannabis use over lifetime and the shape of amygdala and hippocampus. On the other hand, the precise direction of change in the thickness and surface area of the entorhinal and parahippocampal cortices, in relation to cannabis use and whether such changes are a cause or consequence of cannabis use is unclear (Jacobus et al. Reference Jacobus, Squeglia, Sorg, Nguyen-Louie and Tapert2014; Jacobus et al. Reference Jacobus, Squeglia, Meruelo, Castro, Brumback and Giedd2015). Hence, the primary objective of the present study was to employ the sibling-pair design using data collected as part of the Human Connectome Project (HCP) to investigate the nature of the relationship between cannabis use and thickness and surface area of the entorhinal and parahippocampal cortices. While cortical volume alterations have often been the focus of investigations in the context of cannabis use (reviewed in Batalla et al. Reference Batalla, Bhattacharyya, Yucel, Fusar-Poli, Crippa and Nogue2013)and (Lorenzetti et al. Reference Lorenzetti, Solowij and Yucel2016), there has been growing acceptance that cortical volume is a composite measure that is principally determined by two dimensions of the cortical sheet, i.e. its surface area and thickness and focus on the cortical volume measure alone can obscure information about these two distinct determinants of cortical volume (Im et al. Reference Im, Lee, Lyttelton, Kim, Evans and Kim2008; Raznahan et al. Reference Raznahan, Shaw, Lalonde, Stockman, Wallace and Greenstein2011; Tamnes et al. Reference Tamnes, Herting, Goddings, Meuwese, Blakemore and Dahl2017) Specific focus on cortical thickness and surface area is particularly important as they capture the effects of distinct developmental, evolutionary, genetic and cellular processes (Panizzon et al. Reference Panizzon, Fennema-Notestine, Eyler, Jernigan, Prom-Wormley and Neale2009; Raznahan et al. Reference Raznahan, Shaw, Lalonde, Stockman, Wallace and Greenstein2011; Chen et al. Reference Chen, Fiecas, Gutierrez, Panizzon, Eyler and Vuoksimaa2013; Geschwind & Rakic, Reference Geschwind and Rakic2013; Storsve et al. Reference Storsve, Fjell, Tamnes, Westlye, Overbye and Aasland2014; Wierenga et al. Reference Wierenga, Langen, Oranje and Durston2014; Lyall et al. Reference Lyall, Shi, Geng, Woolson, Li and Wang2015; Tamnes et al. Reference Tamnes, Herting, Goddings, Meuwese, Blakemore and Dahl2017) as well as experiences (Sirevaag & Greenough, Reference Sirevaag and Greenough1988; Park et al. Reference Park, Lee, Kim, Park, Oh and Lee2009; French et al. Reference French, Gray, Leonard, Perron, Pike and Richer2015). Given the organisation of the cerebral cortex into columnar functional units (Mountcastle, Reference Mountcastle1997), it is thought that surface area of the cortex is influenced by the number of functional columns, while cortical thickness is influenced by the number of cells in these columns (Rakic, Reference Rakic1988, Reference Rakic1995, Reference Rakic2007). In light of previous evidence (summarised earlier), we hypothesised that changes in cortical thickness and surface area in the entorhinal and parahippocampal cortices would reflect a causal effect of cannabis use on these structures rather than reflecting shared predisposition. Specifically, we hypothesised that cannabis-exposed siblings from gender-matched sibling pairs discordant for cannabis exposure would have significantly thinner entorhinal and parahippocampal cortices and smaller surface area of these regions compared with siblings not exposed to cannabis from the same gender-matched sibling pairs discordant for cannabis exposure. We also hypothesised that the cortical thickness and surface area of these regions from both groups of siblings (i.e. cannabis-exposed and non-exposed) from sibling pairs discordant for cannabis exposure would not be significantly different from sibling pairs who were both exposed to or not exposed to cannabis.
Materials and methods
Participants
All data were obtained from the S900 release (December, 2015) of data collected as part of the HCP (https://db.humanconnectome.org/), which plans to recruit 1200 twins and non-twin siblings excluding individuals whose siblings have neuropsychiatric, neurologic or severe neurodevelopmental disorders, but including persons with history of alcohol or recreational substance use who did not need inpatient treatment for ⩾2 days or specialist treatment [for detailed exclusion/inclusion criteria please see (Van Essen et al. Reference Van Essen, Ugurbil, Auerbach, Barch, Behrens and Bucholz2012)]. For the present analyses, participants were excluded if pertinent interview/questionnaire/neuroimaging data were missing or where there was discrepancy between self-report information and related test result (e.g. positive urine test result for tetrahydrocannabinol with negative self-report) or in the absence of a gender-matched sibling. HCP data collection and public release were approved by the Institutional Review Board (IRB) of University of Washington in St. Louis (IRB # 201204036; Title: ‘Mapping the Human Connectome: Structure, Function, and Heritability’).
Information on Cannabis use
Cannabis exposure was assessed using the Semi-Structured Assessment for the Genetics of Alcoholism (SSAGA) (Bucholz et al. Reference Bucholz, Cadoret, Cloninger, Dinwiddie, Hesselbrock and Nurnberger1994). Lifetime exposure to cannabis was coded as a dichotomous categorical variable (1 = yes, 0 = no). Ordinal coding schemes were used to represent the reported age of first use of cannabis and information on frequency of lifetime cannabis use (defined as total number of times of reported cannabis use over lifetime). HCP codes for these two measures were as follows: age of first use (⩽14 year = 1; 15–17 year = 2; 18–20 year = 3;⩾21 year = 4) and frequency (never = 0; 1–5 = 1; 6–10 = 2; 11–25 = 3; 26–50 = 3; 51–100 = 3; 101–999 = 4; 1000–2000 = 5; >2000 = 5).
Neuro-anatomical data
T1-weighted brain images were acquired using a customised 3 T Siemens Skyra scanner employing a 3D MPRAGE sequence with the following pulse-sequence parameters: FOV = 224 mm, matrix size = 320, number of sagittal slices = 256, voxel dimension = 0.7 mm isotropic, TR = 2400 ms, TE = 2.14 ms, T1 = 1000 ms, FA = 8 degree, BW = 210 Hz per pixel, Echo Spacing = 7.6 ms, GRAPPA factor = 2. MR gradient nonlinearity-induced distortions of the individual T1-weighted images were corrected using FreeSurfer's package (gradient_nonlin_unwarp) (Fischl, Reference Fischl2012). T1-weighted images were aligned by rigid registration (degree of freedom = 6) using FMRIB's Linear Image Registration Tool (FLIRT) from FMRIB Software Library (FSL) (Jenkinson et al. Reference Jenkinson, Beckmann, Behrens, Woolrich and Smith2012) followed by FNIRT (FMRIB's Nonlinear Image Registration Tool) based non-linear registration. After intensity normalisation, images were processed using the appropriate FreeSurfer pipeline (recon-all) to estimate cortical thickness and surface area of the regions of interest (left and right parahippocampal gyri and left and right entorhinal cortices). Brain regions were defined as per Desikan–Killiany atlas (Desikan et al. Reference Desikan, Segonne, Fischl, Quinn, Dickerson and Blacker2006). MR image acquisition and image processing methods are detailed in (Glasser et al. Reference Glasser, Sotiropoulos, Wilson, Coalson, Fischl and Andersson2013).
Causal, graded liability and predisposition hypotheses
Gender-matched sibling pairs were classified into four groups based on their reported lifetime cannabis use. Sibling pairs who were both unexposed to cannabis were assigned to the ‘Concordant Unexposed’ (CU) group. Discordant Exposed (DE) and Discordant Unexposed (DU) groups included those members of the sibling pairs discordant for cannabis exposure who were exposed to or were not exposed to cannabis, respectively. Where both members of sibling pairs were exposed to cannabis, they were assigned to the Concordant Exposed (CE) group.
The Causal Hypothesis tested whether cannabis exposure caused changes in cortical thickness or surface area. As siblings reared together share 50% of their genes and a similar rearing environment, any observed differences in brain structure between Discordant Unexposed and Discordant Exposed groups were likely to provide preliminary support for the causal hypothesis, which would need confirmation by comparing monozygotic twin pairs discordant for cannabis use. The Graded liability and Predisposition hypotheses tested whether shared genetic or familial factors predispose to both cannabis use and changes in cortical thickness or surface area. To test the Graded liability hypothesis, Discordant Unexposed and Discordant Exposed groups were separately compared with the Concordant Exposed group. Significant differences would imply that the Concordant Exposed sibling pairs were at altered liability compared with the discordant pairs, as both siblings were exposed to cannabis in the Concordant Exposed group compared with only one member of the sibling pairs in Discordant group. To test the Predisposition hypothesis, Concordant Unexposed group was compared with all the other three groups to test whether the differences in neuro-anatomical measures and cannabis use were related to a shared predisposition, but that liability did not differ on the basis of concordance or discordance for cannabis exposure.
Following extreme-outlier removal (Tukey, Reference Tukey1977) there were N = 152, N = 51, N = 51 and N = 174 siblings in the Concordant Unexposed, Discordant Unexposed, Discordant Exposed and Concordant Exposed groups, respectively, constituting total 214 gender-matched sibling pairs (84 monozygotic, 69 dizygotic and 61 non-twin sibling pairs). A total of 214 siblings have reported exposure to cannabis out of total 404 siblings included in this study. Further details about these sibling groups are available in online Supplementary Table S1.
Potential confounds
Gender (Lv et al. Reference Lv, Li, He, Li, Zhao and Ai2010), ethnicity, zygosity, age (Thambisetty et al. Reference Thambisetty, Wan, Carass, An, Prince and Resnick2010), height, weight, total cortical surface area, average cortical thickness, total household income, picture vocabulary measure (as a proxy of IQ) (Menary et al. Reference Menary, Collins, Porter, Muetzel, Olson and Kumar2013), handedness (Li et al. Reference Li, Chen, Wang, Liu, Wang and Lu2015), NEO Five Factor Inventory (NEO-FFI) personality measures (Wright et al. Reference Wright, Williams, Feczko, Barrett, Dickerson and Schwartz2006) (conscientiousness, extroversion/introversion, neuroticism, openness, agreeableness), delayed discounting (impulsivity/self-regulation) (Schilling et al. Reference Schilling, Kuhn, Paus, Romanowski, Banaschewski and Barbot2013), depressive symptoms (Lev-Ran et al. Reference Lev-Ran, Roerecke, Le Foll, George, McKenzie and Rehm2014), childhood conduct problem (Hyatt et al. Reference Hyatt, Haney-Caron and Stevens2012) and alcohol (Wagner & Anthony, Reference Wagner and Anthony2002) (drinks/ day), nicotine (Wagner & Anthony, Reference Wagner and Anthony2002; Kuhn et al. Reference Kuhn, Schubert and Gallinat2010) (cigarettes smoked/day) and other illicit drug (Wagner & Anthony, Reference Wagner and Anthony2002) (number of times used during lifetime) use were considered as confounders (additional details in online Supplementary Information).
Potential confounding variables were compared between the groups using Fisher's exact test for categorical and unpaired t tests for other variables and those significantly (p < 0.05) different between the groups were included as confounders for group comparisons of neuroanatomical measures using the Permutation Analysis of Linear Models (PALM) tool (Winkler et al. Reference Winkler, Ridgway, Webster, Smith and Nichols2014). Hypothesis-specific confounders that we controlled for during the comparison of means of cortical thickness and surface area are listed here: Causal Hypothesis (use of alcoholic drinks, cigarette use, illicit drug use), Graded liability hypothesis (Zygosity, Ethnicity, Delay-discounting, use of alcoholic drinks, cigarette use, illicit drug use) and Predisposition hypothesis (Zygosity, Ethnicity, Delay-discounting, use of alcoholic drinks, cigarette use, illicit drug use). As average whole brain cortical thickness was also significantly (p < 0.05) different between the groups, the average whole brain cortical thickness variable was entered as an additional confounder while comparing cortical thickness between the groups. The following confounds were significantly (p < 0.05) associated with cortical thickness and surface area: Cortical thickness (Age, Zygosity, Ethnicity, Picture vocabulary, Delay-discounting, use of alcoholic drinks, cigarette use, illicit drug use, average cortical thickness); Surface area (Age, Zygosity, Ethnicity, Picture vocabulary, Delay-discounting, use of alcoholic drinks, cigarette use, illicit drug use, total cortical surface area). Hence, we have controlled for these confounds while computing the correlation between cannabis use variables and neuro-anatomical data.
Statistical analysis
Frequency of cannabis use and age of onset of cannabis use measures were compared between the disconcordant cannabis-exposed siblings and concordant cannabis-unexposed sibling groups using unpaired t tests. Permutation tests were performed to assess the mean difference in neuro-anatomical measures between the groups after controlling for the potential confounding variables under the General Linear Model (GLM) framework using the PALM tool (Winkler et al. Reference Winkler, Ridgway, Webster, Smith and Nichols2014) of FSL. During the permutation tests, two permutation blocks were defined according to the two groups of subjects and 20 000 random sign-flippings were used (Winkler et al. Reference Winkler, Ridgway, Webster, Smith and Nichols2014). Spearman's partial rank correlation between neuro-anatomical and cannabis use measures in the cannabis-exposed individuals (N = 214) were computed after controlling for potential confound variables. Cannabis use measures between the siblings of concordant cannabis-exposed sibling pairs were correlated using Spearman's rank correlation.
As a preliminary test of the Causal hypothesis that cannabis use was causally associated with aletrations in the thickness and surface area of entorhinal and parahippocampal cortices, we compared the Discordant Unexposed and Discordant Exposed groups. As these groups were not significantly different, we did not carry out a confirmatory test for the causal hypothesis by comparing monozygotic twin pairs discordant for cannabis use. In order to test the Graded liability hypothesis, we compared Discordant Unexposed and Discordant Exposed groups separately to the Concordant Exposed group. Finally, we compared the Concordant Unexposed group with all the other three groups to test the Predisposition hypothesis.
Estimation of heritability and shared additive genetic effects
Heritability estimation was carried out for those neuroanatomical measures that satisfied tests for either causal, predisoposition or liability hypotheses as being related to cannabis use and included average cortical thickness, total cortical surface area and frequency of cannabis use and cortical thickness/surface area of the specific brain region of all sibling pairs. Phenotypic correlation (ρ p) between the neuroanatomical measure and the frequency of cannabis use was estimated and decomposed into shared additive genetic (ρ g) and individual environmental (ρ e) factors using the bi-variate polygenic model (Blangero et al. Reference Blangero, Diego, Dyer, Almeida, Peralta and Kent2013). We assumed that siblings with identical biological parents lived within a common environment. We employed the SOLAR (Sequential Oligogenic Linkage Analysis Routine)-Eclipse software (http://solar-eclipse-genetics.org/) for heritability estimations and bi-variate polygenic model-based analyses. Gender, age, ethnicity, total household income, personality measures, picture vocabulary test performance score and delayed discounting performance scores were controlled for during heritability analyses. Average cortical thickness and total cortical surface area were additionally controlled for while estimating heritability of regional cortical thickness and surface area, respectively. Heritability of the frequency of cannabis use was estimated after controlling for the use of alcohol, nicotine and other illicit drugs.
Results
Characteristics of the participants
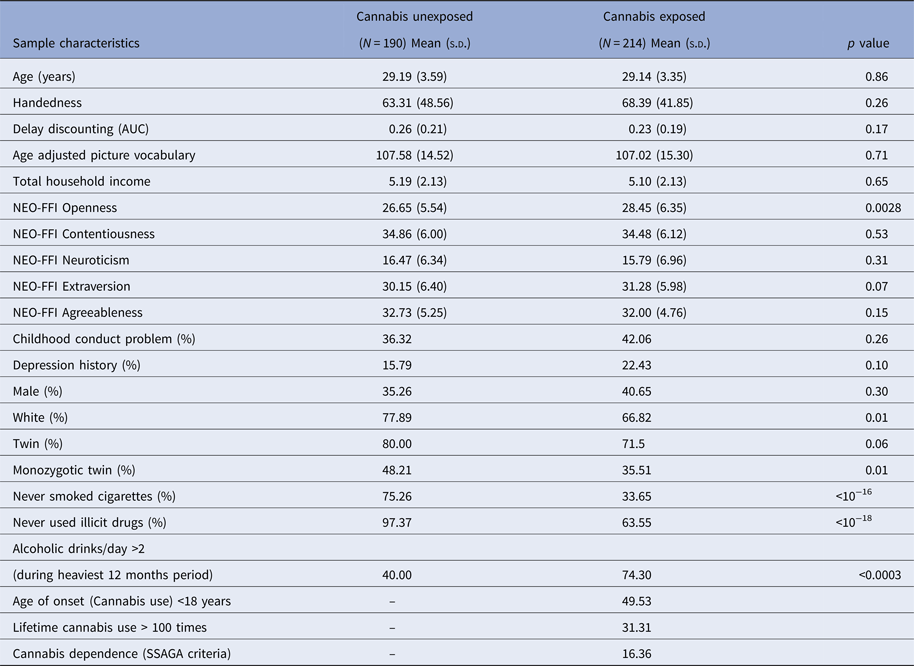
Cannabis exposed individuals were significantly more open to experiences (p = 0.0028) than unexposed individuals (as indexed using NEO-FFI Openness) (Table 1). There was a significant association between cannabis exposure and race, with non-white individuals having 1.75 times greater odds of being exposed to cannabis than those from the white race (p = 0.01). Cannabis exposed individuals had 16.94 times greater odds of alcohol exposure (p < 0.0003), 6 times greater odds of cigarette smoking (p < 10−16) and 21.22 times greater odds of exposure to other illicit drugs (p < 10−18) than those not exposed to cannabis. Among the cannabis users, 49.53% reported onset of cannabis exposure under the age of 18 and 16.36% satisfied SSAGA criteria of cannabis dependence. The 31.31% of cannabis-exposed individuals use cannabis more than 100 times during their lifetime (Table 1).
Characteristics of the 404 siblings.

AUC, area under curve; NEO-FFI, NEO five factor inventory; SSAGA, semi-structured assessment for the genetics of alcoholism
Group differences of the first 10 variables were tested using unpaired t tests. For subsequent nine variables, we have used Fisher's exact tests
Cannabis exposures in concordant and discordant siblings
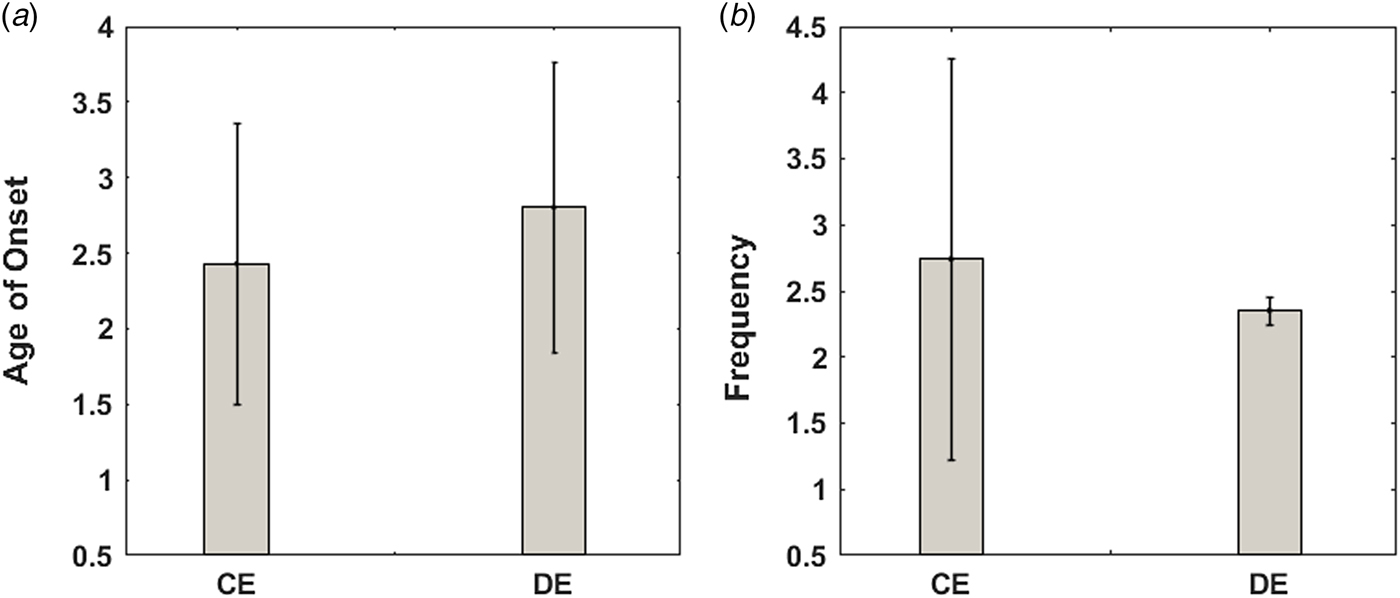
Cannabis use started significantly (p = 0.0067) earlier in sibling-pairs who were both exposed to cannabis that those who were not (Fig. 1a). However, there was no significant difference between the two groups in terms of mean cannabis use frequency (Fig. 1b). Age of first use of cannabis was significantly correlated (ρ = 0.49, p = 2.8 × 10⁻⁶) between the sibling pairs of the concordant exposed groups. Frequency of cannabis use was also significantly (ρ = 0.41, p = 1 × 10⁻⁴) correlated between these sibling pairs.
Mean (s.d.) ordinal values corresponding to the age of onset of cannabis use and the frequency of lifetime cannabis use of concordant exposed (CE) and Discordant Exposed (DE) groups have been displayed in (a) and (b), respectively.

Cortical thickness
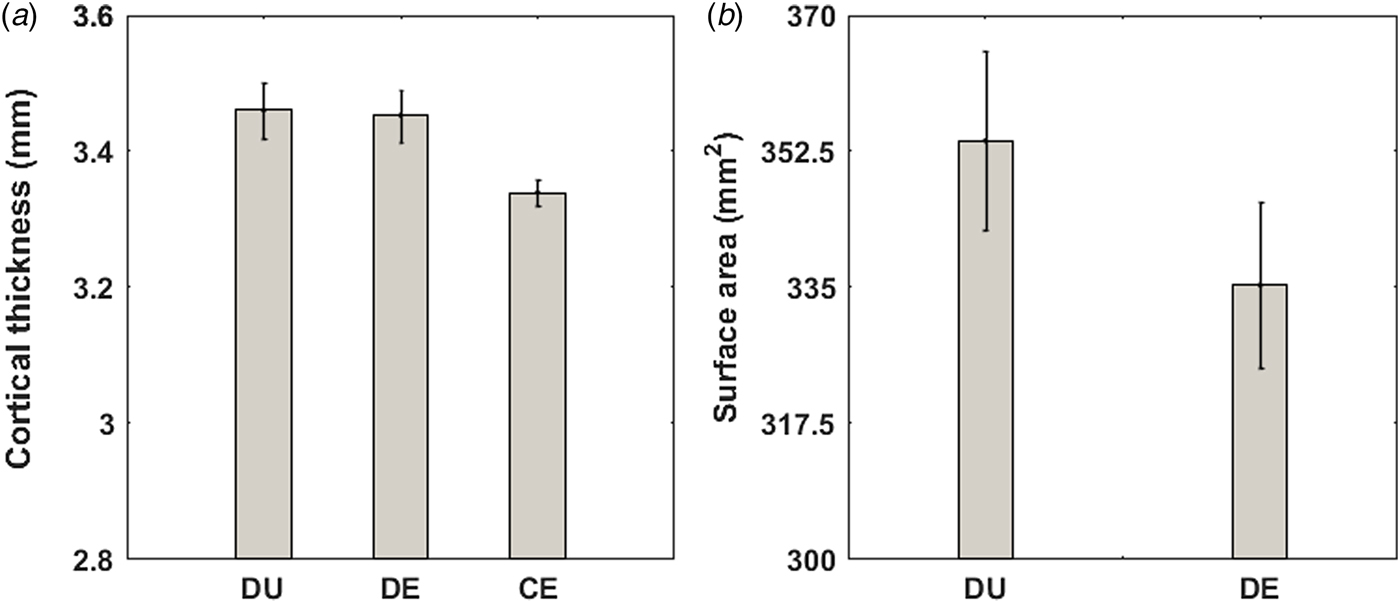
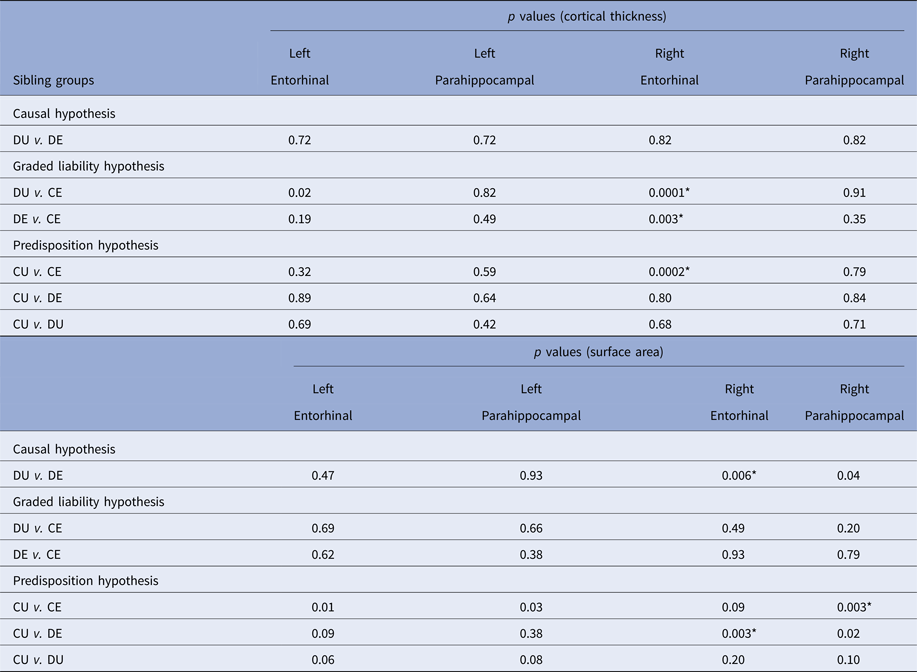
Cortical thickness of the right entorhinal cortex was significantly reduced [false discovery rate (FDR)-corrected, q < 0.05] (Fig. 2a, Table 2) in Concordant Exposed siblings compared to both Discordant Unexposed and Discordant Exposed groups supporting the graded liability hypothesis. When sibling-pairs belonging to the Discordant Exposed group were investigated, the right entorhinal cortex thickness of the siblings exposed to cannabis was not significantly different from their Discordant Unexposed siblings. However, when both siblings were exposed to cannabis, as in the case of those belonging to the Concordant Exposed group, their entorhinal cortex was thinner compared to siblings belonging to Discordant Exposed groups. Together, these results supported the graded liability hypothesis suggesting that shared genetic liability or rearing environment increase the liability for both reduced thickness of the right entorhinal cortex and cannabis use or that reduced thickness of the right entorhinal cortex may increase the liability to cannabis use in a graded manner, such that the risk was greater in sibling pairs concordantly exposed to cannabis use compared to when only one of the siblings from the sibling pairs was unexposed (discordant pairs).
Mean (s.e.) values of the cortical thickness of the right entorhinal cortex related to the graded liability hypothesis have been displayed in (a). Mean (s.e.) values of the surface area of the right entorhinal cortex related to the causal hypothesis have been displayed in (b). DU, DE and CE refer to the Discordant Unexposed, Discordant Exposed and Concordant Exposed sibling groups, respectively.

Results of PALM-based statistical comparisons of neuroanatomical measures between the sibling groups

DU, discordant unexposed; DE, discordant exposed; CE, concordant exposed; CU, concordant unexposed
*FDR (false discovery rate)-corrected, q < 0.05
However, there was no evidence in support of the causal and predisposition hypotheses. Age of first use of cannabis was significantly (ρ = 0.14, p = 0.022) correlated with the right entorhinal cortex thickness in the cannabis exposed participants. Such a relationship was not observed between cannabis use parameters and cortical thickness for any of the other brain regions considered (p > 0.05).
Surface area
Mean surface area of the right entorhinal cortex of the Discordant Exposed siblings was significantly (FDR-corrected, q < 0.05) smaller than their Discordant Unexposed siblings (Fig. 2b), supporting the causal hypothesis that reduced right entorhinal cortex surface area was an effect of cannabis use. However, there was no evidence in support of the graded liability and predisposition hypotheses. Frequency of cannabis use was significantly (ρ = −0.13, p = 0.020) correlated with surface of the right entorhinal cortex in the cannabis exposed participants. Correlation between cannabis use parameters and cortical surface area of other brain regions tested were not significant (p > 0.05).
Heritability analysis and genetic and environmental contributions to phenotypic measures
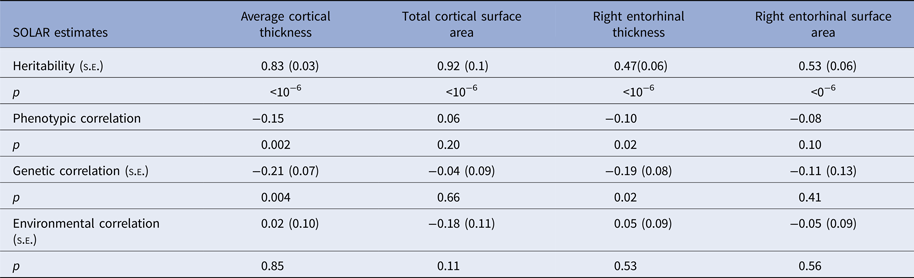
Total cortical surface area, average cortical thickness, right entorhinal cortex thickness and surface area were significantly heritable (p < 10−6; Table 3). Frequency of cannabis use was also significantly heritable (0.45 ± 0.08, p < 10−6). There was significant phenotypic (ρ p = −0.10; p = 0.02) correlation between right entorhinal cortex thickness and frequency of cannabis use, which was a result of significant shared additive genetic (ρ g = −0.19 ± 0.08; p = 0.02) but not unique environmental (ρ e = 0.05 ± 0.09; p = 0.53) correlation. Phenotypic, genetic and individual environmental correlations between surface area of the right entorhinal cortex and frequency of cannabis use were not significant (p > 0.05). Common rearing environment did not contribute significantly (p > 0.05) to these measures.
Results of SOLAR analysis

Discussion
In the present study, we investigated the nature of the relationship between cannabis use and cortical thickness and surface area of the entorhinal and parahippocampal cortices using the largest sibling-pair sample investigated to date. As predicted, we found that reduced thickness and surface of the right entorhinal cortex were associated with cannabis use in this sample, which persisted even after correcting for a number of potential confounders. Such an association was not found in the entorhinal cortex on the left side or in the parahippocampal cortex bilaterally. Furthermore, contrary to our expectations, we found that the association between reduced right entorhinal cortex thickness and cannabis use reflected the effect of a shared factor (e.g. genetic or environmental) that is likely to have increased the liability to both cannabis use and reduced cortical thickness in a graded manner, such that the risk was greater in sibling pairs concordantly exposed to cannabis use compared to when one of the siblings from the sibling pairs was unexposed (discordant pairs). Whilst this may suggest that this liability factor may have resulted in reduced thickness of the right entorhinal cortex, which in turn may have increased the risk of cannabis use, it is also possible that this liability factor may have increased the risk of both cannabis use and of thinner entorhinal cortex. Additional analyses suggested that this association was likely a result of shared genetic liability as opposed to shared or unique environmental influence, the latter providing further support against a causal effect of cannabis use on right entorhinal cortical thickness.
These results are consistent with previous evidence of association between entorhinal cortex thickness and cannabis use (Jacobus et al. Reference Jacobus, Squeglia, Sorg, Nguyen-Louie and Tapert2014; French et al. Reference French, Gray, Leonard, Perron, Pike and Richer2015; Jacobus et al. Reference Jacobus, Squeglia, Meruelo, Castro, Brumback and Giedd2015) but extend it by suggesting that shared genetic liability may underlie the association between cannabis exposure and thinner right entorhinal cortex. However, whether genetic liability results in thinner right entorhinal cortex which in turn increases the risk of cannabis use behaviour remains to be tested. How thinner entorhinal cortex may increase the liability of cannabis use is unclear and may reflect the role of stress/ emotional dysregulation in drug use behaviour (Koob & Volkow, Reference Koob and Volkow2016; Volkow et al. Reference Volkow, Hampson and Baler2017), given its connectivity with regions implicated in emotional processing and reward-related learning (Oades & Halliday, Reference Oades and Halliday1987; Sugase-Miyamoto & Richmond, Reference Sugase-Miyamoto and Richmond2007; Schultz et al. Reference Schultz, Sommer and Peters2015; Tomas Pereira et al. Reference Tomas Pereira, Agster and Burwell2016). Furthermore, evidence from preclinical research suggests that the entorhinal cortex is critical for learning the motivational significance of stimuli (Liu et al. Reference Liu, Murray and Richmond2000), as well as for using memory of previous rewards to estimate the value of future rewards (Clark et al. Reference Clark, Bouret, Young and Richmond2012) and reciprocal connections of the entorhinal cortex with the orbital prefrontal cortex play a critical role in evaluating and estimating the expected value of rewards suggesting a role in modulating behaviour in response to expected reward value (Clark et al. Reference Clark, Bouret, Young, Murray and Richmond2013). Therefore, one may speculate that thinner entorhinal cortex may increase the liability of cannabis use in man by interfering with its critical role in helping modulate of behaviour in light of expected reward value through impairment in the estimation and learning of the motivational significance of drugs and evaluation of drug use in light of past adverse experience. However, the present data does not allow us to test these hypotheses. It is also worth noting in this context that, orbitofrontal cortex sulcogyral pattern, a structural variation that is established early on in life and thought to remain relatively stable thereafter, has been linked to a predisposition for greater levels of cannabis use over lifetime, in the absence of a contribution to the risk of becoming a cannabis user (Chye et al. Reference Chye, Solowij, Ganella, Suo, Yucel and Batalla2017).
These results are to be considered in light of certain limitations of the present sample as well as the study design. Firstly, accurate characterisation of temporal sequence of exposure and cause/ effect through multi-point brain imaging and exposure data collection within prospective longitudinal designs are necessary to definitively disentangle cause and effect relationships. This was not possible with the present data and need to be carried out in future studies. Limited by the very nature of the present cohort, information on cannabis use was not as detailed as would have been necessary to systematically examine dose-response relationships, also important for evaluating the nature of such associations. In particular, we were not able to differentiate between cannabis users who quit from those who continued to use. Future studies need to examine these groups separately to investigate whether the neural correlates of liability to use cannabis may differ between those who continue to use compared to those who stop. It is also worth noting that we focused on specific brain regions of interest, namely the entorhinal and parahippocampal cortices rather than employ a whole brain analysis approach or consider other brain regions high in cannabinoid receptors. Instead, we employed a hypothesis-driven approach, focusing on brain areas that subserve a cognitive function (i.e. memory) for which there is robust evidence of impairment associated with cannabis use both in experimental and observational studies. This was done to ensure that sample size of the groups tested based on their sibship information, cannabis use and gender leant them adequate power to detect significant differences with confidence, which would not have been feasible had we investigated multiple other brain regions. Finally, the present study was also limited by the number of twin pairs with and without exposure of interest and in particular the number of discordant monozygotic twin pairs for whom data was available.
Nevertheless, these results suggest that thinner right entorhinal cortex may be associated with genetically mediated liability to cannabis use behaviour and underscore the importance of longitudinal studies to confirm the nature of this association as well as investigate potential cognitive mechanisms that may underlie it. Independent replication of these results as well as characterisation of the cognitive mechanisms that may underlie the association between entorhinal thinning and cannabis use behaviour is necessary for a clear understanding of the precise clinical significance of these results.
Supplementary material
The supplementary material for this article can be found at https://doi.org/10.1017/S0033291718000417
ACKNOWLEDGEMENT
Data were provided by the Human Connectome Project, WU-Minn Consortium (Principal Investigators: David Van Essen and Kamil Ugurbil; 1U54MH091657) funded by the 16 NIH Institutes and Centers that support the NIH Blueprint for Neuroscience Research; and by the McDonnell Center for Systems Neuroscience at Washington University.
Financial support
SB has been funded by the National Institute for Health Research (NIHR), UK through a Clinician Scientist award (NIHR-CS-11-001). SP is supported by Newton International Fellowship from Newton Fund. The views expressed are those of the authors and not necessarily those of the NHS, the NIHR or the Department of Health. The funders had no role in the design and conduct of the study; collection, management, analysis and interpretation of the data; preparation, review or approval of the manuscript; and decision to submit the manuscript for publication. All authors have approved the final version of the paper.
Conflict of interest
None.
Ethical standard
The authors assert that all procedures contributing to this work comply with the ethical standards of the relevant national and institutional committees on human experimentation and with the Helsinki Declaration of 1975, as revised in 2008.