

INTRODUCTION
Rodent astrocytes in primary cultures express among other 5-HT receptors 5-HT2 receptors (Hansson et al., Reference Hansson, Simonsson and Alling1987; Nilsson et al., Reference Nilsson, Hansson and Ronnback1991; Deecher et al., Reference Deecher, Wilcox, Dave, Rossman and Kimelberg1993; Chen et al., Reference Chen, Peng, Zhang, Stolzenburg and Hertz1995; Poblete and Azmitia, Reference Poblete and Azmitia1995), including the most recently discovered 5-HT2 receptor, the 5-HT2B receptor (Sanden et al., Reference Sanden, Thorlin, Blomstrand, Persson and Hansson2000; Kong et al., Reference Kong, Peng, Chen, Yu and Hertz2002). This phospholipase C-linked receptor is the major 5-HT2 receptor in well-differentiated mouse astrocyte cultures, although they also express 5-HT2C receptors (Kong et al., Reference Kong, Peng, Chen, Yu and Hertz2002; Li et al., Reference Li, Zhang, Zhang, Nu, Cai and Hertz2008, Reference Li, Zhang, Li, Hertz and Peng2010). However, up to now 5-HT2B receptors have not been demonstrated on astrocytes obtained directly from the brain. One aim of the present study therefore was to investigate mRNA expression of 5-HT2B receptors on an astrocytic cell fraction freshly isolated from brain cortex of transgenic mice co-expressing glial fibrillary acidic protein (GFAP) and a fluorophore and isolated by fluorescence-activated cell sorting (FACS), as described by Lovatt et al. (Reference Lovatt, Sonnewald, Waagepetersen, Schousboe, He and Lin2007) and Hertz et al. (Reference Hertz, Lovatt, Goldman and Nedergaard2010).
A second aim of the study was to study 5-HT2B receptor-mediated effects of all five ‘serotonin-specific reuptake inhibitors’ (SSRIs). We have recently found fluoxetine to be a subtype-specific agonist at the 5-HT2B receptor in cultured astrocytes (Li et al., Reference Li, Zhang, Zhang, Nu, Cai and Hertz2008). Acute administration of fluoxetine to primary cultures of well-differentiated mouse astrocytes led within 20 min to phosphorylation (activation) of extracellular regulated kinases 1 and 2 (ERK1/2) and slightly later to upregulation of the early genes cfos and fosB (Li et al., Reference Li, Zhang, Zhang, Nu, Cai and Hertz2008). These effects are mediated via 5-HT2B receptor-induced autocrine transactivation of the epidermal growth factor (EGF) receptor by a receptor-tyrosine kinase-dependent effect of an EGF receptor agonist released from its membrane-bound precursor by a metalloproteinase (Peng et al., Reference Peng, Li, Du, Kong, Hu and Zhang2010). The EC50 of this effect is ~5 µM, which is consistent with a fluoxetine-mediated increase in free cytosolic Ca2+ concentration ([Ca2+]i) (Chen et al., Reference Chen, Peng, Zhang, Stolzenburg and Hertz1995) and with its binding affinity for the human 5-HT2B receptor reported by Rothman et al. (Reference Rothman, Baumann, Savage, Rauser, McBride and Hufeisen2000). However, this effect is not potent enough that therapeutic concentrations of fluoxetine (see below) can be expected to interact acutely with 5-HT2B receptors.
This situation changes when fluoxetine is administered chronically, consistent with an upregulation of binding of mesulergine, a general 5-HT2 antagonist, after chronic treatment with fluoxetine (Kong et al., Reference Kong, Peng, Chen, Yu and Hertz2002) and more specifically with upregulation of 5-HT2B receptor expression (B. Li and L. Peng, unpublished results). Chronic effects of fluoxetine include an increase of mRNA and protein expression of Ca2+-dependent phospholipase A2 (cPLA2), which is contingent upon 5-HT2B-mediated phosphorylation of ERK1/2 (Li et al., Reference Li, Zhang, Li, Hertz and Peng2009). After chronic treatment with 10 µM fluoxetine the upregulation is apparent after 3 days, but it does not reach its maximum (approximately a doubling) until after 2 weeks; a similar, although slightly smaller effect of 1 µM fluoxetine does not appear until after 2–3 weeks (Li et al., Reference Li, Zhang, Li, Hertz and Peng2009), indicating an inverse correlation between the concentration of fluoxetine and the latency of the effect. Importantly, it also indicates a ten-fold decrease in EC50 for fluoxetine (increased potency), which after 3 weeks of treatment becomes 0.5 ± 0.2 µM (Li et al., Reference Li, Zhang, Li, Hertz and Peng2009). This concentration is lower than the combined plasma concentration of fluoxetine and its active metabolite, norfluoxetine (1–2 µM) in patients treated with fluoxetine (Bolo et al., Reference Bolo, Hode, Nedelec, Laine, Wagner and Macher2000; Henry et al., Reference Henry, Schmidt, Hennen, Villafuerte, Butman and Tran2005; Wille et al., Reference Wille, Cooreman, Neels and Lambert2008). However, both drugs are heavily protein-bound, and in cerebrospinal fluid (and thus probably also brain extracellular fluid; Liu et al., Reference Liu, Van Natta, Yeo, Vilenski, Weller and Worboys2009) the concentrations are >10 times lower (Martensson et al., Reference Martensson, Nyberg, Toresson, Brodin and Bertilsson1989), reflecting that 90–95% of fluoxetine in plasma is protein-bound (Jusko and Gretch, Reference Jusko and Gretch1976; van Harten, Reference van Harten1993). Nevertheless, assuming ordinary mass action kinetics, a concentration of unbound fluoxetine plus norfluoxetine of 0.15–0.40 µM would have a significant effect on cPLA2a expression during chronic, but not during acute administration.
If the agonist effect of fluoxetine on 5-HT2B receptors plays a role in the therapeutic effect of fluoxetine as an antidepressant, the four other conventional SSRIs, paroxetine, sertraline, fluvoxamine and citalopram should also at therapeutically relevant concentrations interact chronically with astrocytic 5-HT2B receptors in a similar manner as fluoxetine and exert similar effects on cPLA2a expression as fluoxetine. Several pharmacological differences are known between fluoxetine and paroxetine: fluoxetine has a non-negligible affinity for another subtype of the 5-HT2 receptor, the 5-HT2C receptor, which paroxetine does not share (Wong and Bymaster, Reference Wong and Bymaster1995). On the other hand, paroxetine has a >10-fold higher affinity than fluoxetine for binding to the serotonin transporter (SERT) (Tatsumi et al., Reference Tatsumi, Groshan, Blakely and Richelson1997) and a 20–40-fold higher potency for inhibition of serotonin uptake into synaptosomes (Hyttel, Reference Hyttel1994; Bolden-Watson and Richelson, Reference Bolden-Watson and Richelson1993; Wong and Bymaster, Reference Wong and Bymaster1995). Nevertheless, the difference in therapeutic concentrations between paroxetine and fluoxetine is modest and plasma protein binding is the same (Hyttel, Reference Hyttel1994; Frazer, Reference Frazer2001). Paroxetine as well as each of the other conventional SSRIs have therapeutic plasma concentrations that are only slightly smaller (generally 0.1–0.5 µM) than that of fluoxetine (Bjerkenstedt et al., Reference Bjerkenstedt, Flyckt, Overo and Lingjaerde1985; DeVane et al., Reference DeVane, Liston and Markowitz2002; Birkenhager et al., Reference Birkenhager, van den Broek, Mulder, Bruijn and Moleman2004; Sawamura et al., Reference Sawamura, Suzuki and Someya2004; Weissman et al., Reference Weissman, Levy, Hartz, Bentler, Donohue and Ellingrod2004; Freeman et al., Reference Freeman, Nolan, Davis, Anthony, Fried and Fankhauser2008; Sit et al., Reference Sit, Perel, Helsel and Wisner2008; Wille et al., Reference Wille, Cooreman, Neels and Lambert2008). The least protein-bound among the four conventional SSRIs are fluvoxamine and especially citalopram, which is only 50–80% protein-bound (Jusko and Gretch, Reference Jusko and Gretch1976; van Harten, Reference van Harten1993).
OBJECTIVES
The objectives of the present communication are:
(i) to investigate whether astrocytes freshly isolated from the mouse brain by FACS express 5-HT2B receptor mRNA;
(ii) to qualitatively and quantitatively compare acute and chronic effects of fluoxetine and paroxetine, chosen because these are the two SSRIs that differ most in their affinity for SERT and for 5-HT2C receptors; and
(iii) to show that each of the three remaining SSRIs, sertraline, fluvoxamine and citalopram during chronic treatment with the therapeutically relevant concentration of 1 µM (or lower) leads to a similar upregulation of mRNA and protein expression of cPLA2a as fluoxetine and paroxetine.
METHODS
Materials
Most chemicals, including paroxetine, sertraline, fluvoxamine and citalopram and SB 204741 (N-(1-methyl-5-indolyl)-N′-(3-methyl-5-isothiazolyl) urea), DNase I and propidium iodide (PI) as well as the first antibody raised against β-actin (42 kDa) were purchased from Sigma (St. Louis, MO, USA). Tyrphostin AG1478 (4-(3-chloroanilino)-6,7-dimethoxyquinazoline), GM6001 (N-[(2R)-2-(hydroxamidocarbonylmethyl)-4-methylpentanoyl]-l-tryptophan methylamide) and U0126 (1,4-diamino-2,3-dicyano-1,4-bis[2-aminophenylthio]butadiene) were obtained from Calbiochem, La Jolla, CA, USA. Santa Cruz Biotechnology (Santa Cruz, CA, USA) provided the first antibody raised against cPLA2 (recognizing cPLA2a [85 kDa], cPLA2b [114 kDa] and cPLA2c [61 kDa]), as well as the first antibody raised against ERK (K-23):sc-94, and against phosphorylated ERK (E-4):sc-738, and the secondary antibody goat anti-mouse IgG horseradish peroxidase (HRP) conjugate. The secondary antibody goat anti-rabbit IgG HRP conjugate was from Promega (Madison, WI, USA), and ECL Western blotting detection reagents from Amersham Biosciences, Buckinghamshire, UK. Hanks buffer, minimum essential medium (MEM) and bovine serum albumin (BSA) were purchased from Invitrogen (Carlsbad, CA, USA), DNQX and APV from Tocris (Ellisville, MO, USA), papain from Worthington (Lakewood, NJ, USA) and Percoll from GE Healthcare (Piscataway, NJ, USA).
Preparation of freshly isolated cells
DISSOCIATION OF CORTEX
Brain tissue was from 10–12-week-old FVB/NTg(GFAP GFP)14Mes/J or B6.Cg-Tg(Thy1-YFPH)2Jrs/J mice (The Jackson Laboratory, Bar Harbor, ME). These transgenic mice express a fluorescence signal driven by a cell-specific promotor, allowing fluorescence-activated sorting of the specified cell fractions, although it should be emphasized that Thy1 is mainly a marker of large projection neurons rather than a general neuronal marker (Feng et al., Reference Feng, Mellor, Bernstein, Keller-Peck, Nguyen and Wallace2000; Seki et al., Reference Seki, Nawa, Morioka, Fukuchi, Oite and Abe2002). The mice were anesthetized with pentobarbital (50 mg kg−1, i.p.), perfused with cold Hanks buffer and decapitated. The brain was immediately removed to cold Hanks buffer containing glutamate receptor antagonists, 3 µM DNQX and 100 µM APV. The frontal, parietal and occipital cortex was dissected free of white matter, cut into small pieces and digested with 8 U/ml papain in Ca2+/Mg2+-free PIPES/cysteine buffer, pH 7.4, for 1 h at 37°C/5% CO2. After one wash, the tissue was further digested with 40 U/ml DNase I in Mg2+-containing MEM with 1% BSA for 15 min at 37°C/5% CO2. The tissue was then carefully triturated in cold MEM with 1% BSA, centrifuged over a 90% Percoll gradient to collect all cells below and including the lipid layer, which then was further diluted five times (MEM with 1% BSA) and centrifuged to collect the pellet, which normally included five million viable cells per brain used. The cells were then re-suspended in cold MEM with 1% BSA and 4 µg ml−1 PI and immediately sorted by FACS.
FACS
Cells were sorted using either the BD FACSVantage Cell Sorting System (13 psi sheath pressure, Cell Quest software) or the BD FACSAria Cell Sorting System (35 psi sheath pressure, FACSDiva software; BD Biosciences, San José, CA). GFP and YFP were excited by a 488 nm laser, and emissions were collected by a 530/30 nm discrimination filter. The signals were manually compensated, and cells were sorted into cold MEM with 1% BSA.
RNA PROCESSING AND MICROARRAY
After FACS, cells were immediately extracted for total RNA and DNase treatment using the RNAqueous Micro kit (Ambion, Austin, TX). RNA quantity was assessed using the NanoDrop-1000 (NanoDrop Technologies, Wilmington, DE), and RNA integrity was assessed using the 2100-Bioanalyzer (Agilent Technologies). For microarray, 20 ng of total RNA was amplified and labeled with biotin using the Ovation kit (NuGEN, San Carlos, CA) according to the manufacturer's instruction and hybridized to the Affymetrix (Santa Clara, CA) GeneChip Mouse Genome 430 2.0 Array.
MICROARRAY DATA MINING AND STATISTICAL ANALYSIS
Microarray data were analyzed using the Arrayassist 5.0.0 software package (Stratagene, La Jolla, CA). We normalized the data using the MAS5 algorithm, followed by log2 transformation and filtering out any probe set that had only one present call across all samples or a maximum intensity value <100 across all samples, which reduced the initial data set of 45,101 probe sets to 19,369 probe sets. To assure reproducibility among independent biological replicates in the genomic data set, we compared the correlation coefficient within groups of sorted cells (19,369 probe sets). The degree of similarity across all samples was assessed by hierarchical clustering using Euclidean average distances. All statistical comparisons between groups were performed by the non-paired parametric Student's t-test using the Benjamini–Hochberg false discovery rate correction algorithm of 5%.
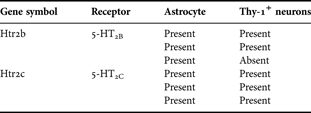
Results for both astrocytes and Thy1-positive neurons were obtained in three biological replicates, i.e. in cells isolated from three different animals. If all three were positive for the gene in question the result is indicated in Table 1 as present, present, present and if two of the three were positive by two times present and one time absent. Three positive calls were interpreted as unequivocal presence and two positive calls as tentative presence.
mRNA expression of 5-HT2B and 5-HT2C receptor subtypes in FACS-isolated cell fractions from three separate dissociates obtained from the adult murine brain, determined by microarray analysis of 20 ng of total RNA

The table indicates present calls and absent calls. Three present calls normally indicate that a gene is unequivocally present, whereas two present calls and one absent call indicates tentative presence.
Primary cultures of astrocytes
CULTURES
Primary cultures of astrocytes were prepared from the neopallia of mouse cerebral hemispheres by vortexing and filtering through nylon meshes with pore sizes of 80 and subsequently 10 µm as previously described (Hertz et al., Reference Hertz, Schousboe, Boechler, Mukerji and Fedoroff1978; Hertz et al., Reference Hertz, Peng and Lai1998) with minor modifications (Li et al., Reference Li, Zhang, Li, Hertz and Peng2009). The culturing medium was a Dulbecco's medium with 7.5 mM glucose, initially containing 20% horse serum, and the cultures were incubated at 37°C in a humidified atmosphere of CO2/air (5:95%). The medium was exchanged with fresh medium of similar composition on day 3, and subsequently, every 3–4 days. From day 3, the serum concentration was reduced to 10%, and after the age of 2 weeks, 0.25 mM dibutyryl cyclic AMP was included in the medium, a routine procedure, which leads to a morphological and functional differentiation (Hertz et al., Reference Hertz, Bender, Woodbury and White1989; Meier et al., Reference Meier, Hertz and Schousboe1991). For acute experiments the cells were incubated at 37°C in tissue culture medium without protein for 20 min, a length of time previously found optimal for phosphorylation of ERK1/2 (Li et al., Reference Li, Zhang, Zhang, Nu, Cai and Hertz2008). For chronic experiments an SSRI was added to normal culture medium with 10% serum after 2 weeks of culturing (i.e. at the time the cultures had reached confluency) and it was present during continued culturing for another 1, 2, 3 or 4 weeks.
ERK1/2 PHOSPHORYLATION AND PROTEIN EXPRESSION OF CPLA2a
After the 20 min incubation under drug-free control conditions or in the presence of different concentrations of paroxetine with or without specific inhibitors the reaction was stopped by washing with ice-cold phosphate-buffered saline containing 7.5 mM glucose, and the cells were scraped off the dishes and harvested in 0.5 ml of ice-cold buffer A (0.25 M sucrose, 10 mM HEPES, the phosphatase inhibitors alpha-mercaptoethanol [10 mM] and phenylmethyl sulfonyl fluoride (1 mM) and 1 mM sodium orthovanadate, pH 7.4) and homogenized to make a whole cell lysate. The protein content was determined in the homogenates by the Bradford method (Bradford, Reference Bradford1976), using BSA as the standard. Samples containing 50 µg protein were applied on slab gels of 10% polyacrylamide. After transfer to nitrocellulose membranes, the samples were blocked by 5% skimmed milk powder in TBS-T (30 mM Tris–HCl, 125 mM NaCl, 0.1% Tween 20) for 2 h and transferred to nitrocellulose membranes. The nitrocellulose membranes were incubated with the first antibody, specific to either p-ERK or ERK at 1 × 1000 dilution or β-actin at 1 × 4000 dilution for 1.5 h at room temperature. After washing, specific binding was detected by goat-anti-mouse (p-ERK) or goat-anti-rabbit (ERK) horseradish peroxidase-conjugated secondary antibody at 1 × 1000 dilution. Staining was visualized by ECL detection reagents (Amersham Biosciences, Buckinghamshire, UK), followed by exposure to film (Fuji Photo Film, Tokyo, Japan), and the results were collected by Fluorchem imaging system. Band density was measured with Window AlphaEaseTM FC 32-bit software. Ratios between cPLA2a protein and β-actin were determined and averaged.
Protein expression of cPLA2a was determined in a similar manner, with minor modifications. Blocking by 5% skimmed milk powder in TBS-T was for 1 h, after which the nitrocellulose membranes were incubated with the first antibody, specific to either cPLA2a at 1 × 1000 dilution or β-actin (used for housekeeping) at 1 × 4000 dilution for 2 h at room temperature. After washing, specific binding was detected by goat-anti-mouse horseradish peroxidase-conjugated secondary antibody at 1 × 1000 dilution, followed by staining, exposure to film, visualization by Fluorchem imaging system, measurement of band density, determination of ratios between cPLA2a protein and β-actin and averaging.
mRNA EXPRESSION
For determination of mRNA expression of cPLA2a by reverse transcription polymerase chain reaction (RT-PCR) a cell suspension was prepared by discarding the culturing medium, adding trizol to cultures on ice, and scraping the cells off the culture dish. The RNA pellet was precipitated with isopropyl alcohol, washed with 70% ethyl alcohol and dissolved in 10 µl sterile, distilled water, and an aliquot was used for determination of the amount of RNA (Kong et al., Reference Kong, Peng, Chen, Yu and Hertz2002). One microgram of RNA extract was used for RT, which was initiated by a 5-min incubation at 65°C of RNA extract with Random Hexamer at a final concentration of 12.5 ng/μl and deoxyribonucleotide triphosphates (dNTPs; TaKaRa Biotechnology, Dalian, China) at a final concentration of 0.5 mM. The mixture was rapidly chilled on ice and briefly spun, and 4 µl 5× First-Strand Buffer, 2 µl 0.1 M dithiotreitol and 1 µl RNaseOUT Recombinant RNase Inhibitor (40 U/μl) were added. After the mixture had been incubated at 42°C for 2 min, 1 µl (200 U) of Superscript II (Gibco) was added, and the incubation at 42°C continued for another 50 min. Subsequently, the reaction was inactivated by heating to 70°C for 15 min, and the mixture was chilled and briefly centrifuged.
PCR amplification was performed in a Robocycler thermocycler with 0.2 µM of sense or antisense and 0.375 U of Taq-polymerase (TaKaRa Biotechnology, Dalian, China) for cPLA2a (forward, GCACATTATAGTGGAACACC; reverse, ACACAGTGCCATGCTGAACC) (Ivanov et al., Reference Ivanov, Pero, Scheck and Romanovsky2002) and TATA box-binding protein (TBP), used as a housekeeping gene (CCACGGACAACTGCGTTGAT; reverse, CGCTCATAGCTACTGAACTG) (El Marjou et al., Reference El Marjou, Montalescot, Buzyn and Geny2000). The amount of cDNA used was 5 µg. Forty cycles were used for both cPLA2a and TBP. Initially, the template was denatured by heating to 94°C for 2 min, followed by 2-min amplification cycles, each consisting of two 45-s periods and one 60-s period, the first at 94°C, the second at 59°C for cPLA2a and 55°C for TBP and the third at 72°C. The final step was extension at 72°C for 10 min. The PCR products were separated by 1% agarose gel electrophoresis, and captured by Fluorchem 5500 (Alpha Innotech, San Leandro, CA, USA). Ratios between cPLA2a mRNA and TBP were determined and averaged.
STATISTICS
The differences between multiple groups were evaluated by one-way analysis of variance followed by Fisher's least significant difference multiple comparison test for unequal replications. The level of significance was set at P < 0.05.
RESULTS
Expression of 5-HT2B and 5-HT2C receptors in freshly isolated cells
mRNAs of the two 5-HT2 receptor subtypes, which were expressed in the presently used cultures of astrocytes, the 5-HT2B and the 5-HT2C receptor, were similarly unequivocally present in freshly dissociated murine astrocytes obtained by gentle tissue dissociation followed by FACS (Table 1). The 5-HT2C receptor was also unequivocally present in Thy1-positive neurons, whereas the 5-HT2B receptor, the receptor at which fluoxetine is an agonist, was only tentatively present in the neurons.
ERK1/2 phosphorylation in cultured astrocytes
Figure 1, A1 shows phosphorylation of ERK1 and ERK2 in cultured astrocytes as a function of the concentration of paroxetine between 5 and 100 µM after incubation in tissue culture medium for 20 min. All concentrations increase phosphorylation of both ERK1 and ERK2. The results were scanned and expressed as ratios between p-ERK1 and ERK1 densities (Fig. 1, A2) and between p-ERK2 and ERK2 densities (Fig. 1, A3), and the averages of three experiments suggest that a maximum effect has been approached at 100 µM and that half-maximum effect occurs slightly above 5 µM. This is virtually identical to the concentration dependence of ERK1/2 phosphorylation by fluoxetine (Li et al., Reference Li, Zhang, Zhang, Nu, Cai and Hertz2008). A similar concentration dependence was also found for citalopram, where 5 µM was not tested, but 10 µM showed the same increase as 10 µM paroxetine (Fig. 1, B1–3). As in the case of fluoxetine, the effect of paroxetine is completely blocked by the 5-HT2B antagonist SB 204741, the EGF receptor-tyrosine kinase inhibitor AG1478 and the metalloproteinase inhibitor GM6001 (Fig. 1, C1–3), indicating the dependence on 5-HT2B receptor activation and metalloproteinase-mediated shedding of an EGF receptor agonist, i.e. transactivation.
Paroxetine and citalopram induced ERK phosphorylation in primary cultures of mouse astrocytes. (A and B) Concentration–response curves. Cells were incubated for 20 min in serum-free medium in the absence of any drug (control) or in the presence of 5, 10, 40, 60 or 100 µM paroxetine (A), or in the presence of 0.1, 0.5, 1 or 10 µM citalopram (B). (A1 and B1) Immunoblot from representative experiments. Similar results were obtained from three independent experiments. Average ERK phosphorylation was quantitated as ratios between p-ERK1 and ERK1 (A2 and B2) and between p-ERK2 and ERK2 (A3 and B3). SEM values are indicated by vertical bars. *Indicates statistically significant (P < 0.05) difference from control group (A) or from other groups (B) for ERK1 and ERK2. (C) Paroxetine induced ERK1/2 phosphorylation in astrocytes requires 5-HT2B receptor activity, EGF receptor stimulation and activation of Zn2+-dependent metalloproteinase. After pretreatment for 15 min in serum-free medium with or without 200 nM SB 204741, an antagonist of 5-HT2B receptors, 1 µM AG1478, an inhibitor of the EGF receptor or 10 µM GM6001, an inhibitor of Zn2+-dependent metalloproteinases, cells were incubated for 20 min in the absence of any drug (control) or in the presence of 10 µM paroxetine, of 200 nM SB 204741, of 1 µM AG1478, of 10 µM GM6001, of paroxetine plus SB 204741, of paroxetine plus AG1478, or paroxetine plus GM6001. (C1) Immunoblot from a representative experiment. Similar results were obtained from three independent experiments. Average ERK phosphorylation was quantitated as ratios between p-ERK1 and ERK1 (C2) and between p-ERK2 and ERK2 (C3). SEM values are indicated by vertical bars. *Indicates statistically significant (P < 0.05) difference from other groups.

cPLA2a expression in cultured astrocytes
PAROXETINE
mRNA (Fig. 2, A1–2) and protein (Fig. 2, A3–4) expression of cPLA2a in cultured astrocytes was determined after treatment with 10 µM paroxetine for 1–4 weeks. Representative plots of cPLA2a and the respective housekeeping molecules TBP and β-actin are shown in Fig. 2, A1 and A3. It can be seen that the ratios cPLA2a/TBP (Fig. 2, A2) and cPLA2a/β-actin (Fig. 2, A4) show similar degrees of increase in mRNA and in protein expression of cPLA2a after 1–4 weeks. The maximum response to 10 µM already after 1 week represents a difference from fluoxetine (Li et al., Reference Li, Zhang, Zhang, Nu, Cai and Hertz2008), suggesting that during chronic treatment the affinity for paroxetine is likely to be at least as high as that for fluoxetine. Consistent with this 1 µM paroxetine had quantitatively similar effect on mRNA (Fig. 2, B1–2) and protein (Fig. 2, B3–4) expression of cPLA2a as 10 µM paroxetine, although the effect occurred 1 week later. Actually, the effective concentrations are even lower, since protein binding also occurs during chronic experiments in cultured cells, where at 10 µM fluoxetine only 6.4 ± 0.2 µM is unbound, with the rest bound to proteins in the added serum (S. Zhang and B. Li, unpublished experiments).
Gene expression of cPLA2a in primary cultures of mouse astrocytes chronically treated with paroxetine. Cells were treated with 10 µM (A) or 1 µM (B) paroxetine for 1 to 4 weeks. (A1–2 and B1–2) mRNA expression measured by RT-PCR of cPLA2a. (A1 and B1) a representative experiment showing mRNAs for cPLA2a in the upper rows and for TBP, as a house-keeping gene, in the lower rows, in control cultures and the corresponding results in paroxetine-treated cultures. The size of PCR product of cPLA2a is 430 bp and of TBP 236 bp. (A2 and B2) All results are means ± SEM of scanned ratios between cPLA2a and TBP (three samples from three different batches of cultures). *Indicates statistically significant (P < 0.05) difference from control cultures from the same batch and treatment period. (A3–4 and B3–4) Protein expression measured by immunoblotting of cPLA2a (85 kDa). (A3 and B3) a representative experiment showing cPLA2a in the upper row and β-actin (42 kDa), as a house-keeping protein, in the lower row, in control cultures and the corresponding results in paroxetine-treated cultures. (A4 and B4) All results are means ± SEM of scanned ratios between cPLA2a and β-actin (three samples from three different batches of cultures). *Indicates statistically significant (P < 0.05) difference from control cultures from the same batch and treatment period.

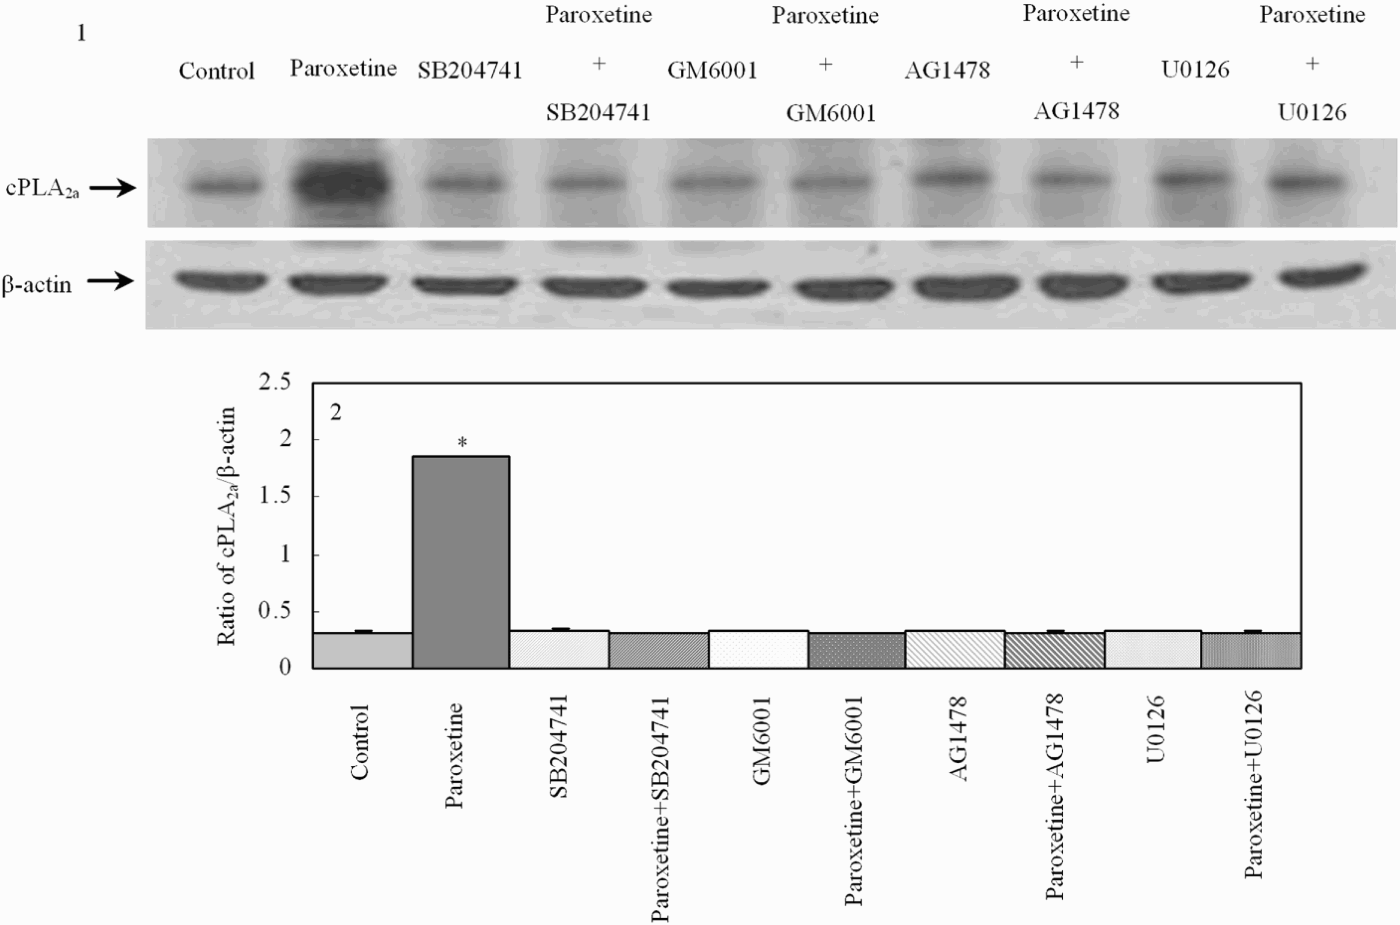
Paroxetine-induced up-regulation of cPLA2a protein expression in astrocytes requires 5-HT2B receptor activity, activation of Zn2+-dependent metalloproteinase, EGF receptor stimulation and ERK activation (Fig. 3). cPLA2a expression was tested in control cultures and in cultures treated with 10 µM paroxetine for 3 weeks in the absence or presence of one of the inhibitors, SB 204741, an antagonist of 5-HT2B receptors, GM6001, an inhibitor of Zn2+-dependent metalloproteinases, AG1478, an inhibitor of the EGF receptor or U0126, an inhibitor of ERK phosphorylation. A representative experiment showing cPLA2a in the upper row and β-actin in the lower row indicates that each of the inhibitors prevent the upregulation in a representative experiment (Fig. 3, 1), and scanned means of three individual experiments indicate that the inhibition is complete (Fig. 3, 2).
Paroxetine induced up-regulation of cPLA2a protein expression in astrocytes requires 5-HT2B receptor activity, activation of Zn2+-dependent metalloproteinase, EGF receptor stimulation and ERK activation. Cells were treated with or without 10 µM paroxetine for 3 weeks in the absence or presence of one of the inhibitors, 200 nM SB 204741, an antagonist of 5-HT2B receptors, 10 µM GM6001, an inhibitor of Zn2+-dependent metalloproteinases, 1 µM AG1478, an inhibitor of the EGF receptor or 10 µM U0126, an inhibitor of ERK phosphorylation. (1) A representative experiment showing cPLA2a in the upper row and β-actin in the lower row. (2) All results are means ± SEM of scanned ratios between cPLA2a and β-actin (three samples from three different batches of cultures). *Indicates statistically significant (P < 0.05) difference from other groups.

SERTRALINE AND FLUVOXAMINE
mRNA and protein expression of cPLA2a are shown in Fig. 4 as a function of the length of chronic treatment with 1 µM of either sertraline (Fig. 4A) or fluvoxamine (Fig. 4B). Again, the responses are virtually identical for mRNA and protein, with no effect of sertraline on either mRNA (Fig. 4, A1–2) or protein (Fig. 4, A3–4) after 1 week of treatment, a significant increase after 2 weeks, perhaps a slightly larger response after 3 weeks and a tendency towards a reduction after 4 weeks. They are very similar for fluvoxamine, with no response after 1 week (Fig. 4, B1–4) and an increase that appears to reach its maximum after 3 weeks of treatment.
Gene expression of cPLA2a in primary cultures of mouse astrocytes chronically treated with 1 µM sertraline (A) or 1 µM fluvoxamine (B) for 1–4 weeks. (A1 and B1) mRNA expression measured by RT-PCR of cPLA2a. A representative experiment showing mRNAs for cPLA2a in the upper row and for TBP, as a house-keeping gene in the lower row. (A2 and B2) All results are means ± SEM of scanned ratios between cPLA2a and TBP (three samples from three different batches of cultures). *Indicates statistically significant (P < 0.05) difference from control cultures from the same batch and treatment period. (A3 and B3) Protein expression measured by immunoblotting of cPLA2a. A representative experiment showing proteins for cPLA2a in the upper rows and for β-actin, as a house-keeping protein, in the lower rows. (A4 and B4) All results are means ± SEM of scanned ratios between cPLA2a and β-actin (three samples from three different batches of cultures). *Indicates statistically significant (P < 0.05) difference from control cultures from the same batch and treatment period.

CITALOPRAM
The response to 1 µM citalopram also reached a maximum after 3 weeks of treatment, but the increase began earlier, since both mRNA and protein expression of cPLA2a were significantly increased already after 1 week of treatment (Fig. 5, A1–4), suggesting a high affinity during chronic administration. This was confirmed by testing the effect of 0.1 and 0.5 µM citalopram on mRNA (Fig. 5, B1–2) and protein (Fig. 5, B3–4) expression of cPLA2a. After treatment with 0.5 µM citalopram an increased expression of both mRNA and protein expression was found after 2 weeks of treatment, but with 0.1 µM citalopram treatment was required for 3 weeks before the increase occurred. However, the magnitude of the response was almost the same at each of the concentrations and with either one there was a slight tendency towards a reduced response after 4 weeks.
Gene expression of cPLA2a in primary cultures of mouse astrocytes chronically treated with citalopram at 1 µM (A) or at 0.1 or 0.5 µM (B) for 1 to 4 weeks. (A1 and B1) mRNA expression measured by RT-PCR of cPLA2a. A representative experiment showing mRNAs for cPLA2a in the upper rows and for TBP, as a house-keeping gene, in the lower rows. (A2 and B2) All results are means ± SEM of scanned ratios between cPLA2a and TBP (three samples from three different batches of cultures). *Indicates statistically significant (P < 0.05) difference from control cultures from the same batch and treatment period. (A3 and B3) Protein expression measured by immunoblotting of cPLA2a. A representative experiment showing cPLA2a in the upper rows and β-actin, as a house-keeping protein, in the lower rows. (A4 and B4) All results are means ± SEM of scanned ratios between cPLA2a and β-actin (three samples from three different batches of cultures). *Indicates statistically significant (P < 0.05) difference from control cultures from the same batch and treatment period.

CONCLUSIONS
The present study has shown:
(i) qualitatively similar 5-HT2B and 5-HT2C expression in cultured astrocytes and in astrocytes obtained directly from the mouse brain after cell dissociation and FACS;
(ii) similar 5-HT2B receptor-mediated acute effects of paroxetine on ERK1/2 phosphorylation in cultured astrocytes, as previously demonstrated for fluoxetine; and
(iii) similar chronic effects on cPLA2a expression in cultured astrocytes as fluoxetine by paroxetine, sertraline, fluvoxamine and citalopram at 1 µM and in the case of citalopram even 0.1 µM, therapeutically highly relevant concentrations.
DISCUSSION
It is consistent with the observed absence of SERT in the cultured cells (and thus with the lack of possibility that any of the reported effects could be mediated via an effect on SERT) that in the normal mature central nervous system SERT is almost absent from glial cells (Pickel and Chan, Reference Pickel and Chan1999). Although the expression of 5-HT2B receptors in brain cortex is well established (Bonhaus et al., Reference Bonhaus, Bach, DeSouza, Salazar, Matsuoka and Zuppan1995), its astrocytic presence in cells obtained directly from the normal adult brain has not previously demonstrated. The present observation that mRNA of 5-HT2B receptor is distinctly expressed in an astrocytic cell fraction obtained directly from the adult mouse brain by FACS is in agreement with previous observations in cultured astrocytes. Nevertheless, the crucial questions remain whether SSRIs in the brain in vivo during treatment with conventional doses bind to these receptors and whether this results in an antidepressant effect. That binding to 5-HT2B receptors is associated with antidepressant activity is indicated by the observation that a single dose of d-fenfluramine, which is metabolized to the 5-HT2B agonist norfenfluramine (Rothman and Baumann, Reference Rothman and Baumann2009), lowers dysfunctional attitudes in healthy individuals (Meyer et al., 2002). That astrocytic 5-HT2B receptors are likely to be activated during chronic treatment with an SSRI is suggested by comparing plasma concentrations of the conventional SSRIs with the presently observed potency of their effects on cPLA2a in cultured astrocytes. In addition, there are functional indications that therapeutic concentrations of SSRIs may lead to binding to 5-HT2B receptor sites in other organs: pulmonary hypertension appears to be correlated with increased 5-HT2B receptor activation (Etienne et al., Reference Etienne, Schaerlinger, Jaffre and Maroteaux2004; Rhodes et al., Reference Rhodes, Davidson, Gibbs, Wharton and Wilkins2009), and persistent hypertension in the newborn shows a statistically significant increase of three to four times in babies born to mothers, who have taken SSRIs at therapeutic doses during the pregnancy (Reis and Kallen, Reference Reis and Kallen2010).
The SSRI binding in the brain in vivo does not need to have as high affinity to astrocytes as to SERT in order for the effects of SSRIs on astrocytes to be therapeutically meaningful. Studies by Meyer et al. (Reference Meyer, Kapur, Eisfeld, Brown, Houle and DaSilva2001, Reference Meyer, Wilson, Sagrati, Hussey, Carella and Potter2004), Kent et al. (Reference Kent, Coplan, Lombardo, Hwang, Huang and Mawlawi2002) and Voineskos et al. (Reference Voineskos, Wilson, Boovariwala, Sagrati, Houle and Rusjan2007) have shown that chronic treatment with the lowest doses of SSRIs that are therapeutically effective lead to an 80% reduction of in vivo binding of the selective SERT ligand [11C]DASB, due to SERT occupancy by the SSRI, but perhaps also to downregulation of SERT (Meyer et al., Reference Meyer, Kapur, Eisfeld, Brown, Houle and DaSilva2001; Hirano et al., Reference Hirano, Kimura, Sugimoto, Yamada, Uchida and Kato2005). However, even a several-fold increase in dosage leads to very little further increase in receptor occupancy (to ~85%) (Voineskos et al., Reference Voineskos, Wilson, Boovariwala, Sagrati, Houle and Rusjan2007), although the therapeutic efficacy is enhanced. These findings suggest that [11C]DASB binding in these chronically treated patients occurs to two sites, SERT (80% of binding) and ‘off-target’ sites, which may include astrocytes (up to 20% of binding, similar to the percentage of cortical volume occupied by astrocytes) (Hertz, Reference Hertz2008), contingent upon upregulation of the affinity for SSRIs and SSRI-like ligands such as [11C]DASB as a result of the chronic SSRI treatment. If binding to astrocytes account for 20% of binding, an increase in total occupancy from 80 to 85% would correspond to occupancy of 25% of the astrocyte binding sites. It may appear inconsistent with this hypothesis that [11C]DASB was found to have little or no affinity for a multitude of other transporters than SERT and to relevant receptors, defined as <25% effect at 1 µM (Wilson et al., Reference Wilson, Ginovart, Hussey, Meyer and Houle2002). Along similar lines Li et al. (Reference Li, Ma, Innis, Seneca, Ichise and Huang2004) found only negligible [11C]DASB binding to brain tissue in mutant mice, where SERT had been knocked out. However, lack of quantitatively significant binding of an SSRI-like SERT ligand to astrocytic 5-HT2B receptors is to be expected, unless the affinity of such ligands to the receptors has been upregulated by chronic treatment with an SSRI. It would therefore be important to repeat the experiment by Li et al. (Reference Li, Ma, Innis, Seneca, Ichise and Huang2004) in knock-out mice, which have been chronically treated with an SSRI for several weeks. This would strengthen the concept of astrocytes as a therapeutic target for antidepressant drugs (Manev et al., Reference Manev, Uz and Manev2003; present study).
Upregulation of cPLA2a by chronic treatment with fluoxetine has also been shown in rat brain (Rao et al., Reference Rao, Ertley, Lee, Rapoport and Bazinet2006). Activation of cPLA2a specifically releases arachidonic acid from the sn-2 position of membrane-bound phospholipid. Enhanced release of arachidonic acid may well be directly connected to one of the known biological effects of treatment with an SSRI in depressed patients, since (i) it has repeatedly been reported that SSRI treatment can normalize regional decreases in brain metabolism occurring during major depression, decreases that are more pronounced with the lower the plasma concentrations of arachidonic acid are (Sublette et al., Reference Sublette, Milak, Hibbeln, Freed, Oquendo and Malone2009) and (ii) arachidonic acid strongly stimulates glucose metabolism in cultured astrocytes (Yu et al., Reference Yu, Martin, Stella and Magistretti1993).
ACKNOWLEDGEMENTS
This study was supported by Grants Nos. 30670651, 30770667 and 30711120572 from the National Natural Science Foundation of China.
Statement of interest
None.