I. INTRODUCTION
The continuing demand for environmentally friendly alternative energy technologies has led to increased activities in the area of thermoelectric research. For high-temperature waste heat conversion applications, low-dimensional layered oxides, in both thin film and bulk forms, have been found to have relatively high efficiency (Tritt, Reference Tritt1996; Ghamaty and Eisner, Reference Ghamaty and Eisner1999; Venkatasubramanian et al., Reference Venkatasubramanian, Siivola, Colpitts and O'Quinn2001; Hsu et al., Reference Hsu, Loo, Guo, Chen, Dyck, Uher, Hogan, Polychroniadis and Kanatzidis2004; Dresselhaus et al., Reference Dresselhaus, Chen, Tang, Yang, Lee, Wang, Ren, Fleurial and Gogna2007). The efficiency and performance of thermoelectric energy conversion or cooling is related to the dimensionless figure of merit (ZT) of the thermoelectric (TE) materials, given by ZT = S 2 T/ρ κ, where T is the absolute temperature, S is the Seebeck coefficient or thermoelectric power, ρ is the electrical resistivity, and κ is the thermal conductivity (Nolas et al., Reference Nolas, Sharp and Goldsmid2001).
The search for oxide compounds with superior thermoelectric properties, including perovskites, continues. Examples of these oxides include La1−x A x CoO3 (A = Pb, Na) (He et al., Reference He, Chen, Calvarese and Subramanian2006), NaCoO x (Terasaki et al., Reference Terasaki, Sasago and Uchinokura1997), Ca2Co3O6 (Mikami et al., Reference Mikami, Funahashi, Yoshimura, Mori and Sasaki2003; Mikami and Funahashi, Reference Mikami and Funahashi2005), Ca3Co4O9 (Masset et al., Reference Masset, Michel, Maignan, Hervieu, Toulemonde, Studer and Raveau2000; Mikami et al., Reference Mikami, Itaka, Kawaji, Wang, Koinuma and Lippmaa2002; Grebille et al., Reference Grebille, Lambert, Bourée and Petricek2004; Hu et al., Reference Hu, Si, Sutter and Li2005), Bi2Sr2Co2O x (Shin and Murayama, Reference Shin and Murayama2000; Wang et al., Reference Wang, Venimadhav, Guo, Chen, Li, Soukiassian, Schlom, Pan, Wong-Ng, Vaudin, Cahill and Xi2009), Ba2Ho(Cu3−x Co x )O6+x (Wong-Ng et al., Reference Wong-Ng, Yang, Hu, Huang, Lowhorn, Otani, Kaduk, Green and Li2002), and (Bi,Pb)CuSeO (Hiramatsu et al., Reference Hiramatsu, Yanagi, Kamiya, Ueda, Hirano and Hosono2008; Luu and Vaquelro, Reference Luu and Vaquelro2013; Wong-Ng, et al., Reference Wong-Ng, Yan, Kaduk and Tang2016a). Phase diagram and structure/property relationship research using CaO and Co3O4 as two of the end members have been reported (Wong-Ng et al., Reference Wong-Ng, Liu, Martin, Thomas, Lowhorn and Otani2010, Reference Wong-Ng, Luo, Tang, Xie, Kaduk, Huang, Yang, Tang and Tritt2011, Reference Wong-Ng, Laws and Yan2013, Reference Wong-Ng, Laws, Talley, Huang, Yan and Kaduk2014). R(Co3/4Ti1/4)O3 is a series of distorted pervoskite materials that may have potential for thermoelectric applications.
Since X-ray diffraction (XRD) is a non-destructive technique for phase identification, XRD patterns are especially important for phase characterization. The main goal of this investigation is to determine and compare the crystal structure and crystal chemistry for R(Co3/4Ti1/4)O3 (R = La, Pr, Nd, Sm, Eu, Gd, Dy, Ho, Er, Tm, Yb, and Lu). The second goal is to determine the experimental patterns and to make these patterns broadly available through submission to the Powder Diffraction File (PDF) (Wong-Ng et al., Reference Wong-Ng, McMurdie, Hubbard and Mighell2001; PDF, 2017).
II. EXPERIMENTAL DETAILS
A. Sample preparation
The R(Co3/4Ti1/4)O3 samples were prepared from stoichiometric amounts of R 2O3 (R = La, Pr, Nd, Sm, Eu, Gd, Dy, Ho, Er, Tm, Yb and Lu), Co3O4, and TiO2 using solid-state high-temperature techniques. The starting samples were mixed, pelletized, and heat treated in air at 750 °C for 1 day and subsequently at 850 °C for 4 days, 1000 °C for 5 days, 1025 °C for 60 h. These samples except for R = La, Pr, and Nd were further heat treated at 1075 °C for 108 h. Samples with smaller ionic radius of R 3+ such as those with R = Er, Tm, and Yb were heat treated further at 1075 °C for another 160 h, and at 1250 °C for 60 h. During each heat treatment, the samples were furnace cooled. The heat treatment process was repeated until no further changes were detected in the powder XRD patterns.
B. X-ray Rietveld refinements and powder reference patterns
The R(Co3/4Ti1/4)O3 powders were mounted on quartz zero-background cells. The powder patterns were measured from 5 to 130° in 0.020 214 4° steps using CuK α radiation on a Bruker D2 Phaser diffractometer equipped with a LynxEye detector. NIST SRM 660a LaB6 was used as external calibration standard. The Rietveld refinement technique (Rietveld, Reference Rietveld1969) with the software suites EXPGUI (Toby, Reference Toby2001) and GSAS (Larson and von Dreele, Reference Larson and von Dreele2004) was used to determine the structure of R(Co3/4Ti1/4)O3. All Co/Ti sites were refined assuming 3:1 occupancy.
The constant wavelength Pseudo-Voigt profile function (function #2 with 18 terms) was used for all refinements (Howard, Reference Howard1982; Thompson et al., Reference Thompson, Cox and Hastings1987); only the LY and specimen displacement coefficients were refined. GSAS offers a number of different background functions. For each of these functions, the number of terms to be used is adjustable. The larger the number of terms, the more complex the shape that can be fit. In theory, each function will have advantages under different circumstances. In general, the Shifted Chebyschev (type #1) is preferable to the others for the vast majority of Rietveld refinements. In this work, background correction was performed using the GSAS background function #1 with six terms, and an absorption/surface roughness correction was applied using function #3.
Reference patterns were obtained with a Rietveld pattern decomposition technique. Using this technique, the reported peak intensities were derived from the extracted integrated intensities, and positions calculated from the lattice parameters. When peaks are not resolved at the resolution function, the intensities are summed, and an intensity-weighted d-spacing is reported. They are also corrected for systematic errors both in d-spacing and intensity. In summary, these patterns represent ideal specimen patterns.
C. Bond valence sum (BVS) (V b) calculations
The BVS values, V b, for R, Co, and Ti were calculated using the Brown–Altermatt empirical expression (Brown and Altermatt, Reference Brown and Altermatt1985; Brese and O'Keeffe, Reference Brese and O'Keeffe1991), and the results are also listed in Table III. The V b of an atom i is defined as the sum of the bond valences v ij of all the bonds from atoms i to atoms j. The most commonly adopted empirical expression for the bond valence v ij as a function of the interatomic distance d ij is v ij = exp[(R 0 −d ij )/B ]. The parameter, B, is commonly taken to be an “universal” constant equal to 0.37 Å. The values for the R 0 reference distances are, R 0 are: Ti3+–O 1.791, Co3+–O 1.70; La3+–O 2.172; Pr3+–O 2.135, Nd3+–O 2.117, Sm3+–O 2.088, Eu3+–O 2.076, Gd3+–O 2.065, Dy3+–O 2.036, Ho3+–O 2.023, Er3+–O 2.010, Tm3+–O 2.000, Yb3+–O 1.985, and Lu3+–O 1.971. For sites shared by more than one species, the resulting BVS is the weighted sum using the site occupancies.
III. RESULTS AND DISCUSSION
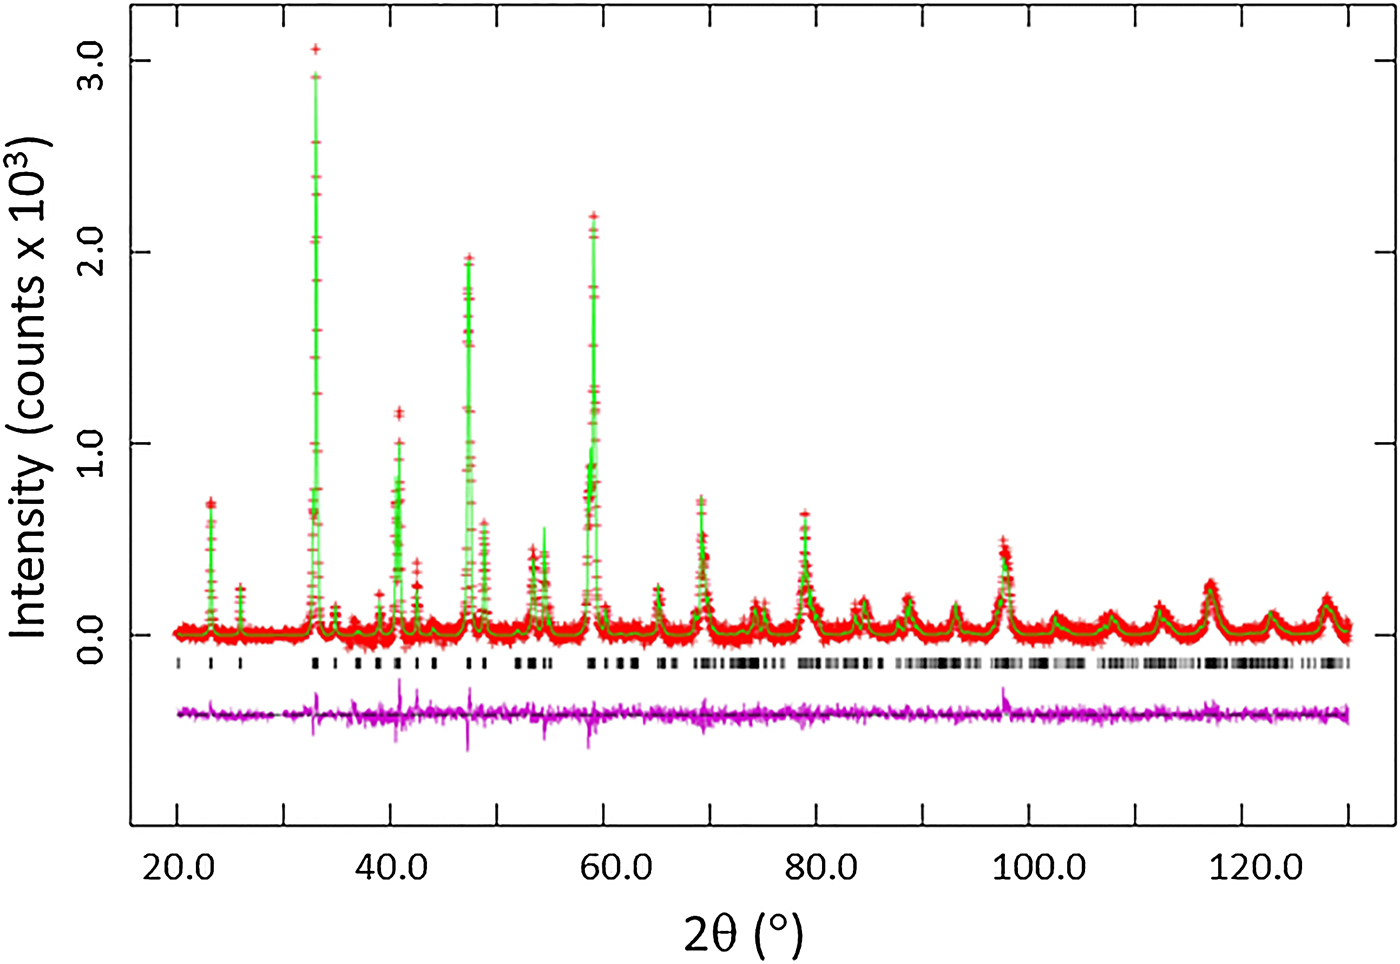
Among the 12 R(Co3/4Ti1/4)O3 samples that we prepared, only eight of them which have relatively larger size of R form single phase, namely, with R = La, Pr, Nd, Sm, Eu, Gd, Dy, Ho. Single phases were not formed for the compositions with R = Er, Tm, and Yb. Figure 1 gives the results of Rietveld refinements for Nd(Co3/4Ti1/4)O3, as an example. It is a least-squares plot to highlight the weak reflections (Larson and von Dreele, Reference Larson and von Dreele2004), where observed (crosses), calculated (solid line), and difference XRD patterns (bottom) are shown. The tick marks indicate the calculated peak positions, and the difference pattern is plotted on the same scale as other patterns. For 2θ > 36°, the vertical scale has been multiplied by a factor of 3.
(Color online) Observed (crosses), calculated (solid line), and difference XRD pattern (bottom) for Nd(Co3/4Ti1/4)O3 by Rietveld analysis technique. The difference pattern is plotted at the same scale as the other calculated peak positions. For 2θ > 36°, the vertical scale has been multipled by a factor of 3.

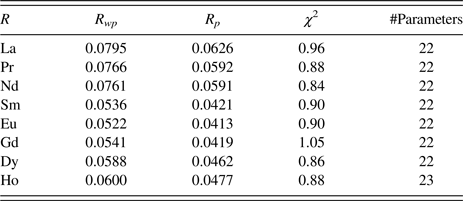
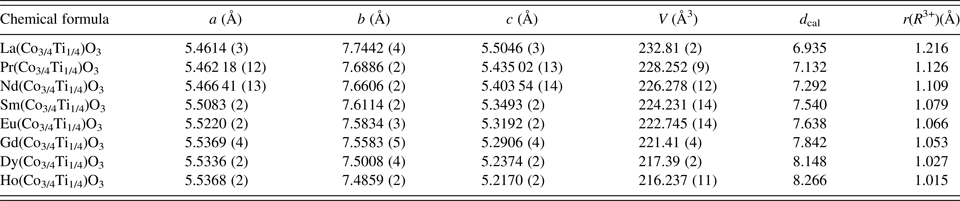
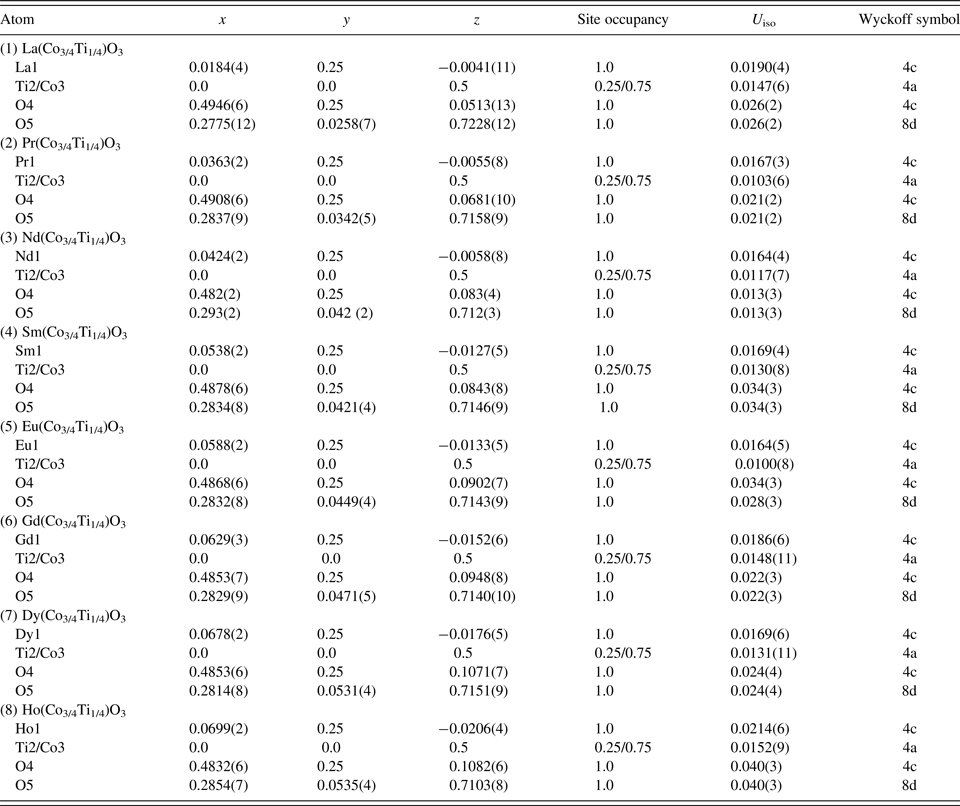
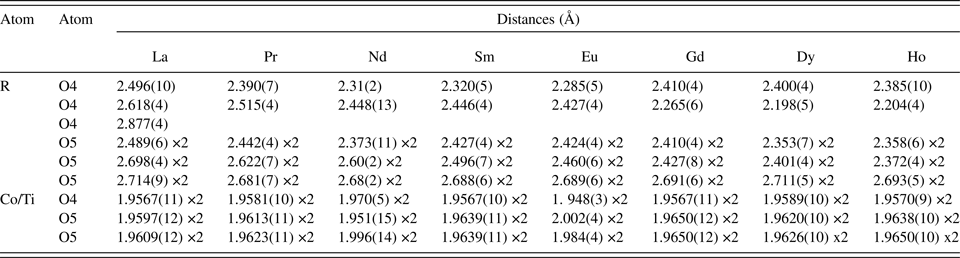
Table I gives the refinement results for R(Co3/4Ti1/4)O3. Table II reports the lattice parameters and calculated density D x . As expected, the D x values increase as the size of ionic radius, r(R 3+) (Shannon, Reference Shannon1976) decreases. The atomic coordinates and displacement parameters are given in Table III. Tables IV–VII summarize the bond distances, selected bond angles, tilt angles, and BVS values. It is seen from Table VI that the Co/Ti sites are all sixfold coordinated, having a distorted octahedral environment. The coordination number (C.N.) for R–O is 8 for all compounds except for La–O which is 9 (with R 3+–O bond distances <3 Å).
Rietveld refinement residuals for R(Co3/4Ti1/4)O3 (R = La, Pr, Nd, Sm, Eu, Gd, Dy, Ho).

Cell parameters for R(Co3/4Ti1/4)O3 (R = La, Pr, Nd, Sm, Eu, Gd, Dy, Ho); orthorhombic, Pnma, Z = 4 [uncertainties refer to standard deviation; r(R 3+) (Å) is the ionic radius for R(VIII coordination) for R = Pr, Nd, Sm, Eu, Gd, Dy, Ho, and R(IX) for R = La].

Atomic coordinates and displacement factors for compounds for R(Co3/4Ti1/4)O3 (R = La, Pr, Nd, Sm, Eu, Gd, Dy, and Ho).

Bond distances (Å) (<3 Å) for R(Co3/4Ti1/4)O3 (R = La, Pr, Nd, Sm, Eu, Gd, Dy, Ho).

Bond angles M–O4–M (°) and M–O5–M (°) for R(Co3/4Ti1/4)O3 (R = La, Pr, Nd, Sm, Eu, Gd, Dy, Ho) (M represents mixed (Co/Ti) sites).

Estimated tilt angles θ, ϕ, and ω (°) for R(Co3/4Ti1/4)O3 (R = La, Pr, Nd, Sm, Eu, Gd, Dy, Ho).

Bond valence sum (BVS) for R(Co3/4Ti1/4)O3 (R = La, Pr, Nd, Sm, Eu, Gd, Dy, Ho) (if more than one atom types occupy the same site, the resulting BVS is the weighted sum of each site occupancy; the ideal BVS values are 3.0 for the R–O site and 3.0 for the Co/Ti–O site, respectively).

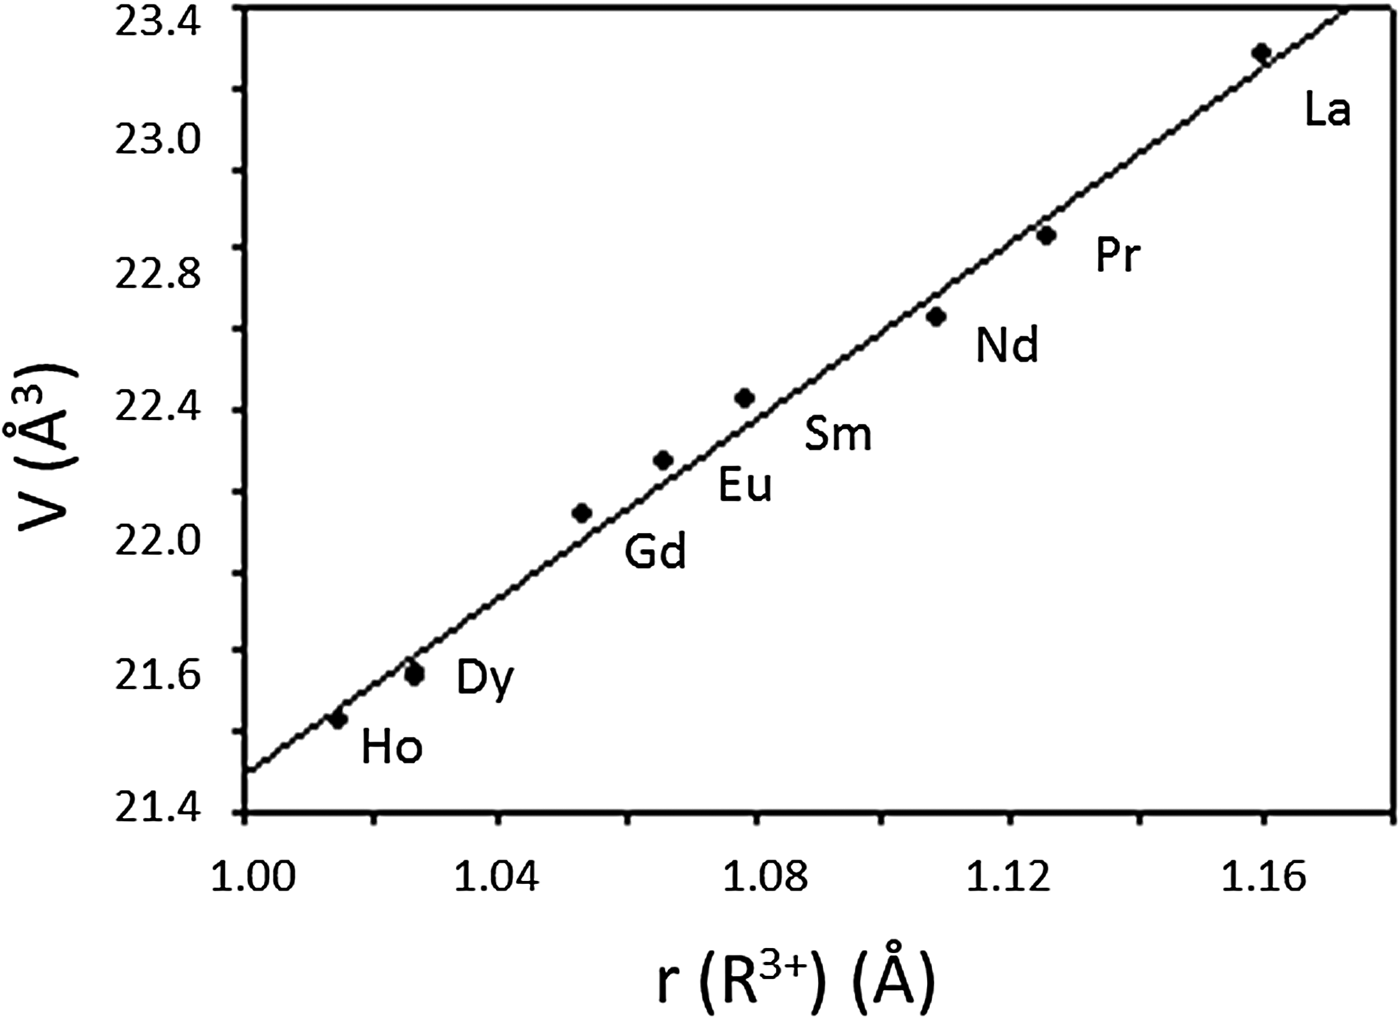
R(Co3/4Ti1/4)O3 phases adopt the orthorhombic Pnma (#62) symmetry, as determined by the combined anti-phase and in-phase octahedral rotations, which can be described as a − a − c + using Glazer's notation (Glazer, Reference Glazer1972). The unit-cell volume (Figure 2) for R(Co3/4Ti1/4)O3 decreases monotonically with the decreasing size of r(R 3+), from La to Ho, respectively. The volume decrease is mainly because of the smaller b and c lattice parameters, although the magnitude of the a-parameter maintains an opposite trend (Table II). This trend implies that the twisting of the [(Ti/Co)O6] octahedra in R(Co3/4Ti1/4)O3 has a larger influence on the magnitude of the a cell parameter, while that of the size of polyhedra, [RO x ], has a stronger effect on b and c.
Plot of unit-cell volume, V, of R(Co3/4Ti1/4)O3 (R = La, Pr, Nd, Sm, Eu, Gd, Dy, Ho) vs. ionic radius. A monotonic decrease of V is observed.

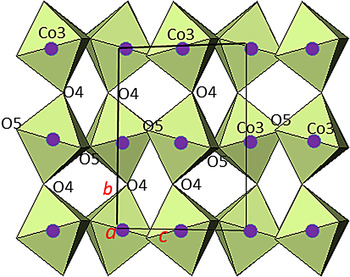
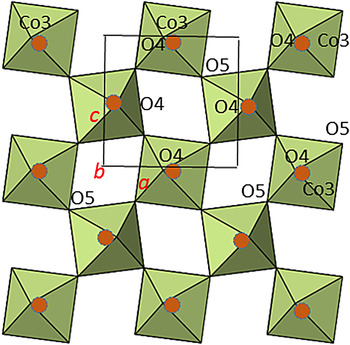
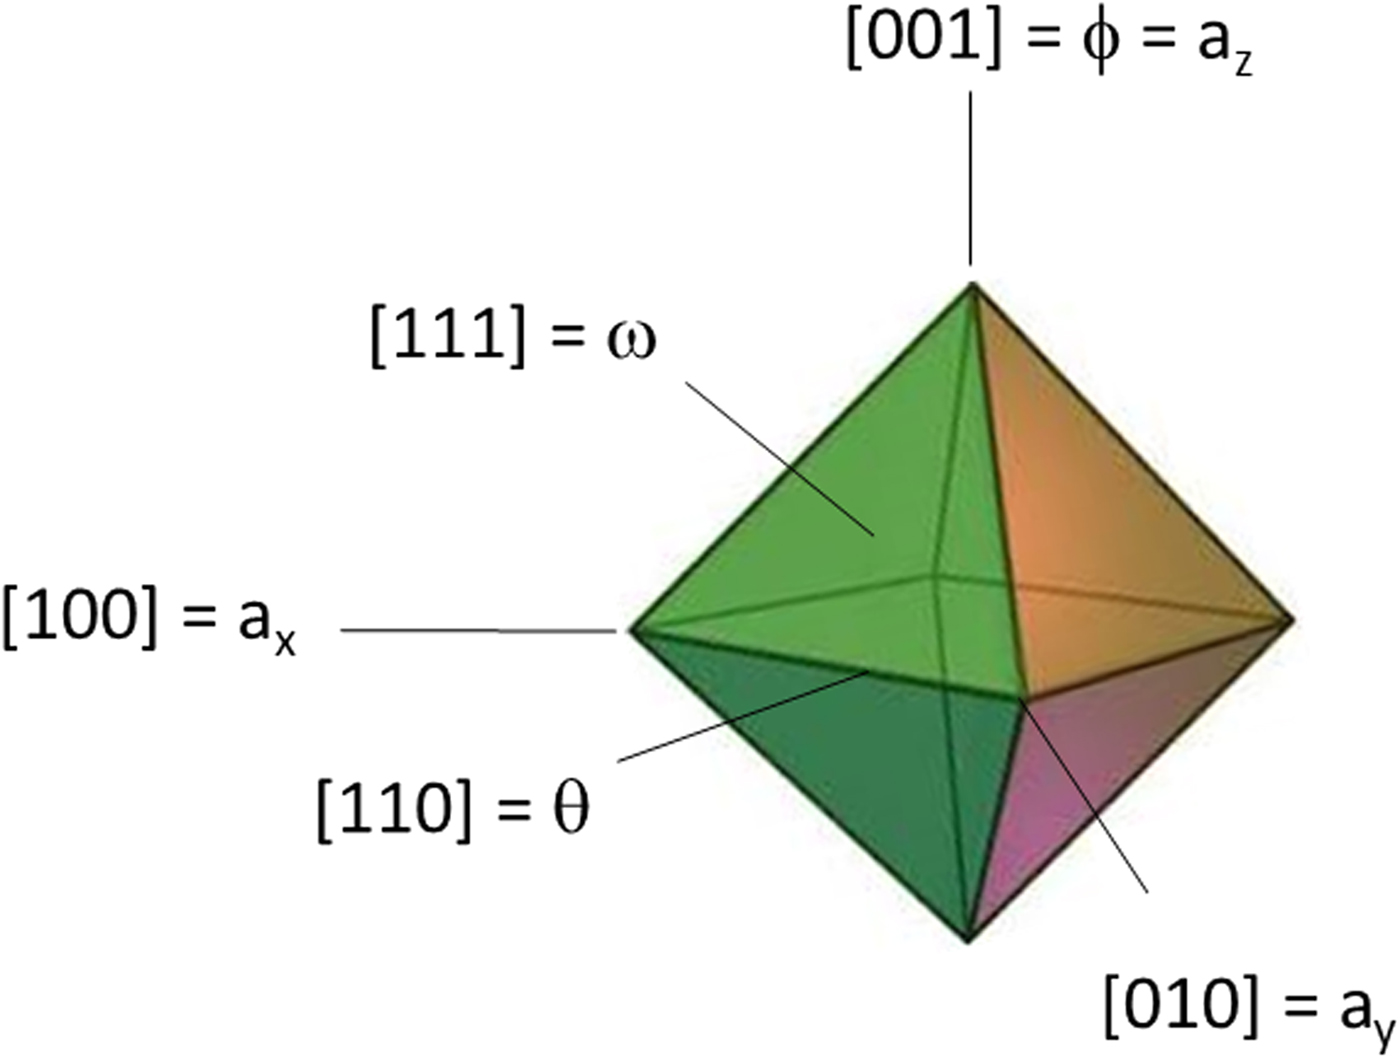
Figures 3 and 4 illustrate the structure of R(Co3/4Ti1/4)O3. In orthorhombic R 2 M 2O6 (“M” is used to represent the mixed site Co/Ti), there are two distinct M–O–M angles (M–O4–M and M–O5–M) that relate neighboring octahedra. The M–O4–M angle (Figure 3) and the M–O5–M angles (Figure 4) which both deviate from the ideal value of 180° reflect the degree of octahedral tilting. For example, from R = La to Ho, the O4–M–O4 angle decreases from 163.3(4) to 146.0(2)°, and the M–O5–M angle decreases from 162.9(3) to 151.0(2)°, respectively. The three tilt angles θ, ϕ, and ω that follow the notation of Zhao et al. (Reference Zhao, Weider, Parise and Cox1993a, Reference Zhao, Weider, Parise and Cox1993b) to represent rotations of octahedral about the pseudo-cubic [110]p, [001]p, and [111]p axes, respectively, are shown in Table V (Figure 5). All the three tilt angles increase from R = La to R = Ho: θ from 8.34 to 17.00°, ϕ from 6.24 to 8.53°, and ω from 10.41 to 18.96°, respectively. This increase across the lanthanide series indicates a greater octahedral distortion as the size of R 3+ decreases.
(Color online) Crystal structure of R(Co3/4Ti1/4)O3 based on X-ray powder data (viewed along the a-axis), showing the labeling of selected atoms, and the coordination environments of the cation sites (M refers to the mixed Co/Ti sites).

(Color online) Crystal structure of R(Co3/4Ti1/4)O3 based on X-ray powder data viewed along the b-axis, showing the labeling of selected atoms, and the coordination environments of the cation sites (M refers to the mixed Co/Ti sites).

(Color online) The three tilt angles θ, ϕ, and ω which follow the notation of Zhao et al. (Reference Zhao, Weider, Parise and Cox1993a, Reference Zhao, Weider, Parise and Cox1993b) represent rotations of the MO6 octahedron about the pseudo-cubic [110]p, [001]p, and [111]p axes, respectively, where M stands for Co/Ti.

The Goldschmidt geometrical tolerance factor (t) is a criterion for the stability and distortion of perovskite structures, ABO3. It can also be used to calculate the compatibility of an ion with a crystal structure. The tolerance factor t is defined as t = <r A + r O>/<r B + r O> (Goldschmidt, Reference Goldschmidt1926), where r A , r B , and r O represent the ionic radii of A-cations, B-cations, and oxygen, respectively. In the ideal cubic structure with t = 1, the unit-cell parameter a can be described as a = <r A + r O> = 2<r B + r O>. As t approaches 1, the structure is expected to become less distorted; with t < 1 the distortion is accommodated by the cooperative rotations of the [BO6] octahedra, resulting in a lower symmetry. In R(Co3/4Ti1/4)O3, the C.N. ranges from 8 to 9 for R 3+ sites and 6 for the Co3+/Ti3+ sites. The experimental R–O and Co/Ti–O values are used to compute the t values. As r(R 3+) decreases across the lanthanide series, so do the t values. The t values for R(Co3/4Ti1/4)O3, as R = La, Pr, Nd, Sm, Eu, Gd, Dy, and Ho are 0.913, 0.882, 0.876, 0.866, 0.861, 0.857, 0.848, and 0.843, respectively. Most of these t values (from R = Pr to R = Ho) fall in the range of Goldschmidt “orthorhombic/rhombohedral” structure type, approximately 0.71–0.90 (Goldschmidt, Reference Goldschmidt1926), except for the R = La compound that shows the structure type to be orthorhombic, but with a small tendency to be cubic. The trends of both the tilt angles and the Goldschmidt geometrical tolerance factor (t) are similar to that of the series of R(Co0.5 Fe0.5)O3 (R = Pr, Nd, Sm, Eu, Gd) (Wong-Ng et al., Reference Wong-Ng, Liu, Levin, Williamson, Ackerman, Talley, Martin, AlHamdan, Kaduk and Li2016b), which also has a similar distorted pervoskite structure.
The BVS values (Table VII) for the R 3+ sites in R(Co3/4Ti1/4)O3 were found to range from 2.659 to 2.988, indicating somewhat underbonding situation (oversized cages where R 3+ reside, as the BVS values are less than the ideal value of 3.0); whereas for the (Co/Ti)–O sites, the VBS values range from 3.031 to 3.166, indicating slightly overbonding situation (cage too small).
IV. REFERENCE XRD PATTERNS
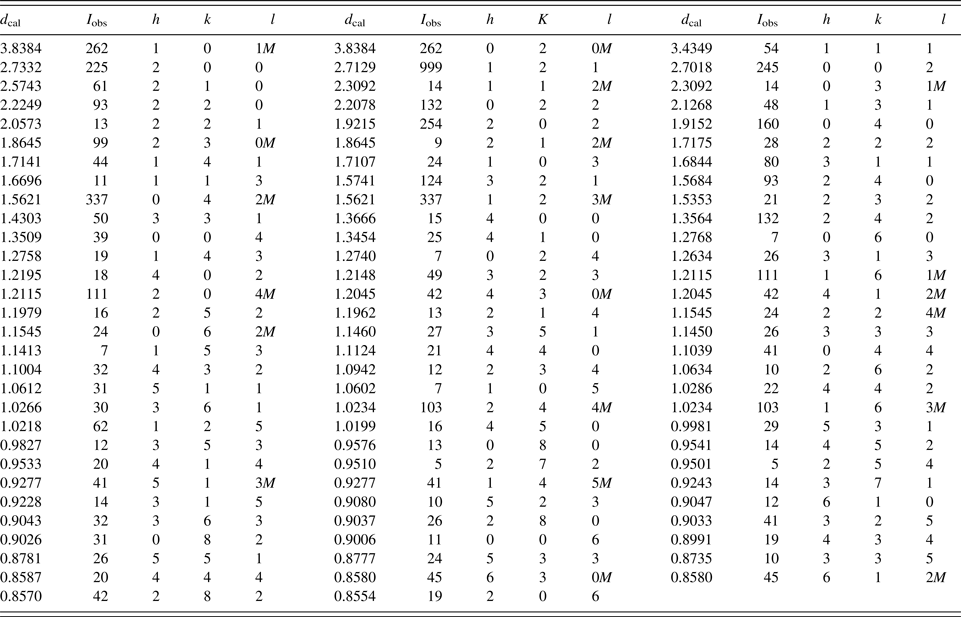
An example of the reference patterns of the Nd(Co3/4Ti1/4)O3 phase is given in Table VIII. In this pattern, the symbols “M” and “+” refer to peaks containing contributions from two and more than two reflections, respectively. The peak that has the strongest intensity in the entire pattern is assigned an intensity of 999 and other lines are scaled relative to this value. In general, the d-spacing values are calculated values from refined lattice parameters. The intensity values reported are integrated intensities (rather than peak heights) based on the corresponding profile parameters. For resolved overlapped peaks, intensity-weighted calculated d-spacing, along with the observed integrated intensity and the hkl indices of both peaks (for “M”), or the hkl indices of the strongest peak (for “+”) are used. For peaks that are not resolved at the instrumental resolution, the intensity-weighted average d-spacing and the summed integrated intensity value are used. In the case of a cluster, unconstrained profile fits often reveal the presence of multiple peaks, even when they are closer than the instrumental resolution. In this situation, both d-spacing and intensity values are reported independently. All patterns have been submitted for inclusion in the PDF.
X-ray powder pattern for Nd(Co3/4Ti1/4)O3 (Pnma, Z = 4), a = 5.466 41(13) Å, b = 7.6606(2) Å, c = 5.403 54(14) Å, V = 226.278(12) Å3, D x = 7.29 g cm−3) (the symbol “M” refers to peaks containing contributions from two reflections; the particular peak that has the strongest intensity in the entire pattern is assigned an intensity of 999 and other lines are scaled relative to this value; the d-spacing values are calculated values from refined lattice parameters, and “I” represents integrated intensity values).

V. SUMMARY
Crystal structure and X-ray powder reference patterns of R(Co3/4Ti1/4)O3 (R = La, Pr, Nd, Sm, Eu, Gd, Dy, Ho) series of compounds have been determined. R(Co3/4Ti1/4)O3 belongs to the distorted perovskite structure type, with a space group of Pnma, Z = 4. We have characterized and compared the structure including the degrees of distortion across the series using the tilt angles θ, ϕ, and ω. The Goldsmidth tilt angle calculations (“t” decreases from 0.913 to 0.843 for compounds of R = La to Ho) indicate the structure to be of the “orthorhombic/rhombohedral” structure type, except for the R = La compound, which also has a small tendency to be cubic. The powder patterns of the R(Co3/4Ti1/4)O3 series have been submitted to the PDF.
ACKNOWLEDGEMENT
ICDD is acknowledged for the Grant-in-Aid assistance for the project.