INTRODUCTION
Coccolithophorids (Haptophyta) are a major component of phytoplankton communities in the open ocean and play a pivotal role in biogeochemical cycles, predominantly through global ocean calcification (Westbroek et al., Reference Westbroek, Brown, Bleijswijk, Brownlee, Brummer, Conte, Egge, Fernández, Jordan, Knappertsbusch, Stefels, Veldhuis, van der Wal and Young1993) and influence on the Earth's climate by production of dimethylsulphonium propionate (DMSP) (Malin & Steinke, Reference Malin, Steinke, Thierstein and Young2004). From this group, Emiliania huxleyi (Lohmann) Hay and Mohler has been the most ubiquitous and abundant species. This organism shows overcalcification, playing an important role, along with other coccolithophorids, in controlling the alkalinity and carbonate chemistry in the photic zone of the world ocean and also promoting CO2 sequestration to the deeper regions and to the seafloor (Westbroek et al., Reference Westbroek, Brown, Bleijswijk, Brownlee, Brummer, Conte, Egge, Fernández, Jordan, Knappertsbusch, Stefels, Veldhuis, van der Wal and Young1993; Iglesias-Rodríguez et al., Reference Iglesias-Rodríguez, Brown, Doney, Kleypas, Kolber, Kolber, Hayes and Falkowski2002; De Vargas et al., Reference De Vargas, Aubry, Probert, Young, Falkowski and Knoll2007).
Emiliania huxleyi blooms can be easily detected by satellite imagery and have been usually reported in the North Atlantic, at lesser extent in the North Pacific Ocean and recorded in the Patagonia shelf as a frequent feature, in SeaWiFS images during November and December (Tyrrell & Merico, Reference Tyrrell, Merico, Thierstein and Young2004).
Over the last years, some studies have suggested that the surface waters of the Patagonian continental shelf and slope (Argentinean Sea) act as sink of CO2 (Bianchi et al., Reference Bianchi, Pino, Perlender, Osiroff, Segura, Lutz, Clara, Balestrini and Piola2009). Recent works have reported water masses and air–sea CO2 flux patterns in that region (Bianchi et al., Reference Bianchi, Bianucci, Piola, Pino, Schloss, Poisson and Balestrini2005, Reference Bianchi, Pino, Perlender, Osiroff, Segura, Lutz, Clara, Balestrini and Piola2009 and references therein), remote sensing-retrieved chlorophyll-a and calcite variability (Romero et al., Reference Romero, Piola, Charo and Garcia2006; Signorini et al., Reference Signorini, Garcia, Piola, Garcia, Mata and McClain2006) and primary production rates (Lutz et al., Reference Lutz, Segura, Dogliotti, Gagliardini, Bianchi and Balestrini2010). However, there are few studies focusing on phytoplankton communities and their relation with environmental parameters (Garcia et al., Reference Garcia, Garcia, Mata, Pollery, Piola, Signorini, McClain and Iglesias-Rodríguez2008; Signorini et al., Reference Signorini, Garcia, Piola, Evangelista, McClain, Garcia and Mata2009).
As a ubiquitous bloom-forming coccolithophorid in the world ocean (Brown, Reference Brown1995; Paasche, Reference Paasche2001), Emiliania huxleyi appears in the Patagonian continental shelf and slope in late spring, according to remote sensing information, as previously mentioned for the south-western Atlantic Ocean (Mostajo, Reference Mostajo1985, Reference Mostajo1986). On the other hand, the occurrence of coccolithophorid blooms in situ in the region has only been reported for Emiliania huxleyi in the northern Argentine Sea (Gayoso, Reference Gayoso1995), recently in the Patagonian shelf and slope (Painter et al., Reference Painter, Poulton, Allen, Pidcock and Balch2010) and for Gephyrocapsa oceanica (Negri et al., Reference Negri, Silva and Valiñas2003). Emiliania huxleyi often dominates over other autotrophs under suitable environmental conditions, such as shallow mixed layer depth (MLD), high irradiance levels and low nutrient concentrations (Andruleit et al., Reference Andruleit, Stäger, Rogalla and Cepek2003; De Vargas et al., Reference De Vargas, Aubry, Probert, Young, Falkowski and Knoll2007), which are typically found during summertime, especially at temperate regions.
Several tools can be applied to study phytoplankton communities in the environment. The classical microscope counts and biometrics can be combined with other recent techniques to provide a more comprehensive picture of taxonomic groups and their relative contribution to total plankton biomass. Some studies conducted in the south-western Atlantic, near Río de La Plata mouth, have used both microscopic techniques and pigment analyses by high-performance liquid chromatography (HPLC) (Carreto et al., Reference Carreto, Montoya, Benavides, Guerrero and Carignan2003, Reference Carreto, Montoya, Akselman, Carignan, Silva and Colleoni2008) and found a good agreement between microscope and HPLC-derived phytoplankton community assemblages. The first work showed a complex community structure that comprised occasional blooms of diatoms, cryptophytes and haptophytes overlapping small sized cells in the background (Carreto et al., Reference Carreto, Montoya, Benavides, Guerrero and Carignan2003). In general, microscope analyses allow species identification and biometrics of each specimen, which can be converted into species-specific biovolume or biomass (Sournia, Reference Sournia1978). On the other hand, the HPLC approach and use of CHEMTAX software (Mackey et al., 1996) provide best results on those organisms not easily identified by light microscope and, consequently, both techniques can be complementary in the study of phytoplankton community ecology.
The present work describes the phytoplankton community associated with a bloom of Emiliania huxleyi during a summer period, in a region under the influence of sub-Antarctic waters at the southern Patagonian continental shelf. Results from both microscope counts and HPLC analyses on the phytoplankton community are shown and related to environmental factors.
MATERIALS AND METHODS
Study area and sampling procedure
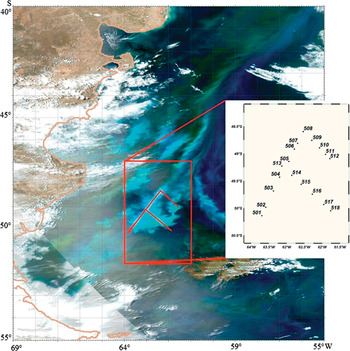
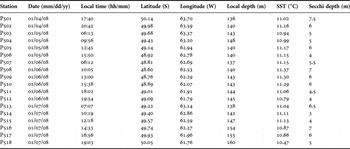
The sampling region was selected after examination of MODIS images of the Patagonian shelf to reveal patches of coccolithophorids. A total of eighteen stations were sampled over a high reflectance patch in the region 48.5° to 50.5° S (Figure 1), from 4–7 January 2008. Details of dates, station positions and some measured parameters can be seen in Table 1. Vertical profiles of temperature and salinity were obtained with a SeaBird® 911+ conductivity–temperature–depth (CTD) system and data were calibrated and reduced to 1-m bins. More details about physical and optical features during the cruise can be seen in Garcia et al. (in press). Surface water samples were collected with a Van Dorn bottle, and discrete sampling of the water column was carried out using Niskin bottles attached to the CTD rosette. Samples for both microscope and pigment analyses were taken at surface and at the depth of apparent fluorescence peak. However, a later examination of physical and biological data showed that the apparent fluorescence peak was an artefact of fluorescence quenching by light towards the surface (Falkowski & Raven, Reference Falkowski and Raven2007). Furthermore, the apparent peaks were located within the upper mixed layer (except for Station 508, where the peak was below the mixed layer) and, therefore, can be considered as homogeneous with surface samples.
MODIS-Acqua ‘quasi true-color’ image of the study region on 31 December 2007, showing the turquoise water typical of coccolithophorid patch, and location of the 18 occupied stations during the PATEX V cruise (4–7 January 2008) at the southern Patagonian shelf.

Details of sampling stations and some environmental parameters during the PATEX V cruise (4 – 7 January 2008).

Nutrient determination
Water samples for dissolved inorganic nutrients (nitrate, nitrite, ammonium, phosphate and silicate) were filtered on cellulose acetate membrane filters. Nutrients were analysed on-board ship, following the processing recommendations in Aminot & Chaussepied (Reference Aminot and Chaussepied1983). Ammonium was measured by the method of Koroleff (Reference Koroleff1969) following modifications in Aminot & Chaussepied (Reference Aminot and Chaussepied1983) and absorbance readings at 630 nm. Orthophosphate was measured by reaction with ammonium molybdate and absorption reading at 885 nm. Silicate measurements in the form of reactive Si were corrected for sea salt interference following Aminot & Chaussepied (Reference Aminot and Chaussepied1983). Absorbance values for all nutrients were measured in a FEMTO® spectrophotometer.
HPLC pigment analysis
Seawater samples of 0.5–1 l were filtered onto Whatman GF/F filters (nominal pore size 0.7 µm and 25 mm diameter), under vacuum pressure lower than 500 mbar. The filters were immediately stored in liquid nitrogen. Photosynthetic pigments were extracted with 2 ml of 95% cold-buffered methanol (2% ammonium acetate) for 30 minutes at –20°C, in the dark. Samples were sonicated (Bransonic, model 1210) for 1 minute at the beginning of the extraction period. The samples were centrifuged at 1100 g for 15 minutes, at 4°C. Extracts were filtered (Fluoropore PTFE filter membranes, 0.2-μm pore size) and immediately injected in the HPLC.
Pigment extracts were analysed using a Shimadzu HPLC that comprised a solvent delivery module (LC-10ADVP) with system controller (SCL-10AVP), a photodiode array (SPD-M10ADVP) and a fluorescence detector (RF-10AXL). The chromatographic separation of pigments was achieved using a monomeric OS C8 column (Symmetry C8, 15-cm long, 4.6 mm in diameter and 3.5-µm particle size). Mobile phases were: (A) methanol:acetonitrile:aqueous pyridine solution (0.25 M, pH adjusted to 5.0 with acetic acid) (50:25:25, v/v/v); and (B) methanol:acetonitrile:acetone (20:60:20, v/v/v). The solvent gradient followed Zapata et al. (Reference Zapata, Rodríguez and Garrido2000) with a flow rate of 1 ml min−1, an injection volume of 100 µl and run duration of 40 minutes.
Pigments were identified from absorbance spectra and retention times and concentrations were calculated from the signals in the photodiode array detector or fluorescence detector (Ex. 430 nm; Em. 670 nm). The HPLC system was calibrated with pigment standards from Sigma (chlorophyll-a, chlorophyll-b and β-carotene) and DHI (for other pigments).
Pigment data processing (CHEMTAX)
The relative abundance of microalgal classes contributing to total chlorophyll-a (Chl a) biomass was calculated by pigment concentration data using version 1.95 of CHEMTAX software (Mackey et al., Reference Mackey, Mackey, Higgins and Wright1996). CHEMTAX uses a factor analysis and steepest-descent algorithm to find the best fit of the data on to an initial pigment ratio matrix. The basis of calculations and procedures used are fully described in Mackey et al. (Reference Mackey, Mackey, Higgins and Wright1996).
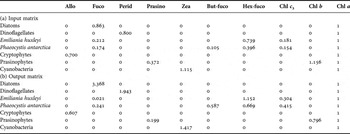
The pigments and microscopic analyses revealed that 2 types of haptophytes were present: Type 6 with 19′-hexanoyloxyfucoxanthin (Emiliania huxleyi) and Type 8 with both 19′-hexanoyloxyfucoxanthin and 19′-butanoyloxyfucoxanthin (Phaeocystis antarctica) (Zapata et al., Reference Zapata, Jeffrey, Wright, Rodríguez, Garrido and Clementson2004). These will be referred to as their respective species names with quotes, in the groups’ output results of the CHEMTAX program. Based on these considerations and the diagnostic pigments detected, 7 algal groups were loaded into CHEMTAX: diatoms, dinoflagellates, ‘Emiliania huxleyi’, ‘Phaeocystis antarctica’, cryptophytes, prasinophytes and cyanobacteria (see Table 2). The pigments loaded were alloxanthin (Allo), fucoxanthin (Fuco), peridinin (Perid), prasinoxanthin (Prasino), zeaxanthin (Zea), 19′-butanoyloxyfucoxanthin (But-fuco), 19′-hexanoyloxyfucoxanthin (Hex-fuco), chlorophyll-c 3 (Chl c 3), chlorophyll-b (Chl b) and Chl a.
Marker pigment to Chl a ratios. Input ratios were obtained from the literature (Carreto et al., Reference Carreto, Montoya, Benavides, Guerrero and Carignan2003; Zapata et al., Reference Zapata, Jeffrey, Wright, Rodríguez, Garrido and Clementson2004) and output ratios (after 14 runs) were estimated with the CHEMTAX program as mean values of six best final matrices.

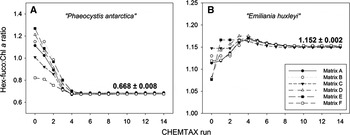
Initial pigment:Chl a input ratios were derived from the literature (Carreto et al., 2003—a study near the geographical study region; and Zapata et al., Reference Zapata, Jeffrey, Wright, Rodríguez, Garrido and Clementson2004 for E. huxleyi and P. antarctica ratios) (Table 2). For optimization of that input matrix, a series of 60 pigment ratio tables were generated by multiplying each ratio of the initial table by a random function as described in Wright et al. (Reference Wright, Ishikawa, Marchant, Davidson, van den Enden and Nash2009). The best six output results (with the smallest residual) were then selected to apply a further fourteen successive CHEMTAX runs in order to check final ratios convergence, according to Latasa (Reference Latasa2007). Using the output pigment:Chl a ratios matrix of each run as input for the following run, ratios should stabilize towards their most probable values (Latasa, Reference Latasa2007). The Hex-fuco:Chl a ratios evolution for ‘P. antarctica’ and ‘E. huxleyi’, important similar-sized nannoflagellates that share the Hex-fuco pigment, showed a convergence at 0.668 ± 0.008 (mean ± SD) and 1.152 ± 0.002 (mean ± SD), respectively (Figure 2). The final results (ratios and abundances) were then calculated as the average of the final six outputs obtained after the processing described above. The optimized pigment ratio matrix derived by CHEMTAX is presented in Table 2. This matrix was generated by pooling samples data from both the surface and the apparent fluorescence peak, since the latter was contained within the upper mixed layer, as stated previously.
Evolution of Hex-fuco:Chl a ratios of the six input matrices (A–F), after successive runs of CHEMTAX for (A) ‘Phaeocystis antarctica’ and (B) ‘Emiliania huxleyi’, with mean and standard deviation shown for the final run. See text for initial matrices (A–F) calculation method.

Phytoplankton counting and identification
For phytoplankton identification and counting, water samples were preserved in amber glass flasks (~250 ml) with 2% alkaline Lugol's iodine solution. Settling chambers from 10 to 50 ml volume were used under the inverted microscope (Utermöhl, Reference Utermöhl1958; Sournia, Reference Sournia1978). Species composition was determined with an Axiovert 135 ZEISS microscope, at 200×, 400× and 1000× magnification, according to specific literature.
Each of all species abundance (expressed in 106 cells l−1) was converted to biovolume (mm3 l−1 in the figures) using two or three linear dimensions from captured images by a camera (Spot Insight QE) attached to the microscope or during observation. At least 30 specimens were randomly chosen for metrics of each species or major taxa and, then, biovolume was estimated using the most similar geometric shape (Hillebrand et al., Reference Hillebrand, Dürselen, Kirschtel, Pollingher and Zohary1999). Due to its symbiotic relationship with cryptophytes which contain alloxanthin, Myrionecta rubra (known autotrophic ciliate) was considered as Myrionecta rubra + cryptophytes in the figures. Except for dinoflagellates, flagellates were combined and are referred to as ‘Other Flagellates’, due to difficulties in discriminating them by microscopy. A scanning electron microscope (SEM) was used to confirm the identification of coccolithophorids.
Statistical analysis
In order to determine a relationship between the HPLC-derived data and biovolume estimates using cell counts, Pearson-r parametric correlation coefficients were calculated between both methods used in this study.
Cluster analysis using group average linkage and the Bray–Curtis similarity index (Clarke & Warwick, Reference Clarke and Warwick1994) was used to describe spatial similarities between sites at the level of algal division, genus or species. The absolute contribution of the more frequent (>10% in all samples) algal category to the total biovolume at each site was transformed using the square root equation (Zar, Reference Zar1999) and used as the input data.
Finally, for every pair of biotic and environmental parameters, non-parametric statistical analysis was applied using Spearman's rank correlations, due to small number of sampling stations (N = 18 for biological features or N = 17 for physical and chemical parameters). In order to verify the relationships between the biota and environmental features, only the significant correlations at P < 0.05 were taken into account.
RESULTS
Environmental setting
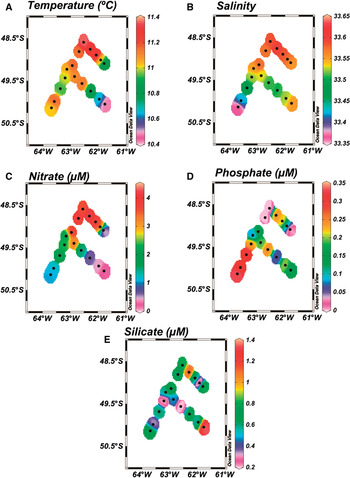
The study region was characterized by a slightly north–south surface gradient regarding temperature, salinity and nutrients concentration, namely nitrate and phosphate (Figures 3A–D, respectively). Nitrate concentration was variable and ranged from 0.2 µM at the south-eastern Station 518 to a moderately high concentration of 4.17 µM at Station 509, located in the northernmost part of the study area (Figure 3C). Phosphate showed an opposite distribution pattern with higher values at the southernmost part, reaching 0.33 µM at Station 501 but with values below the detection limit at Stations 507, 508 and 512 (Figure 3D). Silicate levels were lower than 2 µM throughout the study area, with highest concentration at Station 518 (1.35 µM; Figure 3E). Consequently, the nutrient ratios were variable in the sampling stations and these ratios departed from the Redfield–Brzezinski ratio of 15Si:16N:1P (Brzezinski, Reference Brzezinski1985). The N:P ratio oscillated between 5:1 (Stations 517 and 518) and 48:1 (at the northernmost area), while the Si:N ratio was generally lower than 1, except at Station 518 where it reached 2:1.
Surface distribution of environmental variables: (A) temperature (°C); (B) salinity; (C) nitrate (µM); (D) phosphate (µM); (E) silicate (µM). Note the missing data at Station 506.

Based on water column measurements of light in the photosynthetic active radiation (PAR) region, the euphotic layer depth was estimated between 20 m (Station 512) and 43 m (Stations 517 and 518), being mostly shallower than the averaged mixed layer depth of ~37 m at all stations (Garcia et al., in press). The difference between MLD and euphotic depth was between 2 and 19 m, except at Stations 516, 517 and 518, where the euphotic layer was deeper than the MLD, coinciding with lower coccolithophorid abundance at those stations (see Figure 9).
Pigment concentrations and CHEMTAX analysis
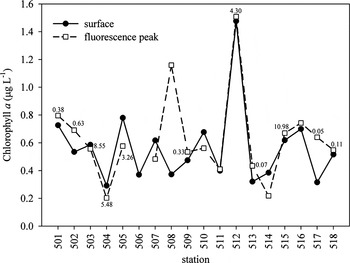
Chlorophyll-a concentrations (biomass index) at each station during the sampling period, both at surface and at the apparent fluorescence peak, are shown in Figure 4. Surface values varied between 0.3 and 1.5 µg l−1. Highest Chl a was detected at Station 512 (north-eastern part of study area) and lowest at Stations 504, 513 and 517. In general, Chl a values were very similar between surface and apparent peaks, confirming the homogeneity of the mixing layer. The exception was Station 508, where Chl a concentration at the fluorescence peak, which was below the mixed layer, was three-fold that at surface (Figure 4).
Chlorophyll-a concentrations for each sampling station both at the surface (continuous line) and at the apparent fluorescence peak (dashed line). Numbers next to points indicate surface cell abundance of Emiliania huxleyi (×106 cells l−1), ranging from 0.05 at Station 517 to 10.98 at Station 515.

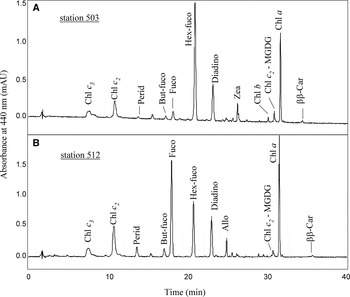
High-performance liquid chromatography analyses resulted in identification of a variety of pigments. Two typical chromatograms were selected to show a contrast between stations and to display the diversity of pigments recorded in the study area (Figure 5). Besides Chl a, Hex-fuco was the main accessory photosynthetic pigment, with concentrations ranging from 0.1 to 0.7 µg l−1. This is a major pigment for coccolithophorids and highest concentrations were observed at Stations 503 (Figure 5A), 515 and 505 (0.60, 0.65 and 0.69 µg l−1, respectively). Other carotenoids were sparsely detected in high concentrations, such as Perid, assigned to dinoflagellates, at Stations 501, 507 and 508 (>0.3 µg L−1) and Fuco at Station 512 (0.96 µg l−1; Figure 5B). The pigments Allo, Zea, But-fuco, Prasino, Chl b, diatoxanthin and diadinoxanthin were also quantified, but were found in concentrations lower than 0.1 µg l−1.
Selected high-performance liquid chromatography chromatograms showing pigment patterns associated with the main phytoplankton assemblages during PATEX V cruise: (A) sample with dominance of 19′-hexanoyloxyfucoxanthin (Hex-fuco; Station 503); (B) sample with a higher concentration of fucoxanthin (Fuco; Station 512).

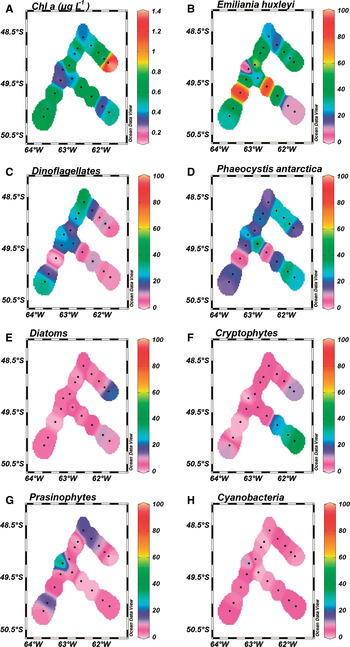
The CHEMTAX-derived distribution of phytoplankton groups (Figure 6) showed a general dominance of ‘Emiliania huxleyi’ (0–83% of total Chl a), dinoflagellates (0–37%) and ‘Phaeocystis antarctica’ (6–36%), with a minor contribution of diatoms, cryptophytes, prasinophytes and cyanobacteria. ‘Emiliania huxleyi’ was the major contributor in almost all sampling stations, with values higher than 80% determined at Stations 503 and 515 (Figure 6B). Dinoflagellates were important at Stations 501, 507 and 508, where they contributed with 30% to 40% to Chl a concentration (Figure 6C). ‘Phaeocystis antarctica’ represented between 10% and 40% at almost all stations, except at those with maximum ‘E. huxleyi’ contribution (503 and 515) (Figure 6D). The highest values of Chl a attributed to diatoms were obtained at Stations 512 (21%), 517 and 518 (~10%) (Figure 6E). Cryptophytes (here considering also Myrionecta rubra) were the main contributors at Stations 516, 517 and 518 with 24%, 30% and 40% of Chl a biomass, respectively (Figure 6F). Prasinophytes (34%; Figure 6G) and cyanobacteria (11%; Figure 6H) were more pronounced at the lowest phytoplankton biomass surface sample (Station 513).
Surface distributions of (A) chlorophyll-a and, fraction of different phytoplankton groups contributing to total chlorophyll-a concentration, estimated by interpretation of high-performance liquid chromatography-derived pigment data using CHEMTAX program: (B) Emiliania huxleyi; (C) dinoflagellates; (D) Phaeocystis antarctica; (E) diatoms; (F) cryptophytes; (G) prasinophytes; (H) cyanobacteria.

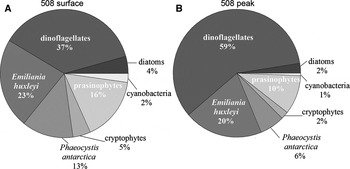
Phytoplankton assemblages, based on CHEMTAX results, were similar at surface and apparent fluorescence peak for all samples, even for Station 508, where a peak was actually detected (Figure 7). Thus, results in this study were mainly focused on describing the phytoplankton community of the surface samples, as representative of the MLD assemblage.
Percentage contribution of phytoplankton groups (CHEMTAX-allocated) to the total Chl a at Station 508: (A) surface; (B) fluorescence peak. Note that Station 508 showed three-fold Chl a at the peak, as compared to the surface (see Figure 3).

Phytoplankton community composition based on microscopy
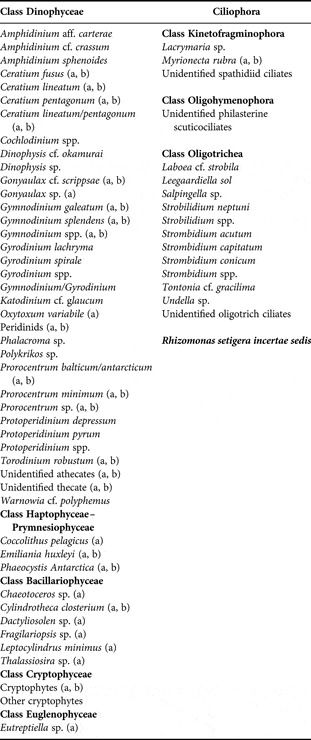
Considering both autotrophic and mixotrophic/heterotrophic organisms, at least 45 species or higher taxa were identified comprising the phytoplankton assemblages, and 13 ciliates, including the autotroph Myrionecta rubra (= Mesodinium rubrum) (Table 3).
Checklist of species or higher taxa identified during the ‘PATEX V’ cruise. The photosynthetic organisms were labelled (a) and those used in the cluster analysis were labelled (b).

Dinoflagellates were the most diverse taxonomic group, comprising 14 autotrophic taxa among species and/or genera, the largest in size being Ceratium lineatum/pentagonum, Prorocentrum spp., gymnodinioids and peridinioids. All of those were more important at the northernmost stations.
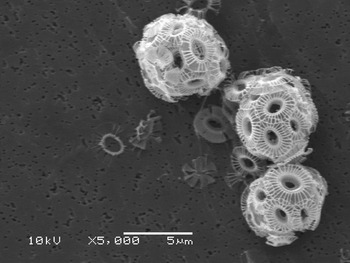
The coccolithophorid E. huxleyi, probably type B/C (Figure 8), outnumbered other organisms at all stations, with a range of 50,000 cells l−1 at Station 517 to 11 × 106 cells l−1 at Station 515 (see Figure 4). Another haptophyte, Phaeocystis antarctica, was found at all stations; while diatoms were more abundant at Station 512, almost exclusively represented by the opportunistic nano-sized pennate Cylindrotheca closterium. The least represented organisms were cryptophytes, the euglenophyte Eutreptiella sp. and the heterotrophic flagellate Rhizomonas setigera. The majority of identified ciliates were heterotrophic aloricate oligotrichs, but at Stations 516, 517 and 518 at the south-eastern section of the study area Myrionecta rubra (having symbiosis with cryptophytes) had an important relative contribution to total biovolume.
Photomicrograph of Emiliania huxleyi probably type B/C, which occurred throughout the sampling stations. Scale bar: 5 µm.

Biomass derived by both CHEMTAX and algal biovolume
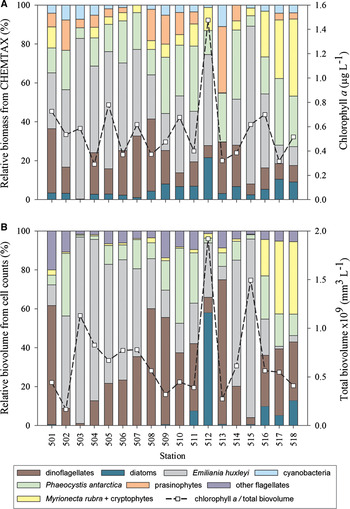
The surface phytoplankton assemblage derived from CHEMTAX analysis was in agreement with the species-specific biovolume data obtained by microscope counts (Figure 9). Similar results were found by both techniques for some groups, such as the ubiquity and relative abundance of dinoflagellates, while some discrepancies were found for others, such as the general although small presence of diatoms and the determination of cyanobacteria and prasinophytes by the CHEMTAX analysis, which were not identified by microscopy (Figure 9A). Flagellates including identified and non-identified organisms, were not very significant in numbers and in biomass, but were found throughout the sampling stations by microscopy and grouped under the category ‘Other Flagellates’ (Figure 9B).
Percentage contribution of (A) CHEMTAX-allocated Chl a of each phytoplankton group to total Chl a and (B) biovolume of respective phytoplankton groups to total biovolume. The dashed line shows total Chl a (A) and total biovolume (B) on the right axes scales.

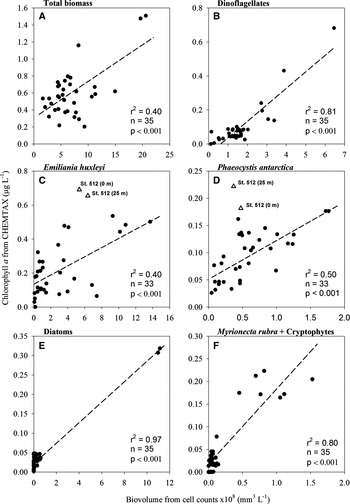
Figure 10 shows relationships between microscope (as biovolume) and CHEMTAX (as chlorophyll biomass) analysis of the different groups or organisms. A positive and significant relationship was found between total Chl a biomass derived from the CHEMTAX analysis and total biovolume (r 2 = 0.40; Figure 10A). Biovolume of dinoflagellates, E. huxleyi, P. antarctica, diatoms and Myrionecta rubra + cryptophytes showed significant relationships to their relative contribution to the Chl a (Figure 10B–F, respectively). Note the two outliers at the E. huxleyi and P. antarctica data (Figure 10C, D), which corresponded to samples with highest fucoxanthin concentration, at Station 512. At this site, diatoms were relatively abundant, resulting in a poor correlation between CHEMTAX and microscope data and a clear overestimation by the former.
Linear regressions between estimated Chl a and calculated biovolume from cell counts for the phytoplankton groups: (A) total biomass; (B) dinoflagellates; (C) Emiliania huxleyi; (D) Phaeocystis antarctica; (E) diatoms; (F) Myrionecta rubra + cryptophytes. For E. huxleyi and P. antarctica, the Station 512 (surface and peak) was excluded from the regression analysis due to evident overestimation by CHEMTAX (see text for details).

Other statistical analysis
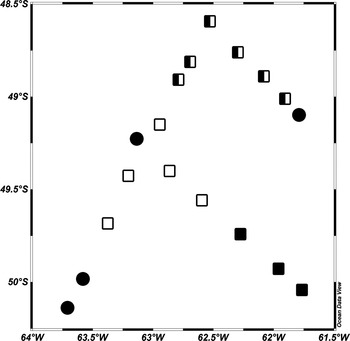
Figure 11 shows results of the cluster analysis, based on the total biovolume of the main phytoplankton groups from surface samples. The analysis separated sampling sites into 3 groups (60% similarity). A first and main cluster assembled samples with coccolithophorid dominance (60–80%) (empty squares), comprising Stations 503, 504, 505 and 515. A second cluster (black squares) was characterized by Myrionecta rubra + cryptophytes (Stations 516, 517 and 518), associated with the lowest total biovolume of E. huxleyi. The third cluster (half-filled squares) presented conditions of intermediate biovolume values of E. huxleyi, relevant concentrations of gymnodiniods, peridinioids and large cells of Ceratium lineatum/pentagonum and P. antarctica (Stations 506–511). Finally, four sampling points were not grouped with the identified clusters (black-filled circles), corresponding to Station 512, with maximum contribution of the diatom C. closterium, Station 513, with the highest dinoflagellate biovolume, Station 501, with extremely low biovolume values and Station 502, also with low biovolumes but still a considerable relative contribution of E. huxleyi (see also Figure 9B).
Schematic representation of phytoplankton assemblages along the region surveyed as defined by a cluster analysis based on biovolume data (less frequent taxa (<10%) were excluded) for all surface samples (Bray–Curtis similarity index and group average linkage clustering method, cf. Clarke & Warwick Reference Clarke and Warwick1994). Symbols: open squares (□) refer to the highest abundance of Emiliania huxleyi (Stations 503, 504, 505, 514 and 515); half-filled squares (◧) refer to high biovolumes of dinoflagellates (Stations 506, 507, 508 and 509) and/or the haptophyte Phaeocystis antarctica (Stations 510 and 511); black-filled squares (■) are related to the main contributions of Myrionecta rubra + cryptophytes (Stations 516, 517 and 518); and black-filled circles (●) refer to mixed assemblages (Stations 501, 502, 512 and 513; see more in the text).

DISCUSSION
Results of phytoplankton community composition by both HPLC pigment and microscope analysis in this work have confirmed the occurrence of coccolithophorid blooms in summer at the study region, as predicted in satellite studies (e.g. Signorini et al., Reference Signorini, Garcia, Piola, Garcia, Mata and McClain2006), with the species Emiliania huxleyi dominating the phytoplankton assemblage in almost all sampling stations. However, the importance of other phytoplankton taxa, mainly dinoflagellates, Phaeocystis antarctica and even the diatom Cylindrotheca closterium was observed at some sampling sites. This demonstrates the complexity and patchy spatial distribution of coccolithophorid blooms (Signorini et al., Reference Signorini, Garcia, Piola, Garcia, Mata and McClain2006 and references therein).
Comparisons between microscope-derived biovolume and percentage contribution to HPLC-derived Chl a biomass showed positive correlations for all studied groups. The correlations for E. huxleyi and P. antarctica were not as high as for dinoflagellates and diatoms. This can probably be related to a misidentification of the flagellate stages of P. antarctica and similar-sized coccolithophorids without coccoliths under the microscope (De Vargas et al., Reference De Vargas, Aubry, Probert, Young, Falkowski and Knoll2007). Other studies have also pointed out the difficulty in determining picoflagellates and cryptophytes that are close to the resolution limits of the light microscope, as compared with the HPLC technique, which can detect diagnostic pigments at relatively low concentrations (Llewellyn et al., Reference Llewellyn, Fishwick and Blackford2005 and references therein). Another cause for discrepancies between both methods can be partly attributed to the precision of cell counts. This is particularly relevant for those groups characterized by low cell numbers. Nevertheless, with the Utermöhl method, both the quantity and diversity of phytoplankton can be determined in water samples, making it a widely used method for the quantitative analysis of phytoplankton (IOC UNESCO, Reference Karlson, Cusack and Bresnan2010).
Diatoms were present at almost all sampling stations according to HPLC data, but this was not detected by microscopy, probably due to higher sampling volumes used for HPLC analysis (filtering volumes of about one litre). It should be noted that the presence of rare and large diatom species not visible in the relatively small volume analysed by microscope could have been detected in the pigment analyses. However, a fraction of the measured fucoxanthin could be due to haptophytes (Wright & Jeffrey, Reference Wright, Jeffrey and Volkmann2006), which were the dominant group in this study. Consequently, at a few samples (especially at Station 512), E. huxleyi and P. antartica seemed to be overestimated by CHEMTAX. On the other hand, we have found a strong correlation between fucoxanthin concentration and diatom abundance (r2 = 0.95) and a weak correlation with P. antarctica abundance (r2 = 0.25), indicating that diatoms were the main contributors to measured fucoxanthin. Emiliania huxleyi abundance did not show any correlation with fucoxanthin concentration.
The main phytoplankton group observed in the sampling sites in this work was coccolithophorids, massively dominated by E. huxleyi, with cell numbers between 50,000 cells l−1 and 11 × 106 cells l−1. The species was probably the cold-water morphotype B/C, found in high latitudes. Other studies, in the Eastern Bering Sea (North Pacific), have found similar or lower E. huxleyi concentrations (up to 2.1–2.8 × 10⁶ cells l−1) (Sukhanova & Flint, Reference Sukhanova and Flint1998; Merico et al., Reference Merico, Tyrrell, Lessard and Cokacar2006). However, the authors mentioned that the relatively high concentrations found in those blooms would be an unusual phenomenon when compared to events found in sub-Arctic North Atlantic and adjacent seas. This highlights the potential importance of E. huxleyi blooms at the southern Patagonian shelf, regarding DMSP production and downward fluxes of calcium carbonate and particulate organic matter. In fact, there were indications that significant amounts of calcite from coccoliths were associated with the E. huxleyi patch sampled in this work (see Garcia et al., in press).
The patchy distribution of the phytoplankton community in the study region was demonstrated by a major dominance of coccolithophorids at some stations, while others were better represented by dinoflagellates, diatoms or a mixture of taxa (see Figure 9). According to non-parametric correlations (Spearman r) possible explanations for this mosaic-like distribution pattern of phytoplankton communities could be nutrient availability. For instance, nitrate concentration was positively associated with temperature and salinity (rs = 0.79 and 0.58, respectively, P < 0.05), but negatively correlated with diatoms and Myrionecta rubra + cryptophytes (rs = –0.71 and –0.54, respectively). Those organisms were generally found together (0.58) at the easternmost colder part of the study area, with smaller contribution of coccolithophorids, being assembled as a separate cluster. Some studies have demonstrated that coccolithophorids usually have an important contribution to the phytoplankton biomass during summer, along with dinoflagellates, as partners in oceanic areas (Falkowski et al., Reference Falkowski, Katz, Knoll, Quigg, Raven, Schofield and Taylor2004; Turkoglu, Reference Turkoglu2008). This is in agreement with the high and constant presence of dinoflagellates in the same samples characterized by elevated E. huxleyi abundance in the present study.
Merico et al. (Reference Merico, Tyrrell, Lessard, Oguz, Stabeno, Zeeman and Whitledge2004) suggested that a shallow mixed layer depth, and lack of photoinhibition of E. huxleyi in the environment, would represent favourable conditions for bloom development of this organism in the Bering Sea shelf. However, differently from other studies, they did not find a clear relationship between those blooms and high N:P ratio. In the present work, we could not associate the coccolithophorid abundance with any absolute nutrient concentration, but there was indication of an association between high abundance of E. huxleyi with low Si:N ratio (rs = –0.49, P < 0.05), which was the opposite situation found for high concentration of diatoms and high Si:N ratio (0.54, P < 0.05). According to Egge & Aksnes (Reference Egge and Aksnes1992), waters with very low silicate concentrations (<2 µmol l−1) are thought to represent a favourable condition to coccolithophorids in competition with diatoms. Putland et al. (Reference Putland, Whitney and Crawford2004) found surprising correlations between E. huxleyi and some environmental factors (temperature and nutrient concentrations) suggesting that this species would have a distinct ecological niche in the north-eastern Pacific in relation to its counterpart in the North Atlantic.
In our study, the sampled E. huxleyi bloom was in a late developmental stage, as indicated by optical and biochemical measurements during the same cruise (see Garcia et al., in press). Both relatively high ratios of PIC:POC (particulate inorganic to organic carbon) and high light backscattering found in the study region, were associated with presumably large concentrations of detached coccoliths in the water column.
We can speculate that during the summer season coccolithophorids would flourish in a shallow mixed layer, which is nutrient-depleted due to the precedent spring diatom blooms, when deeper MLD and high nutrient levels prevail, associated with upwelled waters (Signorini et al., Reference Signorini, Garcia, Piola, Garcia, Mata and McClain2006; Garcia et al., Reference Garcia, Garcia, Mata, Pollery, Piola, Signorini, McClain and Iglesias-Rodríguez2008). Other previous works suggested that shallow MLD (<20 m) would be better suited for a long persistence of coccolithophorid blooms (Andruleit et al., Reference Andruleit, Stäger, Rogalla and Cepek2003), a situation not registered in our case, where MLD were not particularly shallow (approximately 40 m; Garcia et al., in press). We suggest that E. huxleyi can still grow and flourish within a MLD around 40 m in the Patagonian continental shelf, which would extend the ecological ability of this species to a new environmental realm. However, typical environmental conditions for E. huxleyi blooms such as a shallow MLD and low nutrient concentrations (conferring them a competitive advantage) are subject to short-term changes, i.e. at daily or weekly scales, imposing new conditions for the phytoplankton community. For instance, some investigations in the study area have shown that stronger tidal currents often cause shifts in the water column stability, increasing the mixing layer depth, providing a major environmental factor affecting phytoplankton community structure (Acha et al., Reference Acha, Mianzan, Guerrero, Favero and Bava2004; Bianchi et al., Reference Bianchi, Bianucci, Piola, Pino, Schloss, Poisson and Balestrini2005, Reference Bianchi, Pino, Perlender, Osiroff, Segura, Lutz, Clara, Balestrini and Piola2009; Romero et al., Reference Romero, Piola, Charo and Garcia2006). In fact, apart from the known seasonal phytoplankton succession (Margalef, Reference Margalef and Buzzati-Traverso1958; Reynolds, Reference Reynolds and Kinne1997; Smayda & Reynolds, Reference Smayda and Reynolds2001), stochastic environmental shifts could promote the particular optimal environment for growth of opportunistic phytoplankton species, such as Cylindrotheca closterium and gymnodiniod dinoflagellates, found in this work. Processes such as wind-driven mixing or tidal currents disrupting a stable water column and enhancing the mixing layer depth, could provide temporary favourable conditions for some diatom and dinoflagellate species to dominate over E. huxleyi.
Apart from physical and chemical constraints, another driving force that could exert influence on phytoplankton community is the top-down control, when selective grazing over other phytoplankton groups can lead to increasing and persistence of E. huxleyi abundance (Fileman et al., Reference Fileman, Cummings and Llewellyn2002; Olson & Strom, Reference Olson and Strom2002; Putland et al., Reference Putland, Whitney and Crawford2004). In our study, there was not a good correlation between the microheterotrophs and any phytoplankton group (data not shown), although there was no survey of large heterotrophs such as copepods that could indicate their grazing pressure upon the phytoplankton community. Nevertheless, Sabatini et al. (Reference Sabatini, Reta and Matano2004) identified high zooplankton abundance during summer in the southern Patagonian shelf (between 48° and 54.5° S), at onshore and offshore sites, with copepods, euphausiids and amphipods as the main groups. Also, these authors indicated that this ‘zooplankton hot spot’ could be related to retention of phytoplankton biomass following the nutrient entrainment from the south nutrient-rich waters after shifts in the water column stabilization, mainly north of 51° S. Therefore, grazing processes may have also contributed to the observed patterns in the phytoplankton assemblages in the present work.
CONCLUSION
A bloom of coccolithophorids, massively dominated by Emiliania huxleyi, was sampled in summer at the southern Patagonian shelf. The relatively high concentrations of E. huxleyi indicate their potential relevance in biogeochemical cycles in the region. The phytoplankton community associated with the coccolithophorid bloom comprised dinoflagellates (mainly Gymnodiniales), the haptophyte Phaeocystis antarctica, cryptophytes and diatoms, particularly the pennate species Cylindrotheca closterium. The relative contribution of the different groups varied markedly between sampling stations. A cluster analysis based on biovolume estimates of phytoplankton groups showed one group dominated by coccolithophorids (E. huxleyi), associated with low Si:N ratio, another group where Myrionecta rubra + cryptophytes dominated and a third group dominated by dinoflagellates and P. antarctica. Comparisons between microscope-derived biovolume and HPLC/CHEMTAX-derived results showed that both techniques provided complementary information, proving useful to understand the phytoplankton community distribution in the region.
ACKNOWLEDGEMENTS
We thank the Captain of Navy RV ‘Ary Rongel’, Arlindo Moreira Serrado, and his officers and crew as well as SECIRM's officer on-board for all their support and help during the field survey. Laboratory facilities were provided by the Centro de Oceanografia da Faculdade de Ciências da Universidade de Lisboa (Portugal) for HPLC analyses, and by the Laboratório de Fitoplâncton e Microorganismos Marinhos (Institute of Oceanography, FURG, Brazil) for microscopic analyses. We are grateful to M.D. Mackey for a copy of the CHEMTAX software. The present work was carried out as part of the SOS-Climate project inserted in the Brazilian Antarctic Program under the auspices of the CIRM/SECIRM. This work was supported by financial resources from both the Brazilian National Council for Scientific and Technological Development (CNPq) and the Brazilian Ministry of Environment (MMA), as well as by the program FCT-GRICES/CAPES. C.R.M. was funded by a PhD grant from FCT, Portugal [SFRH/BD/36336/2007]. A PhD fellowship from CAPES (Brazil) was granted to M.S.deS.