1 Introduction
Risk transfer among generations through bonus-participating products with an underlying interest guarantee has been a widely popular approach to pension funding in many years in many countries. For example, in Denmark there are more than 200 billion Euros of savings in this type of product, e.g. more than 35.000 Euros per citizen. This paper analyses properties of with-profit interest guarantee products where the customer pays for the minimum guaranteed interest rate. We consider a simplified model approximating complicated non-transparent with-profit contracts with such interest guarantees.
Our analysis shows that a customer receives three blows when paying for a minimum interest guarantee. The first blow comes from the with-profit mechanism itself. We find the performance of the with-profit mechanism unconvincing in the sense that it does not convincingly outperform a trivial fixed stock proportion benchmark product. The second blow comes from the payment of the risk premium. The third blow is an opportunity cost that follows any loss when saving: the money lost makes the customer more risk averse. However, this is an intrinsic feature of saving (if not invested in a risk free instrument) so does not differentiate between saving products carrying an interest rate guarantee and those that do not. In the Danish market of interest guarantee products the costs of the above three blows seem to be found in the neighbourhood of a loss of around 0.75 percent a year accumulating to a fortune over the life span of the individual pension saver.
To be able to quantify the above three blows we use the performance methodology recently developed by Guillén et al. (Reference Guillén, Nielsen, Pérez-Marín and Petersen2011). This approach is indeed a pragmatic one and only a first step towards a scientifically based method to compare and evaluate pension products. However, the advantage of having a concrete idea of the magnitude of the customers losses is important to be able to identify and communicate the magnitude of the issue, especially to non-expert clients. For example, the approximative 0.75% a year loss of returns suggested by our results would imply that the total cost to savers could be approximated at about 1.5 billion Euros per year or even more.
Our contribution connects with the work by Gatzert et al. (Reference Gatzert, Huber and Schmeiser2011) who found that subjective pricing of guarantees by customers of insurance products was below the true price. Customers’ decisions in a market for products with guarantees may need simpler explanations than the ones that are currently given by underwriters. We believe that if customers are not well informed then their perceptions on the cost of guarantees may be distorted. These customers may think that guarantees are cheaper than they really are and may expect guaranteed minimum interest rates to have less impact on the long-term return than they do have. Nevertheless, we must remark that the cost of the guarantee is not completely taken by the firm as a profit as it can also be considered as a contribution to reserves that could somehow be paid back if not needed.
Our aim is to present a very simple approach to assess the impact of minimum interest guarantees and to find evidence with our illustration of the impact on return when buying an interest guarantee in pension funds that exist today in the Danish market. The paper is organised as follows. In section two we describe the pension products that we consider in our analysis and the investment strategy of our case study is presented. In section three we define our performance methodology. In section four we show the results of a Monte Carlo simulation study and section five summarises the main conclusions.
2 Description of the with-profit return mechanism
We model the company balance sheet at time t by three quantities. The market value of the company assets in total is denoted At. The liabilities of the company consists of the policyholders account balance Pt and a bonus reserve Bt. The latter represents the buffer whose function is to protect the policy reserve from the risks associated with the asset base and changes in actuarial variables, such as mortality. Bt is in other words the undistributed reserve, i.e. bonus reserve plus equity, and is defined as the difference At−Pt. Therefore the simplified pension company's balance sheet is given by assets At, and liabilities Pt and Bt.
The total value of the company investment evolves as in Guillén et al. (Reference Guillén, Nielsen, Pérez-Marín and Petersen2011) according to a geometric Brownian motion:
 $$ \eqallignno{{ dA(t)\: = \: & \{ r\: + \:\pi (t)(\mu {\rm{ - }}r)\} A(t)dt\: + \:\pi (t)\sigma A(t)dW(t){\rm{ - }}{{r}^ \ast } d{{P}_t} \cr \qquad A(0)\: = & \:{{A}_0}, \cr} $$
where r is the risk-free return, μ is the expected yearly return on stocks, σ is the volatility, and π(t) is the proportion invested in risky assets which we specify later in equation (4). We denote by r* the risk premium, which represents an indirect payment for the interest guarantee and it is subtracted from the company assets. Note that if the company offers some interest guarantee to its clients, this implies some liabilities to the equity and therefore a reduction in the company assets. This is the reason why the risk premium represents an indirect payment for the interest guarantee. We also assume that the net cash flow from and into the company is equal to zero.
On the liability side of the company's balance sheet we have:
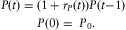 $${ P(t)\: = \: & (1\: + \:{{r}_P}(t))P(t{\rm{ - }}1) \cr P(0)\: = \: & {{P}_0}. \cr} $$
Note that the bonus distribution is made on a group level and not on the policy level. Therefore in the above equation we assumed that the net cash flow is equal to 0, so the policy rate rp(t) is independent of whether the pension saver has just purchased the contract and is paying the premiums, or retired and receiving annuities.
2.1 Bonus distribution mechanism
The bonus distribution mechanism is designed such that it captures the performance of the market and the solvency requirements the company has to fulfil, while providing a low-risk return. The pension saver receives some guaranteed return, but this promised rate may be topped off with a bonus depending on the degree of solvency in the company. We define the bonus by:
 $$ {{r}_P}(t;A(t{\rm{ - }}1),P(t{\rm{ - }}1))\: = \:{{r}_G}\: + \:{\rm{max}}\left[ {0,\beta \left( {\frac{{B(t{\rm{ - }}1)}}{{P(t{\rm{ - }}1)}}{\rm{ - }}\psi } \right)} \right], $$
where ψ is a critical buffer ratio, i.e. a constant ratio of bonus reserves to policy reserves B(·)/P(·) which the company is willing to maintain, and β is a distribution ratio determining a positive fraction of excessive bonus reserve which is distributed to the pension saver's account. If the actual buffer relative to the policy account balance exceeds the critical level ψ, the company distributes a fraction β of the surplus. Policy interest rp(t) is determined at time t−1 (is Ft −1-measurable), which is motivated by practice where policy rates for year t are typically announced by the companies in mid-December of year t−1.
To determine the values for (β, ψ) we refer to Grosen & Jørgensen (Reference Grosen and Jørgensen2002). These authors estimate bonus distribution parameters  $ (\hat{\beta },\hat{\psi }) $ using the maximum likelihood technique (ML). The statistical model is based on a hand-collected set of solvency ratios reported by the largest Danish L&P companies during the period 1991–2000, and on the policy interest rates rp(·) collected directly from the companies.
2.2 Investment strategy
The company assets consist of risky assets (stocks) and risk-free assets (bonds). The distribution between these two types is determined by the stock proportion function π(t). The decision on π is made with the assumption that the company is willing to invest the largest possible stock share resulting in a probability greater or equal to (1−α*) of being solvent at the end of the next year. In Denmark, as well as in the other EU countries, the capital requirement is connected to the liability side of the balance sheet. It consists of two elements: 4% of the policy reserves plus a small premium added to allow for the cost of hedging actuarial risks, approximated to be around 0.5% of the policy reserves. Therefore the relative buffer ratio should be at least 4.5%, i.e.
 $$ \frac{{B( \cdot )}}{{P( \cdot )}}\:\geq \:4.5\% . $$
As a result, it is reasonable to define the stock proportion as follows:
 $$\pi (t;A(t),P(t))\: = \:\mathop {{\rm{max}}}\limits_{0\:\leq \:\pi \:\leq \:100\% } \left\{ {Prob\left( {\frac{{B(t\: + \:1)}}{{P(t\: + \:1)}}\: \lt \:4.5\% \:|\:A(t),P(t)} \right)\: \lt \:{{\alpha }^\ast} } \right\},$$
where α* is a risk level corresponding to solvency requirement. Indeed, the proportion invested in stocks would be maximised so that the buffer exceeds the solvency capital requirements with probability (1−α*). We have chosen a risk level of α* = 0.1%, so that solvency at the end of the subsequent year has a 99.9% probability. More details can be found in the Appendix.
2.3 Stable long term buffer levels
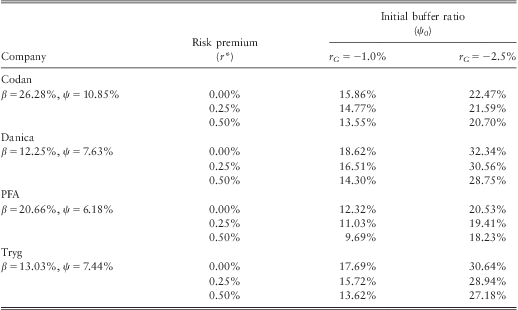
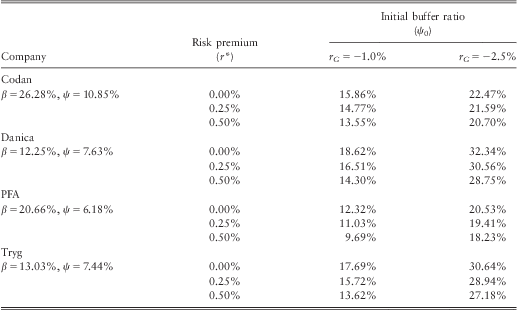
The stable long term buffer is higher than the target buffer. The reason follows from the relationship between the stock proportion function, the risk premium of stocks and the underlying guarantee. If the pensioner's interest guarantee contract starts at the target value, then on average the pensioner would in the long run have to contribute to raise the buffer from the target value to the stable value. Therefore, such a pensioner would indeed on average lose from this isolated effect. This argument would of course be reversed when the initial buffer value is above the long term stable value. At the current Danish market place most interest guarantee buffers are very low and we imagine that a current analysis of buffer values would lead to the overall conclusion that any pensioner entering the classical interest guarantee market would face a considerable loss from the effect of having to help raise buffer values to the stable level. We imagine that the recent financial credit crunch has left most developed economies in a similar situation as the Danish, with similar consequences for pensioners in such countries when entering the market place of classical interest guarantee products. For example, for the Codan strategy below with target buffer 10.85% we found through simulations that the long term stable value was 15.86% with a high guarantee level (and a resulting low average stock proportion) and 22.47% with a lower guarantee level (and a resulting higher average stock proportion). In our triple blow comparisons in the next sections we always start the pensioners contract in exactly the long term stable buffer implying that there will not be any long term effect of buffer accumulation in our calculations. In practice there will of course practically always be such a buffer accumulation effect, because either a pension contract is started above the long term stable value (implying an average advantage for the client) or below the long term stable value (implying an average loss for the client). As already indicated in the current financial climate the buffer accumulation probably gives any new client a considerable disadvantage and we could therefore with some right have subtitled this paper “The law of the quadruple blow” acknowledging this additional cause for concern for any young pensioner entering the current market. However, in the following, all analysis will not be confounded by the buffer effect and we start all our simulated contracts in the long term stable buffer value that we therefore also call the initial buffer value, see Table 1.
Initial buffer ratio
3 Performance measurement methodology
In this section we follow the performance measurement methodology of Guillén et al. (Reference Guillén, Nielsen, Pérez-Marín and Petersen2011).
We use the simulated developments of the policy interest rate to generate T = 60 years development of the individual savings of a policyholder having the guaranteed product. In Table 12 in the Appendix we also provide results for a contract with T = 30 years. As might be suspected the nominal values of the three blows are similar but smaller when T = 30 is considered instead of T = 60 years. We define the policyholder's payment stream ΔC(t) by the constant yearly premiums (c > 0) and annuities (−c < 0), i.e.
 $$ \Delta C(t)\: = \left\{ {\matrix{{c} & {t\: = \:0, \ldots, \cr T\:/\:2{\rm{ - }}1,} \cr {{\rm{ - }}c} & {t\: = \:T/2, \ldots, T{\rm{ - }}1.} \right $$
Then the policyholder's total savings YT develop as
 $$ \displaylines{ {{Y}_t}\: = \: & (1\: + \:{{r}_P}(t)){{Y}_{t{\rm{ - }}1}}\: + \:\Delta C(t), \cr {{Y}_0}\: = \: & \Delta C(0). \cr} $$
Calculating the final wealth YT for each of the simulated developments of the policy interest rate, we get an estimate of the empirical distribution of YT.
The performance measurement methodology is a tool which allows us to compare the products with different risks. To evaluate the considered products with the guarantee we search for an equivalent benchmark strategy to each of the products. An equivalent strategy to a given product means that the strategy has the same risk as the product. In particular, we have chosen to work with the expected shortfall as risk measure, which we denote by CTE(95%). The benchmark strategy is the trivial unit-linked strategy with a constant stock proportion π b for all t ∈ [0,T]. For technical details see Guillén et al. (Reference Guillén, Nielsen, Pérez-Marín and Petersen2011).
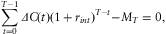
For both the with-profit product and its equivalent strategy, the internal interest rate (rint) is calculated, i.e.
 $$ \mathop{\sum}\limits_{t\: = \:0}^{T{\rm{ - }}1} \Delta C(t)(1\: + \:{{r}_{int}}{{)}^{T{\rm{ - }}t}} {\rm{ - }}{{M}_T}\: = \:0, $$
where MT is the median of the final wealth distribution, i.e. the distribution of YT. The difference between the benchmark's and product's internal interest rates,  $ r_{{int}}^{b} {\rm{ - }}r_{{int}}^{p} $, is called the yearly financial loss (if positive) or gain (if negative). The difference indicates whether or not the product beats its equivalent benchmark strategy.
The parameters that we have chosen in our simulations are as follows. We assume that the risk free rate is equal to 0. Such a baseline has also been chosen in Guillén et al. (Reference Guillén, Nielsen, Pérez-Marín and Petersen2011). The choice of the risk free rate does not affect the results. This has been investigated in Konicz (Reference Konicz2010). We have estimated the yearly excess stock return to be equal to μ = 3.42% and the volatility σ = 15.44%. See the Appendix for details on the parameters estimation.
As mentioned above, we choose the initial buffer  $ {{\psi }_0}\: = \:\frac{{{{B}_0}}}{{{{P}_0}}} $ to be equal to the long term stable buffer value. Let P 0 = 1, then B 0 = ψ 0P 0, and the company assets which have to be equal to the liabilities are defined by B 0 = P 0 + B 0. Notice that the choice of P 0 does not matter. It is a scaling factor in the bonus distribution mechanism.
We set the short rate of interest equal to zero because we are only interested in seeing the return that exceeds the risk-free rate. This obviously affects the choice of the guaranteed yearly interest rate. No company would offer a guaranteed interest rate that is higher than the risk-free rate. We fix the risk-free rate equal to zero and therefore rG must be some negative value, say rG = −2.5%, which means that the guaranteed rate will be 250 less basis points than the short risk-free rate. By looking at the difference between r and rG, we can immediately see how generous the company is by offering the given guarantee. Finally, regarding the risk premium r* in (1) we consider three possible values, 0.00%, 0.25% and 0.50%.
4 Quantifying the loss when paying for an interest guarantee
The quantification of the three blows does of course depend on the econometric model assumptions, the interest guarantee level and the risk measure. In this section we illustrate the calculation of the three blows. We give some sensitivity analyses illustrating how values vary with the assumptions made. Our approach is simple. The first blow is the lack of performance of the with-profit product itself when r* = 0.00%. The second and the third blows arise only when r* is positive. The second blow is simply defined as to be equal to r* To find the third blow we first calculate the total loss the pensioner faces from the interest guarantee product and we then subtract the first and the second blows. Therefore, by definition, the three blows aggregate to the total loss from the interest guarantee product compared to a simple benchmark product. We always assume that the with-profit return mechanism is initiated in the long term stable buffer. Therefore, we have not included the important extra risk for the individual pension saver that he might join the pension scheme at a buffer lower than the long term stable buffer. Our intuitive feeling would be that this is a very serious current risk for individuals joining now in an economic environment with extraordinary low buffers after our financial crisis.
4.1 Calculating the first, second and third blow
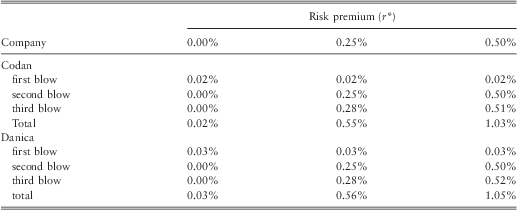
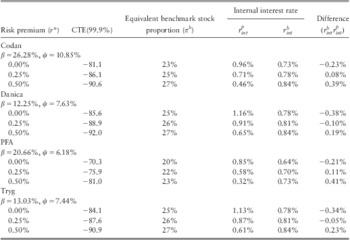
In Table 2 the three blows are calculated in respectively the Codan and the Danica with-profit scheme exemplified with a minus one percent interest guarantee (compared to the short rate) and expected shortfall at 95%. The first blow is the loss of the with-profit product compared to the equivalent trivial benchmark with r* = 0.00%. The second blow is given by r* equal to 0.00%, 0.25% or 0.50%. The third blow is calculated as the total loss compared to the trivial benchmark product minus the first and the second blows. The numbers in Table 2 are taken from Tables in the Appendix, where more complementary calculations are available (see Tables 6, 13 and 14 in the Appendix).
Calculating the blows. Parameters: CTE (95%), rG = −1.0%
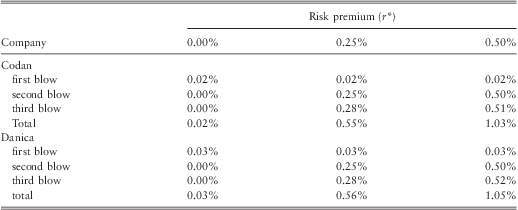
This is part of Table 13 in the Appendix
4.2 Understanding the first blow
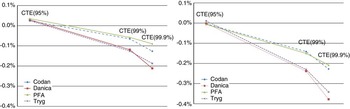
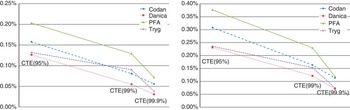
In Figure 1 we give a sensitivity analysis changing the level of the expected shortfall (see Tables 6 to 11 in the Appendix). We see that the first blow is negative for very high expected shortfall with magnitudes around −0.25% for the very high level of 99.9% indicating that the interest guarantee might be worth its cost (sometimes as low as −0.25%) for extraordinarily risk averse customers. Our point of view is, however, that a 99.9% risk level is inappropriate for the analysis at hand. There are many hidden risks in most with-profit schemes with guarantees. For example: Do you start your pension at a good initial buffer value? What credit risk is implied in the guarantee? Can you take the value of the interest guarantee with you when moving company? Does the non-transparency of the with-profit mechanism imply hidden costs? Are you unable to react if inflation kicks in?
(colour online) The first blow, when there is no risk premium, i.e. r* = 0.0%. The figure on the left shows the case for rG = −1.0%, and on the right for rG = −2.5%.

Parameters: CTE(95%), rG = −1.0%

Parameters: CTE(99%), rG = −1.0%

Parameters: CTE(99.9%), rG = −1.0%

Parameters: CTE(95%), rG = −2.5%

Parameters: CTE(99%), rG = −2.5%

Parameters: CTE(99.9%), rG = −2.5%

The case with a different payment process. Parameters: CTE(95%), rG = −2.5%
The entire contract varies over 30 years. The pension saver pays the contribution of 10 dkk for 20 years, thereafter receives the benefits of 20 dkk for the remaining 10 years.
All these underlying risks of the with-profit scheme with guarantees make expected shortfall levels of 99% and 99.9% inappropriately high in our view and we therefore prefer to use 95% as our benchmark expected shortfall in general.
4.3 Understanding the third blow
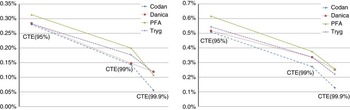
We also investigated the third blow as a function of the expected shortfall (see Figure 2). The third blow is very substantial at our preferred expected shortfall level of 95% but becomes less relevant for very high expected shortfall values (see also Figure 3 in the Appendix).
(colour online) The third blow for rG = −2.5%. The figure on the left shows the case for r* = 0.25%, and on the right for r* = 0.5%.

(colour online) The third blow for rG = −1.0%. The figure on the left shows the case for r* = 0.25%, and on the right for r* = 0.5%.

4.4 Comparing the with-profit products with the trivial benchmark strategy
We consider an individual entering the company when the buffer of the company is exactly on the long-term stable buffer target. Unfortunately, in the Danish market case in 2012 most commercial pension companies have initial buffers below this target and a new young customer entering the current Danish pension market through a with-profit interest guarantee scheme will be worse off than indicated by our results below.
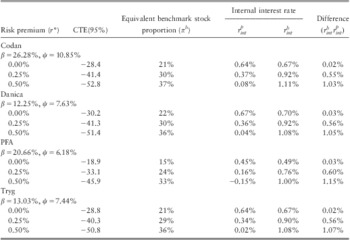
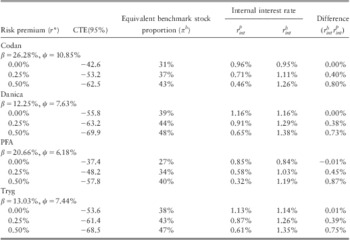
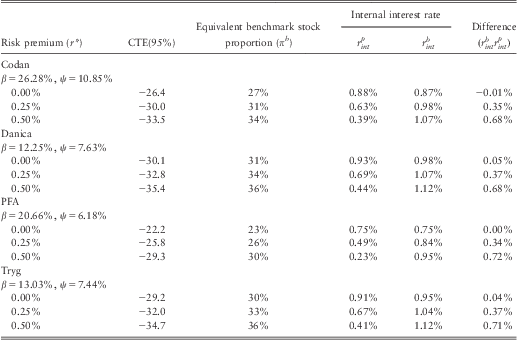
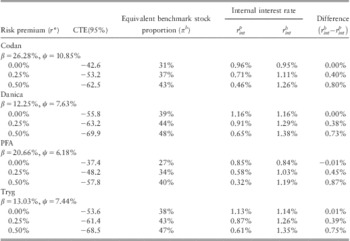
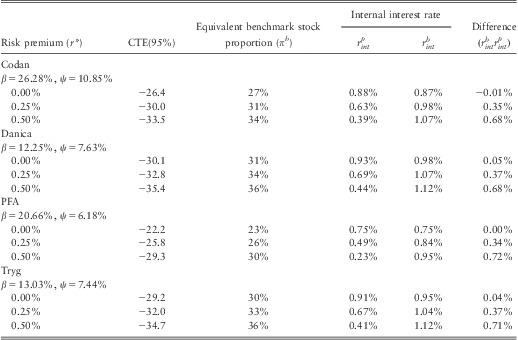
Table 3 presents the results of our simulation study. The first column shows the pension fund mechanism that is being simulated over a period of 60 years using 10,000 simulations. Three possibilities for the risk premium r* have been considered.
Comparison of the with-profit products and the trivial strategy
For each product with the guarantee the expected shortfall CTE(95%) is calculated. Thereafter, by finding π b the equivalent trivial strategy is determined. We compare all equivalent products by calculating the internal interest rates from the median of the final wealth. Parameters: r = 0%, rG = −2.5%, α* = 0.1%, μ = 3.42%, σ = 15.44%. The difference  $ r_{{int}}^{b} {\rm{ - }}r_{{int}}^{p} $ compares the performance of the considered products versus the equivalent trivial benchmark.
Every with-profit product in column one has been compared to the trivial strategy that has a fixed investment proportion in stocks and bonds over the whole length of the contract. The equivalent strategy, i.e. the proportion of wealth invested in stocks, is found as the one that would have exactly the same risk as the with-profit pension investment. The risk is measured as the CTE(95%) and it is shown in the second column of Table 3. The third column presents the corresponding proportion of investment in stocks. For instance, the first product, sold in Denmark by company Codan, has a risk equal to −42.6 units. Note that as monetary units are not relevant for our purposes, we just report this measure to show how the equivalent simple strategy is found. In the third column, we see that Codan's product with r* = 0% has the same risk as the trivial benchmark product with 31% as a fixed percentage invested in stocks (69% in bonds) over the whole life span period.
Columns four and five of Table 3 show the internal yearly interest rate calculated as in (5) for the pension fund product and for the equivalent strategy. For example, for Codan's product with r* = 0.5% we find that the internal yearly interest rate is 0.46% implying that, when considering the median of the final wealth distribution, this product has an internal interest rate that exceeds the yearly risk-free rate by 46 basis points. However, the equivalent trivial benchmark strategy with the same risk level obtains an excess yearly interest rate of 1.26% with respect to the risk-free rate implying a 0.80% loss for buying the expensive with-profit product compared to the trivial benchmark product. The difference between the internal yearly interest rates for each simulated product is found in column six of Table 3. The difference reported in column six means that, while having exactly the same risk, a customer would have a higher yearly internal interest rate if he or she would change from his or her market product to a simple strategy based on keeping a fixed proportion of wealth in stocks over the whole life span. The difference presented in column six indicates the yearly loss for having the with-profit scheme with guarantee assumed to be 250 basis points below the risk-free rate in this illustration.
The results shown in Table 3 indicate that all four versions of with-profit interest guarantee strategies lead to a financial loss of the customer. Note that when comparing results for r* = 0.25% and r* = 0.50% the loss in yearly interest rate reported in column six approximately doubles for all the funds considered here. On aggregate the total loss seems to be around 0.40% when r* = 0.25% and around 0.75% when r* = 0.50%.Footnote †
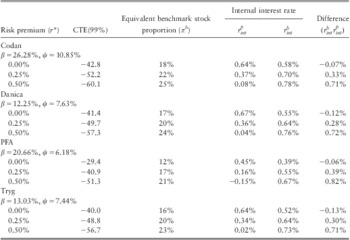
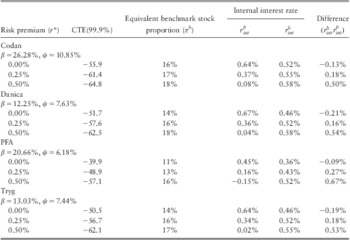
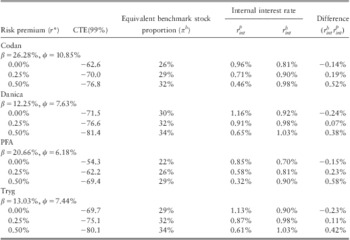
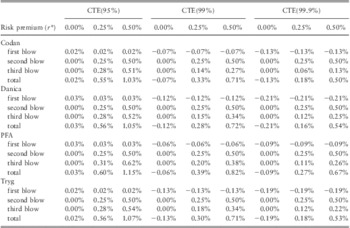
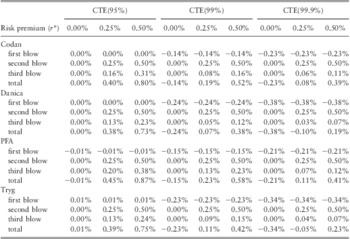
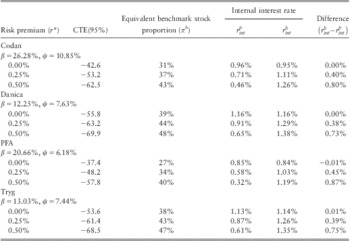
In the Appendix we have included more simulation studies and show the results by replicating Table 3 for various levels of the CTE and guaranteed rates, and also a case for a shorter contract (T = 30 years). Interestingly, we observe that the magnitude of the three blows is higher for the higher guaranteed interest rates, i.e. the difference between the product and the corresponding benchmark is bigger when the company offers their clients a higher guarantee rate, such as rG = −1.0%. For instance, for risk premium r* = 0.5%, under CTE(95%) risk measure and for a lower guaranteed rate rG = −2.5%, the first and third blow for a Codan product, are equal respectively 0.00% and 0.31%. For a higher rG = −1.0% these differences are bigger: 0.02% and 0.51%. See Tables 13 and 14 respectively.
Calculating the blows. Parameters: rG = −1.0%

Calculating the blows. Parameters: rG = −2.5%

5 Conclusion
We have modelled the performance of pension funds offering an interest guarantee that exist in the Danish market. We have shown that a customer who purchases a minimum interest guarantee has lower median returns compared to another customer that would have no interest guarantee, while having the same risk, measured as the expected shortfall at the 95% level. In our simulation study, we quantified the magnitude of that loss, which could be as big as 0.87% yearly in the rate of return.
The loss of returns is due to the mechanism behind with-profit pension products with a guaranteed interest rate. We have also identified the three components of that loss, which we call the three blows (the one coming from the with-profit mechanism itself, the risk premium and the opportunity cost). They have been calculated for different values of the guaranteed interest rate and for different levels of the expected shortfall.
We found that there are not important differences between the with-profit products, as they seem to underperform roughly equally to the corresponding benchmark strategy with the equivalent risk. We also observed that the magnitude of these three blows is higher for the higher guaranteed interest rates. Finally, the interest guarantee product might be worth its cost only for extraordinary risk averse customers, i.e. when we consider the expected shortfall at the 99.9% level, which is, from our point of view, an extreme risk aversion level for our analysis. Therefore, in the light of our Monte Carlo study results, we conclude that pension fund clients may perceive that minimum interest rate guarantees are too expensive, as an alternative product without an interest guarantee but having equivalent risk would provide higher median returns.
Acknowledgements
We thank the Editor and two anonymous referees for their valuable help. Guillén and Pérez-Marín were supported by the Spanish Ministry of Science FEDER ECO2010-21787-C03-01.
Investment strategy
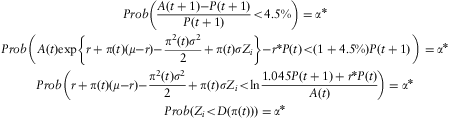
Investment strategy defined in equation (4) can be calculated explicitly using the fact the Brownian motion is normally N(0,1) distributed and that α* is reached by some π(t).
 $$ \matrix{ {Prob\left( \displaystyle{\frac{{A(t\: + \:1){\rm{ - }}P(t\: + \:1)}}{{P(t\: + \:1)}}\: \lt \:4.5\% } \right)\: = \:{{\alpha }^\ast} } \cr {Prob\left( \matrix {A(t){\rm exp}\left\{ {r\: + \:\pi (t)(\mu {\rm{ - }}r){\rm{ - }}\displaystyle\frac{{{{\pi }^2} (t){{\sigma }^2} }}{2}\: + \:\pi (t)\sigma {{Z}_i}} \right\}{\rm{ - }}{{r}^\ast} \\ P(t)\: \lt \:(1\: + \:4.5\% )P(t\: + \:1) }\cr \right)\: = \:{{\alpha }^\ast} } \cr {Prob\left( {r\: + \:\pi (t)(\mu {\rm{ - }}r){\rm{ - }}\displaystyle\frac{{{{\pi }^2} (t){{\sigma }^2} }}{2}\: + \:\pi (t)\sigma {{Z}_i}\: \lt \:{\rm ln}\displaystyle\frac{{1.045P(t\: + \:1)\: + \:{{r}^\ast} P(t)}}{{A(t)}}} \right)\: = \:{{\alpha }^\ast} } \cr {Prob({{Z}_i}\: \lt \:D(\pi (t)))\: = \:{{\alpha }^\ast} } $$
where
 $$ D(\pi (t))\: = \:\frac{{{\rm ln}(1.045P(t\: + \:1)\: + \:{{r}^\ast} P(t)){\rm{ - }}{\rm ln}A(t){\rm{ - }}r{\rm{ - }}\pi (t)(\mu {\rm{ - }}r)\: + \:\frac{{{{\pi }^2} (t){{\sigma }^2} }}{2}}}{{\pi (t)\sigma }}. $$
For a given degree of the solvency risk α*, we can read the value of D (π(t)) from the standard normal distribution table. Thereafter we can solve the above equation with respect to π(t):
 $${{ & {{\pi }^2} (t)\frac{{{{\sigma }^2} }}{2}{\rm{ - }}\pi (t)(\sigma D\: + \:\mu {\rm{ - }}r)\: + \:{\rm ln}(1.045P(t\: + \:1)\: + \:{{r}^\ast} P(t)){\rm{ - }}{\rm ln}A(t){\rm{ - }}r\: = \:0} \cr \pi {{(t)}}\: = \:\frac{{\sigma D\: + \:\mu {\rm{ - }}r\: \pm \:\sqrt {{{{(\sigma D\: + \:\mu {\rm{ - }}r)}}^2} {\rm{ - }}2{{\sigma }^2} ({\rm ln}(1.045P(t\: + \:1)\: + \:{{r}^\ast} P(t)){\rm{ - }}{\rm ln}A(t){\rm{ - }}r)} }}{{{{\sigma }^2} }}, \cr} $$
with a constraint
 $$ \pi \,(t)\, \in \,[0,100\% ]. $$
Note that by monotonicity of the probability function, definition (4) can be rewritten as
 $$ \pi (t;A(t),P(t))\: = \:\left\{ {\pi (t):Prob\left( {\frac{{B(t\: + \:1)}}{{P(t\: + \:1)}}\: = \:4.5\% \:|\:A(t),P(t)} \right)\: \lt \:{{\alpha }^\ast} } \right\} $$
hence π(t) obtained in (6) is indeed the maximum π.
In the case where the value under the square root is negative  $ {{(\sigma D\: + \:\mu {\rm{ - }}r)}^2}{\rm{ - }}2{{\sigma }^2}<$> <$>({\rm ln}(1.045P(t\: + \:1)\: + \:{{r}^\ast} P(t)){\rm{ - }}{\rm ln}A(t){\rm{ - }}r)\: \lt \:0 $, we set π (t) = 0. This means that the solvency requirement cannot be fulfilled – the relative buffer ratio is smaller than 4.5% with the probability higher than (1−α*). Investing only in bonds in this case is a natural decision here.
Parameters Estimation
To estimate parameter σ that we use in model (1) we refer to the data found in Dimson et al. (Reference Dimson, Marsh and Staunton2002) that provide an overview of the long-term performance of individual market for sixteen countries, and estimate total returns on equities, bonds, bills, currencies, inflation and risk premia for 101 years from 1900 to 2000. The authors also discuss what the future holds and what the expectations of the future returns might be.
The statistics are based on sixteen countries worldwide from the perspective of a US investor. It is assumed that the worldwide return would have been received by a US citizen who bought foreign currency at the start of the period, invested it in the foreign market throughout the period, liquidated his position, and converted the proceeds back at the end of the period into US dollars. At the beginning of each period the investor buys a portfolio of sixteen such positions in each of the countries, weighting each country by its size.
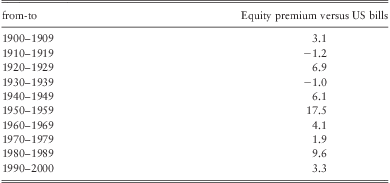
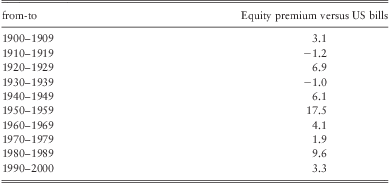
For the purpose of the paper, where we assume risk free rate r to be fixed, the natural choice of data will be the risk premia relative to US bills (risk free rate is taken as the return on US treasury bills) because we will not have a volatility coming from the risk free rate. In Tables 4 and 5 we present this part of the data that is relevant for us.
World equity risk premia over various periods, 1900–2000. Annualised real returns. Source: Dimson et al. (Reference Dimson, Marsh and Staunton2002).
World equity risk premia. A summary table based on the entire 101 years. Source: Dimson et al. (Reference Dimson, Marsh and Staunton2002).

We want to estimate the parameter σ based on historical volatility. Since we are provided only with expected excess returns over the periods of 1,2,…,10 decades, we cannot use the standard method to estimate historical volatility. In this situation we have to find another estimation method.
From Table 5 we see that the standard deviation of annual excess returns on the entire 101 years (SD) is υ = 16.4% and the arithmetic mean m is equal to 6.2%
 $$ E\left[ {\frac{{\Delta {{S}_t}}}{{{{S}_t}}}} \right]\: = \:m\; \; Var\left[ {\frac{{\Delta {{S}_t}}}{{{{S}_t}}}} \right]\: = \:{{\upsilon }^2} . $$
At the same time we assume that the stock prices are lognormally distributed which means that the change in ln S is normally distributed with variance
 $$ Var\left[ {{\rm ln}\frac{{{{S}_{t\: + \:1}}}}{{{{S}_t}}}} \right]\: = \:{{\sigma }^2} . $$
Hence our aim is to estimate the volatility parameter σ given (m,υ) = (6.2%, 16.4%).
Denote  $ {\epsilon}\: = \:\frac{{{{S}_{t\: + \:1}}{\rm{ - }}{{S}_t}}}{{{{S}_t}}} $, then
 $$ {\rm ln}\frac{{{{S}_{t\: + \:1}}}}{{{{S}_t}}}\: = \:{\rm ln}\left( {1\: + \:\frac{{{{S}_{t\: + \:1}}{\rm{ - }}{{S}_t}}}{{{{S}_t}}}} \right)\: = \:{\rm ln}(1\: + \:{\epsilon})\: = \::f({\epsilon}). $$
Function  $ f({\epsilon}) $ is sufficiently differentiable, so we can approximate the moments using Taylor expansions. The second moment is given by
 $$ Var\,[\,f({\epsilon}))]\: \approx \:{{(f^{\prime}(E[{\epsilon}]))}^2} Var[{\epsilon}], $$
which in our case gives
 $$ Var[{\rm ln}(1\: + \:{\epsilon})]\: \approx \:\frac{{{{\upsilon }^2} }}{{{{{(1\: + \:m)}}^2} }}, $$
which leads to
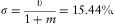 $$ \sigma \: = \:\frac{\upsilon }{{1\: + \:m}}\: = \:15.44\% . $$
To estimate the future excess stock return μ−r we cannot use historical data only. We let the expected excess log return  $ \hat{m}\: = \:2.23\% $ implying μ = 3.42%, since r = 0 and
 $ \hat{m}\: = \:\mu {\rm{ - }}{{\sigma }^2} \:/\:2 $. The excess stock return - or equity premium - of the United States have historically been between 4% and 9% depending on the estimation period and estimation method, Constantinides (Reference Constantinides2002) and Dimson et al. (Reference Dimson, Marsh and Staunton2002). The latter authors argue that this high level of excess stock return can not be expected in the future. We have therefore decided to follow Jørgensen & Nielsen (Reference Jørgensen and Nielsen2002) and select an equity premium on the safe side.