INTRODUCTION
The long-term history and susceptibility of the Atlantic coastal forest of southern Brazil to climate change is largely unknown, though the area is recognized as both a conservation and biodiversity hot spot (Myers et al., Reference Myers, Mittermeier, Mittermeier, da Fonseca and Kent2000). Few paleoecological studies are available from southern Brazil’s coastal highlands and the nearby lowlands. A pollen record from Volta Velha, located in the northern lowlands of Santa Catarina State (Behling and Negrelle, Reference Behling and Negrelle2001), documents replacement of tropical Atlantic lowland rain forests (ALRFs) by a mosaic of grassland and cold-adapted forests during the last glacial maximum (LGM). Tropical trees were almost completely absent during this period, shifting their spatial distribution at least 750 km farther north along the southern lowlands. This shift suggests that temperatures were likely to have been 3–7°C lower than today during the LGM. Only after approximately 14,400 cal yr BP did tropical rain forest develop in the southern lowlands (Behling, Reference Behling2002). However, mean air temperature amplitude estimates over the La Plata drainage basin for the period between the LGM and the early Holocene reached only 2.5°C, as suggested by lipid analyses of marine sediments (Chiessi et al., Reference Chiessi, Mulitza, Mollenhauer, Silva, Groeneveld and Prange2015). Such a disparity between marine and terrestrial temperature reconstructions is the norm for tropical systems and may reflect a buffered ocean system contrasted with terrestrial systems where nighttime extremes may shape vegetation (Bush and Silman, Reference Bush and Silman2004).
Studies from the southern Brazilian highlands, from the states of Paraná (Serra Campos Gerais: Behling, Reference Behling1997; Araçatuba: Behling, Reference Behling2007), Santa Catarina (Serra do Rio do Rasto, Morro da Igreja, Serra da Boa Vista: Behling, Reference Behling1993, Reference Behling1995; Serra do Tabuleiro [SDT]: Jeske-Pieruschka et al., Reference Jeske-Pieruschka, Pillar and Behling2013), and Rio Grande do Sul (e.g., Sao Francisco de Paula region: Behling et al., Reference Behling, Bauermann and Neves2001; Leonhardt and Lorscheitter, Reference Leonhardt and Lorscheitter2010; Jeske-Pieruschka and Behling, Reference Jeske-Pieruschka and Behling2012; Cambará do Sul region: Behling et al., Reference Behling, Pillar, Orlóci and Bauermann2004), suggested that extensive areas of campos (grassland) existed on these highlands through glacial times and into the early and mid-Holocene. The dominance of campos was attributed either to cold and dry Pleistocene climates or to warm and dry early Holocene ones. Dry seasons, lasting about 3 months, were characteristic of the early and mid-Holocene periods (Behling, Reference Behling1997, Reference Behling2002).
Araucaria forests began replacing campos by about 1000 cal yr BP in Santa Catarina State and by about 1400 cal yr BP in Paraná State (Serra Campos Gerais), reflecting a humid climate with no dry season. In the highlands of Rio Grande do Sul State, the high-resolution pollen data from the Cambará do Sul record indicate that the initial expansion of Araucaria forests had begun by 4320 cal yr BP, also showing a more pronounced expansion by 1100 cal yr BP (Behling et al., Reference Behling, Pillar, Orlóci and Bauermann2004). According to SDT data, the first expansion of the Araucaria forests began about 3200 cal yr BP, with migration from gallery forests along rivers, indicating a change to a somewhat wetter climate in the late Holocene.
Only one pollen record is published from the SDT area so far (Oliveira et al., Reference Oliveira, Porsani, Lima, Jeske-Pieruschka and Behling2012; Jeske-Pieruschka et al., Reference Jeske-Pieruschka, Pillar and Behling2013). This record, the “Ciama 2” core, was recovered from the central plateau of the SDT range at 840 m elevation, in a region that still supports remnant Araucaria forest. The Ciama 2 record documents environmental changes spanning the last 40,000 yr, but with relatively low temporal resolution. The record shows that campos had covered extensive areas of the highlands during the glacial period, reflecting cold and dry climatic conditions. At about 10,400 cal yr BP, the ALRF began to cover the steep slopes of the SDT range, accompanied by a retraction of the campos. The first development of Araucaria forest in the SDT highlands occurred during the late Holocene, after about 3600 cal yr BP, reflecting higher rainfall without dry seasons. The ALRF shows further expansion between 3850 and 1600 cal yr BP and between 320 and 160 cal yr BP (AD 1630 to 1790), implying partial replacement of campos by either Araucaria forest or ALRF. From this time onward, forest cover decreased, likely under pressure from human disturbance in the adjacent lowlands. There is no apparent evidence of fires during the glacial periods. However, fire events became common at the central SDT plateau, from ca. 10,400 until 3600 cal yr BP, probably caused by Amerindians.
Forest establishment during the mid- to late Holocene is interpreted to be associated with increased moisture. Comparison of the record with high-resolution oxygen and carbon stable isotope records from stalagmite calcite at the Botuverá Cave, located 80 km to the north of the Ciama 2 site, reveals that local temperature and water availability can be affected by the summer monsoonal precipitation and by an extratropical circulation pattern in winter (Cruz et al., Reference Cruz, Burns, Karmann, Sharp, Vuille, Cardoso, Ferrari, Silva Dias and Viana2005, Reference Cruz, Burns, Karmann, Sharp, Vuille and Ferrari2006). The negative δ13C and δ18O values in this speleothem record, indicating increased precipitation, are in agreement with the Ciama 2 pollen data, showing forest expansion during the mid-Holocene. From 3600 cal yr BP to the present, the ALRF continued to develop/expand, while the Araucaria forest began to develop about 2160 cal yr BP, reaching its maximum expansion after 300 cal yr BP (AD 1650).
The SDT site is found in a transitional area from tropical to subtropical forest, containing forests and grasslands, and is thus a key area for the study of past environmental changes based on pollen records free of human disturbance. As the study site is part of a nature reserve, this paleoecological study may also provide important information for conservation and management strategies associated with the Atlantic rain forest (ARF) biome. Knowledge of past climate variability is also of particular interest to the understanding of natural disasters, whose frequency seems to have increased since 2008 in Santa Catarina State, associated with increased rainfall anomalies, extreme floods, and subtropical cyclones (Herrmann, Reference Herrmann2014).
This article provides a high-resolution pollen record to support a detailed study on vegetation and climate changes at the eastern continental margin of tropical and subtropical South America, encompassing the late glacial period and the entire Holocene period. The available data enable us to address research questions that concern the use of continental records to explain detailed processes associated with previous global climate changes. First, because of a peculiar signal decoupling among taxa of the ARF biome, the study adds information about changes in temperature and precipitation that contributes to the few pollen data–based studies attempting to explain climate changes over continental southern South America, during the late glacial period and the Holocene. Second, considering some geomorphological and geographic traits of the SDT mountain range, we approach the eventual effects of shifts in sea-surface temperatures (SSTs) on the differential responses of ARF biome taxa to climate changes in lowlands and highlands. Finally, a comparison of the SDT data with pollen data from a mountain range in southeastern Brazil allows us to highlight changes in the main drivers of the climate system over southern and southeastern Brazil, during the events of abrupt climate changes that preceded the onset of the Holocene. Addressing these questions, the article stresses the influence of changes in temperature and in moisture availability on vegetation shifts in tropical and subtropical South American coastal highlands.
STUDY AREA
The site studied is located on an isolated mountain in the north of the SDT range in a protected state park in the southern ARF biome, the so-called Mata Atlantica, which includes tropical ALRFs, with cloud forests and subtropical Araucaria forests on the highlands. The site’s geomorphology and proximity to the Atlantic Ocean have an effect on rainfall amounts and distribution, as a strong local topographic rise (more than 1200 m over 10 km) induces orographic precipitation, and seasonal shifts of cold and warm coastal currents affect moisture of the rising air.
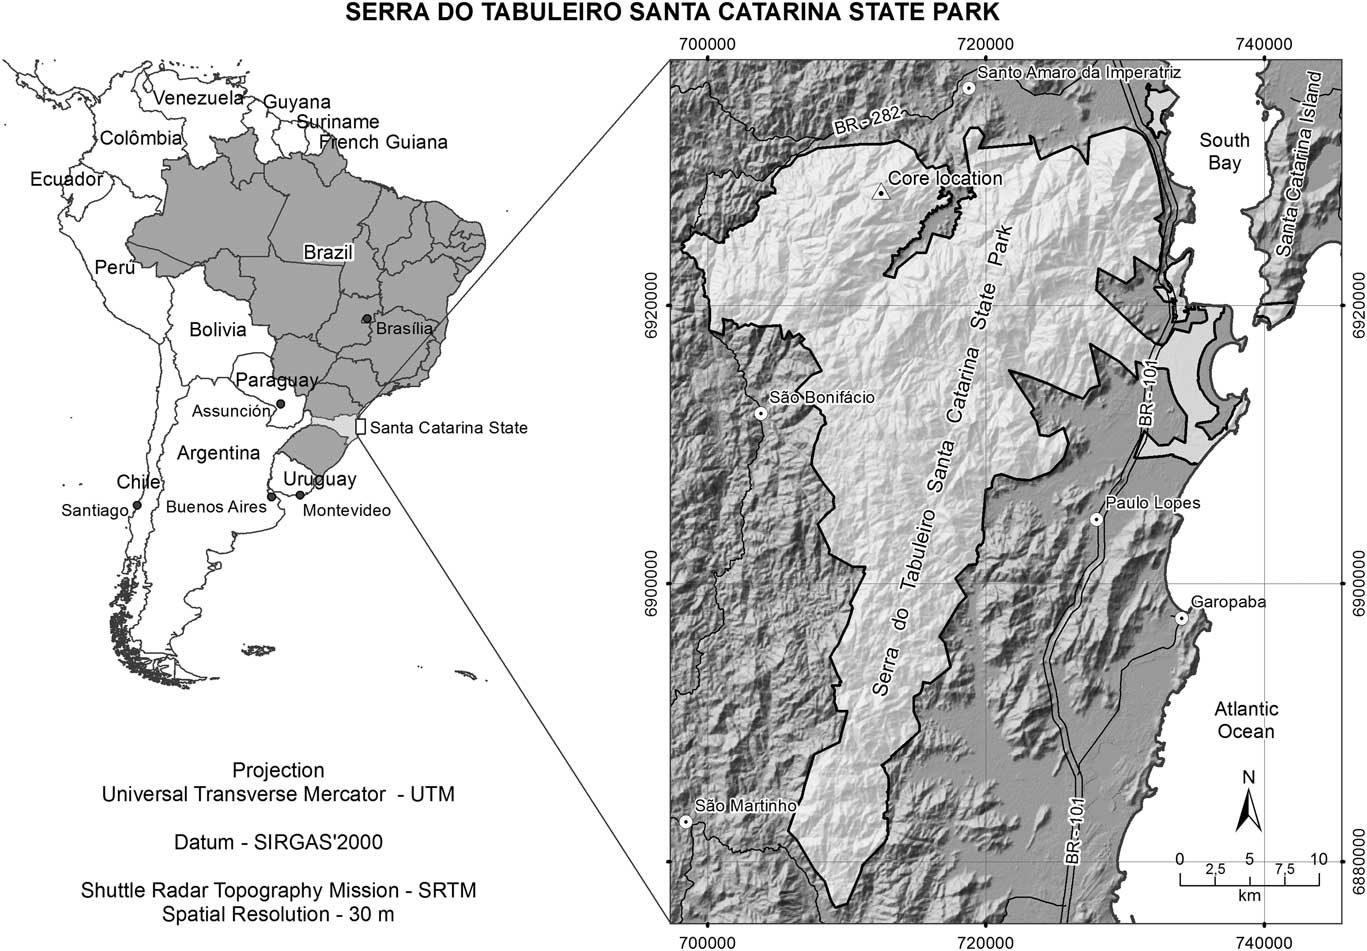
The study area is the northern SDT mountain range, at the eastern Atlantic border of Santa Catarina State, in southern Brazil (Fig. 1). The SDT range extends roughly south to north, with elevation varying from about 420 meters above sea level (m asl) in the south to about 1260 m in the north. The SDT range is part of a state park, which encompasses mountains and coastal lowlands. With 87,405 ha, the park is the largest protected area in Santa Catarina State (Oliveira et al., 2008). The coring site (27°45′S, 48°50′W) is located at 1240 m asl, ~30 km from the coast.
Study site location in the Serra do Tabuleiro range (point inside triangle), Santa Catarina State, southern Brazil. The light shade covers the park’s protected area borders.

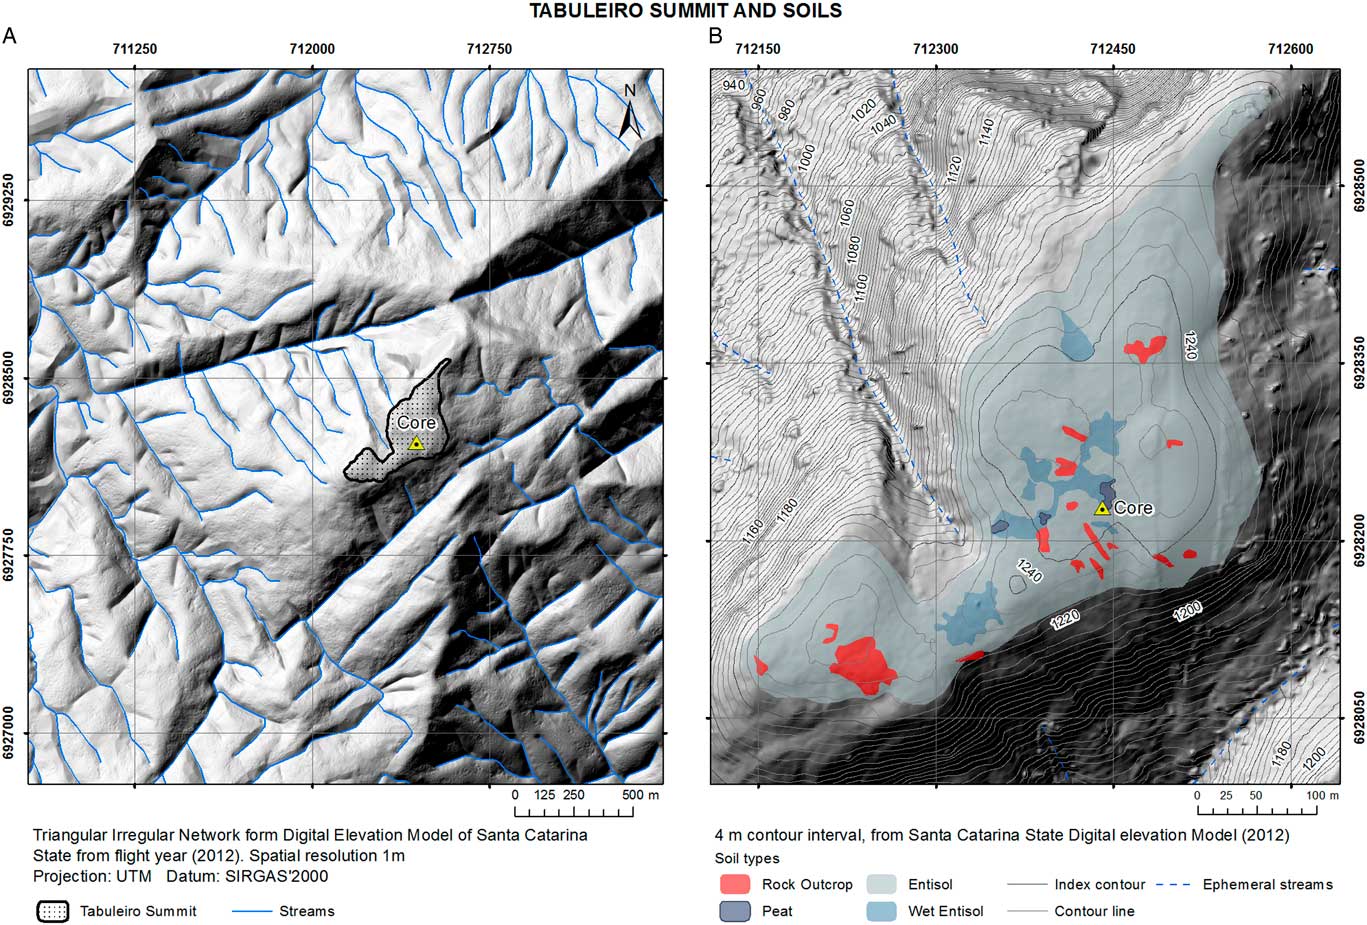
The sediment core was raised from a small peat bog at a location known as the “Tabuleiro summit,” in the northern portion of the range. This summit is part of an isolated portion of the SDT and gives the name to the entire range because of its special tabular morphology. In spite of its mesa-like topography when viewed from afar, the Tabuleiro summit is made up of differentially eroded and deeply fractured Neoproterozoic syenogranites and leucogranites. The sampled peat deposit lies in a 40 m2 topographic hollow, which forms one of the summit’s five valley heads that contribute to feeding fault-adapted streams, which run along deep incised gorges, surrounding the summit (Fig. 2A). A soil survey, carried out across the summit, indicates that waterlogged Entisols develop in topographic depressions at the summit’s highest elevations. These wet Entisols form a semipermanent shallow soil-water saturated zone, which sustains the few hollows where peaty deposits thicker than 60 cm develop (Fig. 2B).
(color online) Detailed study site location. (A) High-resolution digital terrain model of the isolated Tabuleiro summit and cored area. Note the deep fault-adapted valleys that surround the granitic summit. (B) Map of soils on the Tabuleiro summit and location of the core at the sampled bog. Note that all peat deposits are connected to a wet Entisol zone that develops at the broader summit area, where a flattened topography occurs. The soil survey was performed at the end of a prolonged dry winter season, in 2016.

The climate of the study area is mesothermic, without pronounced dry seasons, and is influenced by the South Atlantic anticyclone (SAA), which transfers heat and water vapor from the equatorial and tropical Atlantic Ocean regions to the continent. The influence of the SAA is weaker during the austral winter (June–August), increasing during the summer (December–February). The polar anticyclone (PA), which brings dry and cold air to the area, also influences the local regional climate during the winter. The PA forms over the Antarctic and moves across the South American continent, bringing strong precipitation associated with cold fronts, when cold and dry air masses slide under the tropical warm and humid air (Nimer, Reference Nimer1989; Hastenrath, Reference Hastenrath1991). Precipitation anomalies are mostly attributable to the El Niño–Southern Oscillation, which causes strong rainfall events in southern Brazil during its positive phase (Ratisbona, Reference Ratisbona1976; McGlone et al., Reference McGlone, Kershaw and Markgraf1992; Martin et al., Reference Martin, Fournier, Mourguiart, Siefeddine and Turcq1993). High or low precipitation in southern Brazil also depends, respectively, on periods of enhanced or weakened activity of the South Atlantic Convergence Zone (Garreaud et al., Reference Garreaud, Vuille, Compagnucci and Marengo2009) and on the South American summer monsoon (SASM) system (Wang et al., Reference Wang, Auler, Edwards, Cheng, Ito, Wang, Kong and Solheid2007). Interannual rainfall variability is also related to SST anomalies, with stronger or weaker precipitation, respectively, associated with warm or cold deviations of SST in the southwestern Atlantic Ocean (Díaz et al., Reference Díaz, Studzinski and Mechoso1998; Barros et al., Reference Barros, Gonzalez, Liebmann and Camilloni2000).
Rainfall is uniformly distributed throughout the year with average annual precipitation varying between 1600 and 1800 mm/yr. Average annual temperatures vary greatly according to topography: interior and coastal lowlands have higher average temperatures than the highlands, where temperatures below 0°C are common during the clear winter nights. Climate records from Florianópolis, for the lowlands, show mean temperatures of 24°C in January and 16°C in July (http://www.inmet.gov.br/sim/gera_graficos.php [accessed October 11, 2017]). As a result, moderate summers and cold winters are characteristic of the SDT highlands, whereas hotter and longer summers characterize the coastal area (attributable to subtropical latitudes) and the interior western region (attributable to lower altitudes and continentality).
The ARF biome (Mata Atlantica) of the study region in southern Brazil is characterized by a great diversity of tropical taxa (in the lowlands) and subtropical taxa (in the highlands). The ALRF, as part of the Mata Atlantica, occurs in southern Brazil in a 100- to 200-km-wide belt in the coastal lowlands near the border between the states of Santa Catarina and Rio Grande do Sul, and on the slopes of the coastal ranges and Serra dos Campos Gerais plateau scarps, at elevations up to about 1000 m. Some rain forest species extend their range into the valleys and to bordering mountain ranges and the Campos Gerais highland. The ALRF has a wide diversity of trees, shrubs, climbers, tree ferns, and epiphytes. The dominant trees are in the Euphorbiaceae (Alchornea), Arecaceae (Euterpe), Myrtaceae, Moraceae, Bignoniaceae, Lauraceae, and Sapotaceae families. The campos are mainly found on the southern Brazilian highlands, often forming a mosaic with the Araucaria forest. The subtropical Araucaria forest is composed of Araucaria angustifolia and is associated with various tree species on the upper slopes including Myrtaceae, Mimosa scabrella, Ocotea porosa, O. puberula, Lamanonia speciosa, Weinmannia pauliniaefolia, Drimys brasiliensis, Vernonia discolor, Piptocarpha angustifolia, Ilex spp., and Dicksonia sellowiana. Characteristic in the transitional zones between the Araucaria forest and the ALRF are Clethra scabra, Gomidesia sellowiana, Myrsine spp., Symplocos spp., Clusia criuva, Merostachys ternata, M. speciose, and Chusquea spp. Along the upper coastal mountains of the Serra Geral, a small zone of cloud forest expands, composed of medium to high trees and shrubs including Weinmannia humilis, Siphoneugena reitzii, Myrceugenia euosma, Drimys brasiliensis, Ilex microdonta, Berberis kleinii, and Gunnera manicata. Small patches of cloud forest and Araucaria forest are also found in the SDT range, but not at the isolated study site itself. Some small patches of campos, such as at the study site, are also found across the summits of the SDT range. Campos are rich in species of the Poaceae family, as well as Cyperaceae, Asteraceae, Apiaceae, Rubiaceae, and Fabaceae (Klein, Reference Klein1978, Reference Klein1981). Additional detailed information is available in the literature (e.g., Hueck, Reference Hueck1966; Klein Reference Klein1978, Reference Klein1981; Fundação Instituto Brasileiro de Geografia e Estatística [IBGE], 1993).
The peat bog we studied is located in a small area of campos surrounded by forest at the Tabuleiro summit. The local vegetation of the peat bog is a mosaic of different herbs, a few small shrubs, and Polytrichum moss patches. Because of the legal protection for the Serra do Tabuleiro State Park, disturbance associated with human activities is still very low at the sampled site, as access to the northern parts of the range is limited by the strong gradients between the deeply incised gorges and the summit area. Human activities had been more common in the central parts of the Serra do Tabuleiro State Park because of historic occupation before the area was protected (Jeske-Pieruschka et al., Reference Jeske-Pieruschka, Pillar and Behling2013).
MATERIAL AND METHODS
The peat deposit was cored at its deepest part using a Russian corer. The total length of the core was 110 cm. Sections of 50 cm in length were extruded on-site, wrapped in plastic and aluminum film, and stored under cool (4°C) and dark conditions after return from the field and before sampling.
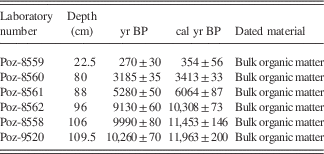
In total, six organic-rich bulk samples (1 cm thick) were taken for radiocarbon dating by accelerator mass spectrometry (AMS). Samples were dated at the Poznan Radiocarbon Laboratory in Poland. The derived age-depth model (Fig. 3) was used to guide intervals between subsamples taken for pollen analysis along the core.
For pollen analysis, 111 subsamples (0.5 cm3 each) were taken at 0.5 cm (70–110 cm), 1 cm (65–70 cm), and 2.5 cm (0–65 cm) intervals along the 110-cm-long core. All samples were processed with standard pollen analysis methods, using hydrofluoric acid and acetolysis (Faegri and Iversen, Reference Faegri and Iversen1989). To determine the pollen concentration (grains/cm3) and pollen accumulation rate (grains/cm2/yr), one tablet of exotic Lycopodium clavatum spores was added to each sample. The pollen and spores are generally well preserved. A minimum of 300 pollen grains were counted for each sample. The pollen sum includes trees, shrubs, and herbs and excludes aquatic taxa, fern and moss spores, and colonies of the algae Botryococcus. The pollen and spore identification relied on the first author’s own reference collection (containing about 3000 Brazilian species) and pollen morphological descriptions in Behling (Reference Behling1993). Pollen and spore data are presented in pollen diagrams as percentages of the pollen sum.
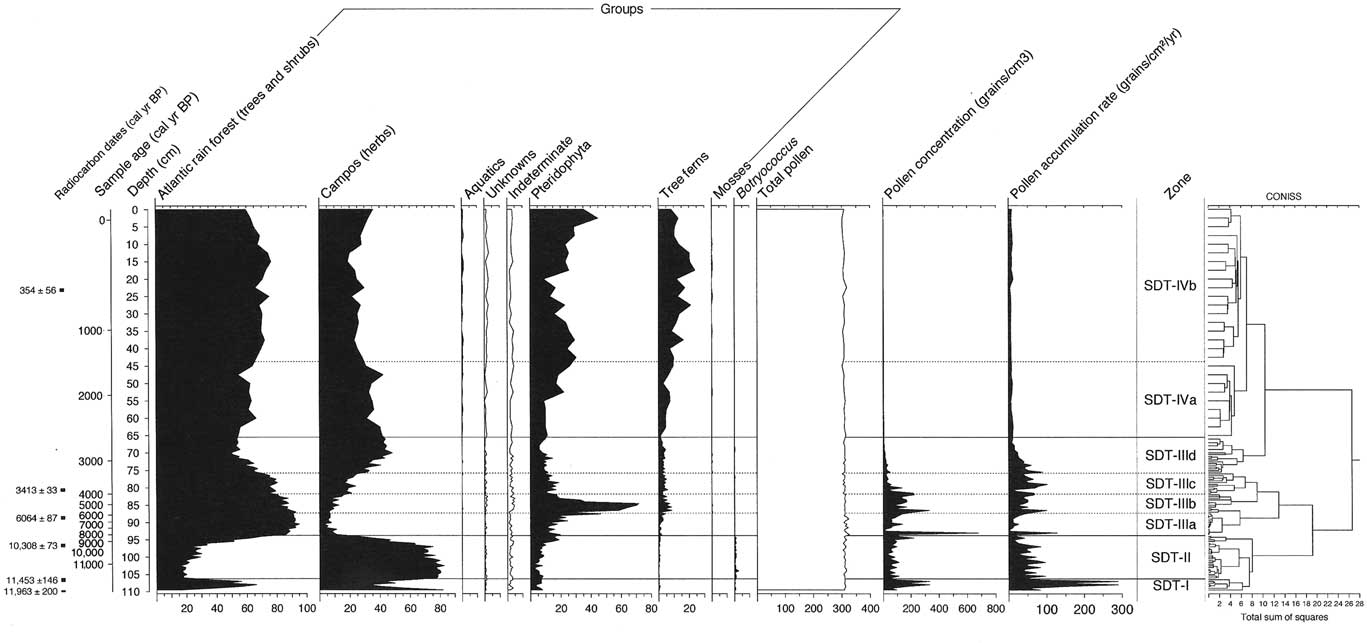
The software TILIA, TILIAGRAPH, and CONISS were used for illustration of the pollen and spore data, calculations, and cluster analysis (Grimm, Reference Grimm1987). The pollen diagrams include individual records of the most abundant pollen and spore taxa (Fig. 4) and records of the following groups: ARF biome (trees and shrubs), campos (herbs), aquatic, Pteridophyta, tree ferns, and mosses, as well as concentration and accumulation rate of pollen and a cluster analysis dendrogram (Fig. 5). The grouping is based on vegetation surveys in southern Brazil (e.g., Hueck, Reference Hueck1966; Klein Reference Klein1978, Reference Klein1981; IBGE, 1993). The zonation of the pollen record is based on changes in the pollen assemblages and CONISS analysis.
A detailed location map for the Tabuleiro summit was made based on 1:1000 aerial images from the Photogrammetric Survey of Santa Catarina State (Secretaria de Estado de Desenvolvimento Sustentável), in which DEM vectorization attains 1 m of spatial resolution. A slope model was obtained by the digital elevation model (DEM) through ArcGIS 10.
RESULTS
Core stratigraphy
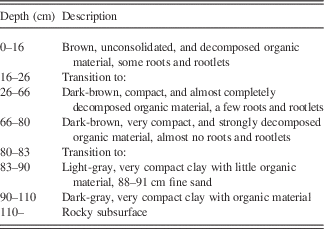
The 110-cm-long core from the SDT sits on weathered products of the local granites and is composed of mostly dark-brown or black organic material (peat) that is compact and strongly decomposed. The sampled deposit is the deepest, among the patches of peat preserved on the Tabuleiro summit (Fig. 2B). A detailed description of the core is given in Table 1.
Stratigraphy of the Serra do Tabuleiro core.

Radiocarbon dates
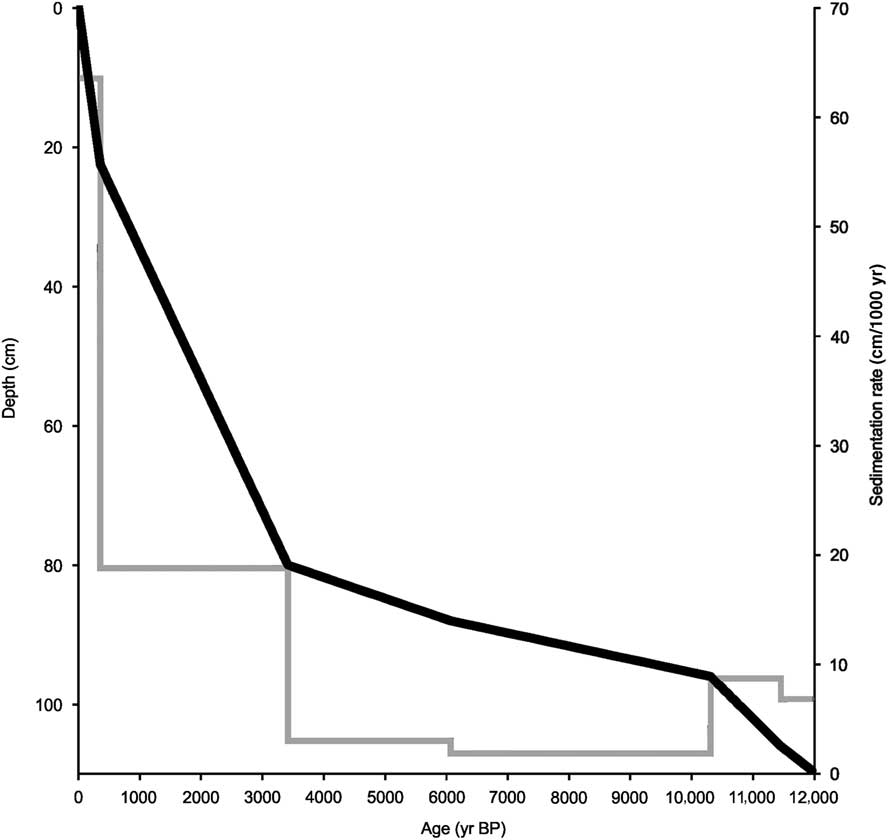
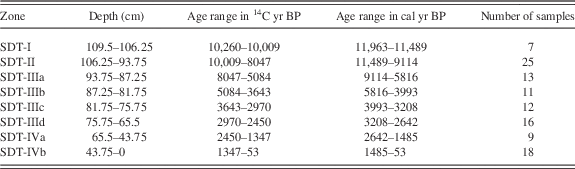
Six AMS radiocarbon dates provide chronological control for the SDT pollen record, indicating that the deposit is from the late glacial and Holocene age (Table 2). The radiocarbon dates were calibrated based on CalPal (Weninger et al., Reference Weninger, Jöris and Danzeglocke2004). The dated base of the core at 109.5 cm has an age of 10,260 ± 70 14C yr BP, which is calibrated to 11,963±200 cal yr BP. The radiocarbon dates indicate that the sedimentation was continuous and without any recognizable interruptions. Based on the radiocarbon dates, the age range has been calculated for each pollen zone (Table 3). The sedimentation rate is low in the lower part of the core, below a depth of 80 cm, and relatively high in the upper part, because of the lesser degree of decomposition of the peat material (Fig. 3). The age-depth model does not allow for identifying any gap along the record. The occurrence of a few single Pinus pollen grains (not shown in the diagram) was observed, beginning at a depth of 5 cm (40 cal yr BP, AD 1910), indicating that the uppermost samples are historic in age, as pine was introduced into southern Brazil about 150 yr ago (Behling, Reference Behling2007).
Age-depth model for the Serra do Tabuleiro record, including the sedimentation rate. Note that higher rates of sedimentation occur around the Pleistocene/Holocene transition and during the late Holocene, scoring 8.7 cm/1000 yr and 18.8 cm/1000 yr, respectively. The highest rate of sedimentation occurs after about 354 cal yr BP, reaching 63.6 cm/1000 yr.

List of AMS radiocarbon dates of samples of the Serra do Tabuleiro core.

Pollen zones of the Serra do Tabuleiro (SDT) core, showing depth, calculated radiocarbon age and the number of pollen samples of each pollen zone.

Description of the pollen data
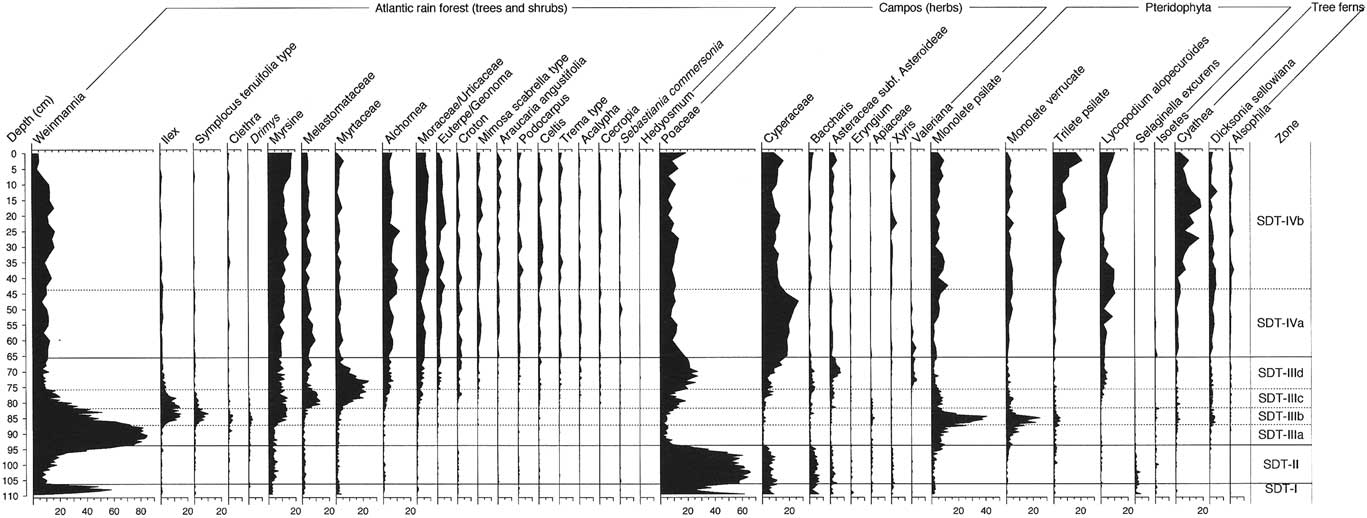
The pollen assemblages of the 111 counted samples are diverse. The pollen diagram displays the most frequent pollen and spore taxa of the 160 different types identified (Figs. 4 and 5). Seventeen pollen and spore types remain unknown. According to major changes in pollen assemblages and the CONISS analysis, eight local pollen zones with subzones (SDT-I; SDT-II; SDT-IIIa, b, c, d; and SDT-IVa, b) were established (Table 3). The pollen concentration and pollen accumulation rates are relatively high in the lower core section (zone SDT-I to SDT-III), but low in the upper core section (zone SDT-IV).
Pollen percentage diagram of the frequent and most important taxa of the Serra do Tabuleiro (SDT) core (1243 m altitude), grouped into Atlantic rain forest, campos, aquatics, Pteridophyta, tree ferns, and mosses.

Summary pollen diagram of the Serra do Tabuleiro (SDT) core, showing the calibrated accelerator mass spectrometry radiocarbon dates, age scale, stratigraphy, ecological groups, pollen sum, pollen concentration and accumulation records, pollen zones, and the cluster analysis dendrogram.

The SDT pollen record is characterized throughout by relatively high amounts of ARF taxa (trees and shrubs) and a substantial presence of campos taxa (herbs) (Figs. 4 and 5). These arboreal and nonarboreal pollen groups show several fluctuations within the record. Aquatic taxa are rare or absent. Fern spores, divided between Pteridophyta and tree ferns, are frequent with some changes in frequency and composition. Moss spores are very rare in the record.
The pollen zone SDT-I (11,960–11,490 cal yr BP) is characterized by a marked increase of ARF pollen, represented primarily by Weinmannia (up to 58%), whereas other ARF taxa are rare or absent. Weinmannia pollen increases 6% in the lowermost sample to as much as 58% in the middle part of the zone. Among the campos taxa, fewer Poaceae pollen grains are found, which reach 25% of the total. Pteridophyta and tree fern spores are relatively rare.
Zone SDT-II (11,490–9110 cal yr BP) is marked by low quantities of ARF pollen, similar to the lowermost sample from zone SDT-I, because of the strong decrease in Weinmannia (to about 10%). A few single pollen grains of Araucaria angustifolia occur in this zone. Campos pollen is less frequent, almost entirely represented by Poaceae (60–65%). There is a slight increase of Weinmannia, whereas Poaceae pollen decreases toward the end of the zone. Colonies of the algae Botryococcus are rare throughout the record, but the highest values occur in this zone.
Subzone SDT-IIIa (9110–5820 cal yr BP) is characterized by very high values of Weinmannia (80–85%). Other ARF taxa remain low, similar to the previous zones. Campos pollen is present at low percentages, in particular Poaceae (about 5%), but also Cyperaceae, Asteraceae subf. Asterioideae, and Baccharis. Pteridophyta spores have markedly higher values (about 15–20%) after the end of subzone SDT-II, in particular for monolete psilate and verrucate spores.
In subzone SDT-IIIb (5820–3990 cal yr BP), pollen of Weinmannia decreases, whereas pollen of some ARF taxa increases strongly, including Ilex, Symplocos tenuifolia type, and Myrsine. Pollen of Ilex, Symplocos tenuifolia type, and Clethra and Drimys have the highest values in this subzone. Campos taxa generally continue to have low values, as in the previous subzone. Spores of Pteridophyta have their maximal values (up to 75%) in this subzone, in particular monolete psilate and verrucate spores, as well as other taxa. Tree fern spores (about 5%) such as Cyathea, Dicksonia sellowiana, and Alsophila are frequent from this subzone upward.
Subzone SDT-IIIc (3990–3210 cal yr BP) is marked by the continuous decrease of ARF taxa such as Weinmannia, Ilex, and Symplocos tenuifolia type to the end of the subzone, whereas Melastomataceae, Alchornea, Moraceae/Urticaceae, and other taxa increase markedly, in particular Myrtaceae pollen. Clethra and Drimys have low values throughout the remainder of the record, whereas Myrsine values remain high. Campos pollen increases, mostly with the higher representation of Poaceae, Cyperaceae, Asteraceae subf. Asterioideae, and Baccharis. Pteridophyta spores decrease slightly, and spores of tree ferns remain stable.
In subzone SDT-IIId (3210–2640 cal yr BP) ARF taxa such as Weinmannia, Ilex, and Symplocos tenuifolia type are present in relatively low amounts, whereas Myrsine, Melastomataceae, Alchornea, Moraceae/Urticaceae, Euterpe/Geonoma, Croton, and many other taxa are well represented. Myrtaceae pollen decreases markedly, reaching relatively low values. Campos pollen continuously increases during this zone. Values of Valeriana pollen are most frequent during this period and at the beginning of the next subzone. Pteridophyta spores decrease slightly, whereas Lycopodium alopecuroides becomes frequent since this subzone.
Subzones SDT-IVa (2640–1490 cal yr BP) and SDT-IVb (1490–53 cal yr BP) reflect the relatively stable frequency of most taxa. The sum of the ARF pollen, as well as the sum of Pteridophyta and tree fern spores, in particular Cyathea, is somewhat lower in subzone SDT-IVa than in SDT-IVb. Campos pollen sums are opposite, in particular because of higher values of Cyperaceae pollen. Alchornea, Moraceae/Urticaceae, Euterpe/Geonoma, and several other taxa, which are common in subzone SDT-Iva, become more frequent in zone SDT-IVb. Araucaria angustifolia, Podocarpus, and Sebastiana commersoniana pollen are more frequent in zone SDT-IV. A first and single Zea mays pollen grain (not shown in the diagram) is found at 20 cm core depth (260 cal yr BP). The first single Pinus pollen grain (not shown in the diagram) occurs above 5 cm core depth (40 cal yr BP).
INTERPRETATION AND DISCUSSION
During the late glacial–Holocene transition (11,960–11,490 cal yr BP), campos rich in Poaceae, Cyperaceae, and Asteraceae covered the upper part of the northern Tabuleiro mountain range. ALRF, mainly represented by Weinmannia, Myrsine, Melastomataceae, and Myrtaceae, occurred in the lower elevations of the mountain range. This distribution is also documented from the record of the central plateau of the SDT range, whose record spans the last 40,000 yr (Oliveira et al., Reference Oliveira, Porsani, Lima, Jeske-Pieruschka and Behling2012; Jeske-Pieruschka et al., Reference Jeske-Pieruschka, Pillar and Behling2013). Between 11,960 and 11,490 cal yr BP, a marked expansion of the pioneer taxa Weinmannia occurs in the Tabuleiro summit record (1243 m asl), facing the subtropical Atlantic Ocean (27°S). Other, presumably less sensitive, ALRF taxa do not show any significant increase during this short warming event of about 470 yr at the end of the Younger Dryas (YD) chronozone. Besides occurring next to the coring site, Weinmannia is also a primarily dioecious genus that produces high quantities of pollen (Barnes, Reference Barnes1999).
Weinmannia, in particular Weinmannia humilis, is a pioneering tree member of the cloud forest, which marks an altitudinal transition between the ALRF on the upper Atlantic–facing slopes and the highland campos (Cuatrecasas and Smith, Reference Cuatrecasas and Smith1971; Klein, 1981). As suggested by its name, cloud forest vegetation evolves when air masses rise, forming clouds and orographic precipitation dictated by topography. Because of the interacting roles of wind speed, downwind drift of raindrops, and slope gradients, the highest precipitation usually tends to concentrate downwind of the highest slope, which in mountain ranges coincides with locations upwind of the crest of the range (Roe, Reference Roe2005). As a result, a population expansion of Weinmannia decoupled from other ALRF taxa about the end of the YD. This response can be explained as an effect of locally lifted air masses that were probably not humid enough to distribute precipitation over the lower elevations of the SDT range, concentrating rainfall only at higher elevations, where the cloud forests lie. This brief early dominance of Weinmannia development is not observed in the Ciama 2 record, at the SDT’s central plateau, 16 km farther south, where percentages of Weinmannia show important increases only after about 4000 cal yr BP. The cause for this difference between the two SDT records is probably because of the location of the Ciama 2 site, which is farther inland in the central part and not on the Atlantic-facing slopes.
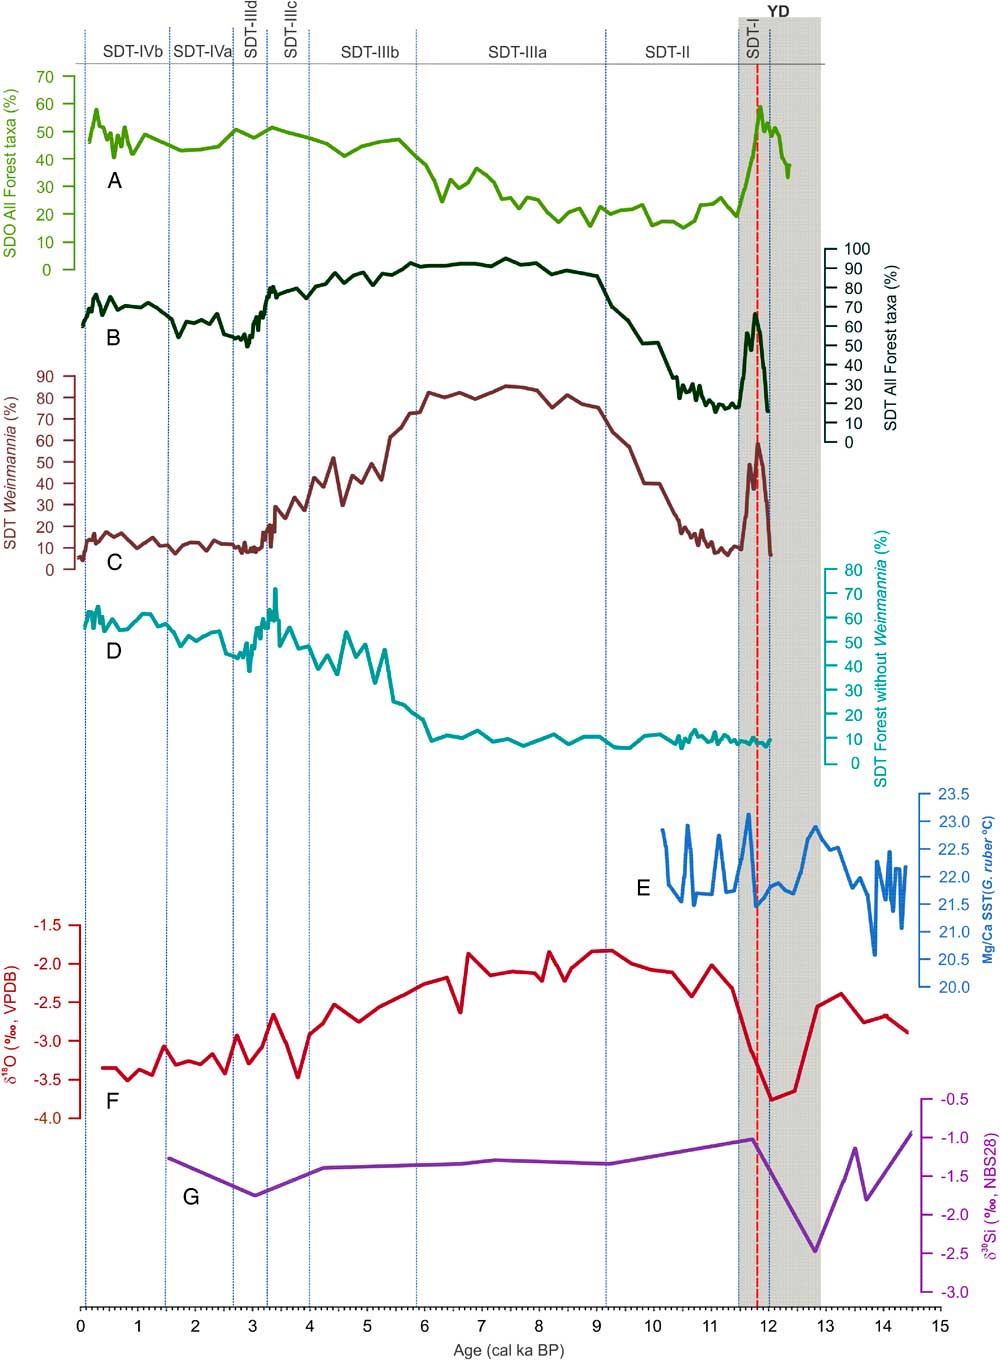
Continental pollen records from southern and southeastern Brazil rarely document the rapid shifts associated with the YD chronozone, probably because of the low resolution of continental records common to this period. Because the YD is an important global climatic event associated with abrupt climate changes, comparison of the SDT’s high-resolution record with other marine and continental records enables discussion within broader regional and paleoclimatic contexts (Fig. 6).
Millennial-scale variability of Serra dos Órgãos (SDO) and Serra do Tabuleiro (SDT) pollen records compared with some proxy records for southern Brazil and southeastern South America. (A) SDO pollen series for all Atlantic rain forest (ARF) taxa (after Behling and Safford, Reference Behling and Safford2010). (B) SDT pollen series for all ARF taxa. (C) SDT cloud forest Weinmannia pollen series. (D) SDT ARF taxa pollen series, with Weinmannia excluded from it. (E) Southeastern South America Termination 1, GeoB6211-2, Globigerinoides ruber, Mg/Ca-based sea-surface temperatures (SSTs; °C) (Chiessi et al., Reference Chiessi, Mulitza, Mollenhauer, Silva, Groeneveld and Prange2015). (F) Botuverá Cave, Brazil, 90 ka stalagmite stable isotope data (δ18O, ppm, Vienna Pee Dee belemnite [VPDB]) (Wang et al., Reference Wang, Auler, Edwards, Cheng, Ito, Wang, Kong and Solheid2007). (G) South Atlantic, GeoB2107-3, 30 ka silicon isotope data (ppm, NBS28) (after Hendry et al., Reference Hendry, Robinson, Meredith, Mulitza, Chiessi and Arz2012). Notes: the strong influence of Weinmannia amounts over the ARF pollen distribution, prior to about 6000 cal yr BP (B, C, and D); duration of the Younger Dryas (YD) event (gray shaded area); and late glacial SDT Weinmannia spike and associated events in other time series (dashed red line). Division of the time series (light-blue vertical dashed lines) follows SDT pollen zones and subzones. (For interpretation of the references to color in this figure legend, the reader is referred to the web version of this article.)

A short warm and humid phase, which coincides with the end of the YD/beginning of the Holocene, is also present in the pollen record of the Serra dos Órgãos (SDO), which is also part of the coastal mountain range known as the Serra do Mar, farther north, in Rio de Janeiro State (22°S). At the SDO site, all ARF biome taxa increased during the YD warming, between 12,310 and 11,810 cal yr BP, presenting at the time a forest composition that was similar to that of the late Holocene rain forest (Behling and Safford, Reference Behling and Safford2010). This warming event in SDO, spanning about 500 yr, began earlier than the 470-yr-long event in SDT and was apparently much stronger, given that all of the ARF taxa reacted (Fig. 6A).
Because of the close vicinity of the SDT and SDO to the southern Atlantic Ocean, we suggest that SSTs may have had a strong influence on the climate of these coastal mountain areas. The higher SSTs might have been related to a reduction in the cross-equatorial heat transport at that time (Rühlemann et al., Reference Rühlemann, Mulitza, Müller, Wefer and Zahn1999). The fact that the vegetation signal was much weaker in the SDT in southern Brazil than in the SDO in southeastern Brazil might be attributed to the continuing strong influence of the Antarctic cold fronts in southern Brazil, during the late glacial period. This might be caused either by a reduction of the Atlantic meridional overturning circulation strength (Shakun et al., Reference Shakun, Clark, He, Marcott, Mix, Liu, Schmittner and Bard2012; Chiessi et al., Reference Chiessi, Mulitza, Mollenhauer, Silva, Groeneveld and Prange2015) or by a cooling in the South Atlantic in association with Antarctic meltwater pulses during the YD (Chiessi et al., Reference Chiessi, Mulitza, Mollenhauer, Silva, Groeneveld and Prange2015).
Independent data support SST changes in southern Brazil during the YD. The marine core GeoB2107-3 (27.18°S, 46.45°W), off southern Brazil, depicts abrupt changes in ocean and atmospheric circulation during the YD (Fig. 6G). The core documents changes in availability of nutrients to diatoms, as revealed by the supply of silicic acid (Hendry et al., Reference Hendry, Robinson, Meredith, Mulitza, Chiessi and Arz2012). The authors suggest that pulses in availability of this nutrient are caused by changes in the intermediate water formation, associated with shifts in the subpolar hydrologic cycle. SST estimates based on Mg/Ca ratios for Globigerinoides ruber foraminifera tests in the marine sediment core GeoB6211-2 (located at 32.51°S, 50.24°W) indicate a period of SST cooling during the YD, between 12,900 and 11,700 cal yr BP (Chiessi et al., Reference Chiessi, Mulitza, Mollenhauer, Silva, Groeneveld and Prange2015; Fig. 6E). The GeoB6211-2 data set also records a short interval of an SST increase (~1.7°C), between 11,760 cal yr BP and 11,500 cal yr BP, which coincides almost exactly with the timing of the SDT Weinmannia expansion in our pollen record (Fig. 6B and C). This coincidence suggests that the spike in the Weinmannia increase in the SDT data occurred during a short period of SST increase at the end of the YD. This short event is followed by more than a thousand years of a lower SST, which is punctuated by short spikes of temperature increase during the early Holocene (Fig. 6E). As a result, cold Atlantic Ocean water and the associated relatively drier atmosphere likely prevented the response of most ARF taxa to the YD warming at the SDT site in southern Brazil, contrary to what occurred at the SDO site in southeastern Brazil.
Because of the proximity between the Atlantic-facing slopes at the SDT and SDO sites to the Atlantic Ocean, ~30 km and 56 km, respectively, changes of SST in the South Atlantic might have had a strong influence on precipitation at both the SDO and SDT coastal ranges. SSTs off the coast of southeastern South America are currently controlled by the location of the Brazil Malvinas Confluence, where the warm Brazil Current (BC) and the cold Malvinas Current (MC) converge (Razik et al., 2013). The SST is also controlled by the northward flow of the highly energetic Brazilian Coastal Current (BCC), which reaches about 25°S each year, during the austral winter (Souza and Robinson, Reference Souza and Robinson2004), 300 km to the north of the SDT, off the coast of Paraná State. SST changes during the YD/Holocene transition may explain the differences between the SDT and SDO pollen records. The YD SST change could be caused by late glacial short-term strengthening of the PA and weakening of the SAA and associated trade winds, decreasing the oceanic anticyclonic gyre that forms the BC at its western boundary. A weakened BC would allow strengthening of the cold MC, together with a more frequent northern extension of BCC cold waters off the SDT site, making the lower atmosphere colder and drier. This would explain the selective expansion of Weinmannia at the SDT site, dictated by orographic lift of a relatively drier atmosphere. The same process would redirect atmospheric moisture and increased precipitation toward the southeastern Brazil coast off the SDO site, where precipitation would tend to be distributed more evenly along this mountain range, affecting lower altitudes and favoring the expansion of Weinmannia, together with other ALRF taxa. It is interesting to note the increase of Weinmannia and other taxa close to the late glacial–Holocene transition in the pollen record from Colônia near the city of São Paulo in southeastern Brazil (Ledru et al., Reference Ledru, Mourguiart and Riccomini2009). However, it is difficult to compare this record with ours because of the relatively low resolution in the Colônia record for this time period.
The stalagmite δ18O isotope record from the Botuverá Cave, located about 65 km northwest of the Tabuleiro summit, indicates a negative isotopic phase, coinciding in duration with the entire YD (Cruz et al., Reference Cruz, Burns, Karmann, Sharp, Vuille, Cardoso, Ferrari, Silva Dias and Viana2005, Reference Cruz, Vuille, Burns, Wang, Cheng, Werner, Edwards, Karmann, Auler and Nguyen2009; Wang et al., Reference Wang, Auler, Edwards, Cheng, Ito, Wang, Kong and Solheid2007; Fig. 6F). This finding shows that abrupt shifts of southern Brazilian atmospheric circulation occurred during the last deglaciation, which were primarily driven by variations in summer insolation (Wang et al., Reference Wang, Auler, Edwards, Cheng, Ito, Wang, Kong and Solheid2007). The δ18O negative phase in the Botuverá record is interpreted as being the result of isotopically depleted moisture, which originated over the Amazon basin, being carried to southern Brazil by a southward displacement of the SASM. However, these negative δ18O values do not imply high precipitation during the YD warming period but are associated with isotopically depleted water vapor, which primarily reflects the relative contribution of monsoonal rainfall versus extratropical rainfall (Cruz et al., Reference Cruz, Burns, Jercinovic, Karmann, Sharp and Vuille2007). The SDT pollen record suggests that late glacial precipitation patterns were probably influenced by more frequent northward migrations of extratropical cyclones associated with cold fronts, resulting in less pronounced (or poorly spatially distributed) rainfall, although isotopically depleted, across the study area.
For the early Holocene, the SDT pollen record indicates a marked reduction of Weinmannia in the upper SDT elevations. The strong decline of Weinmannia indicates the onset of unusually cool and dry conditions during the early Holocene between 11,490 and 10,300 cal yr BP. So far, this event had never been recorded or observed in any other record from southern Brazil. The explanation for this cold climatic condition also suggests a strong influence of the Antarctic cold fronts in southern Brazil. Cold water from the BCC along the coast may allow atmospheric Antarctic cold fronts to penetrate farther northward, maintaining relatively lower temperatures and dry air. Indeed, Figure 6E suggests that SSTs during the period were characterized by multicentennial-long pulses of cooling water off the coast of southeastern South America. Increased dryness associated with these cooler phases that last about 200 to 500 years would preclude development of all other ARF taxa at the SDT range, also explaining the strong decrease of Weinmannia during the period.
The early to late Holocene (9110–2640 cal yr BP) is marked by four distinct vegetation phases. Initially, from 9110 to 5820 cal yr BP, Weinmannia dominated again and became even more abundant than during the earlier expansion phase, replacing most of the campos area. Other AFR taxa were still rare at the study site (Fig. 6D), and different ferns became more frequent for the first time, with the exception of tree ferns (Fig. 4). This vegetation reflects a very warm and relatively wet period, but probably with a strong seasonality, as suggested by the low occurrence of tree ferns. During the second period from 5820 to 3990 cal yr BP, Weinmannia became continuously less frequent because of the expansion of first Myrsine, followed by Drimys and Clethra, and by a maximum of Symplocos (tenuifolia type) and Ilex, as well as by a very strong expansion of ferns. Tree ferns became more frequent for the first time (Fig. 4). These changes reflect a warm and very wet phase, with probably a shorter dry season. This period exhibits opposite trends as ALRF taxa increase in importance and Weinmannia representation falls to near-modern levels. Indeed, by the end of this period ALRF taxa attain their modern composition in the SDT range (Fig. 6C and D). In the third period, from 3990 to 3210 cal yr BP, Drimys, Clethra, Symplocos, and Ilex became less frequent as taxa indicative of warmer and drier settings (e.g., Melastomataceae, Alchornea, and Moraceae/Urticaceae) increased in abundance. Ferns were less frequent, and the campos expanded, indicating warm but slightly drier conditions, with a seasonal climate. The chronology of this event in the SDT record coincides with global climate shifts that are understood to formally define the transition between the early and the mid-Holocene, at about 4000 to 4200 cal yr BP. This trend to drier conditions in our record coincides, for instance, with shifts to drier climatic regimes in tropical and subtropical Africa and South America, about 4000 cal yr BP (Walker et al., Reference Walker, Berkelhammer, Björck, Cwynar, Fisher, Long, Lowe, Newnham, Rasmussen and Weiss2012). In the fourth phase, between 3210 and 2640 cal yr BP, Myrtaceae decreased continuously, while Alchornea, Moraceae/Urticaceae, Euterpe/Geonoma, Croton, and many other ALRF taxa became established near the study site. The campos expanded slightly, suggesting warm but slightly cooler conditions with a seasonal climate.
During the late Holocene (2640 cal yr BP to present day), the ALRF became well established with an abundance of ferns and tree ferns, although small areas of campos surrounded the bog studied here. This relatively late establishment of the modern ARF biome is a regional characteristic and has been documented in several other records from southern Brazil (e.g., Behling, Reference Behling1995, Reference Behling1997; Behling et al., Reference Behling, Pillar, Orlóci and Bauermann2004). These vegetational changes reflect somewhat cooler and wetter conditions, with a decreasing seasonality. After 1490 cal yr BP, the increased frequency of ferns and particularly tree ferns (Cyathea) around 1000 cal yr BP reflects permanently wet conditions with no dry seasons. This change to permanently wet conditions is similar to other pollen records from the southern Brazilian highlands (e.g., Behling et al., Reference Behling, Pillar, Orlóci and Bauermann2004).
Human activities that may have changed the original forest composition are only evident in the lower elevations of the SDT after 260 cal yr BP, with the first single Zea mays pollen grain. After 40 cal yr BP, the first occurrence of a single exotic Pinus pollen grain indicates the introduction of exotic pine in the area, as is also documented in other records from southern Brazil (e.g., Jeske-Pieruschka and Behling, Reference Jeske-Pieruschka and Behling2012).
Interestingly, the SDT core preserved the record of a first marked expansion of both Symplocos (tenuifolia type) and Ilex during the late glacial period (see Fig. 4), before ALRF taxa expanded along the coastal Atlantic lowlands of Santa Catarina State, from the north to the south (Behling and Negrelle, Reference Behling and Negrelle2001). Therefore, both Symplocos and Ilex can be seen as important taxa associated with the early establishment of the ARF. The SDT record suggests that taxa from the cloud forest seem to be particularly sensitive to climatic changes driven by small shifts in temperature and precipitation. As a result, cloud forest taxa seem to be potentially fragile to ongoing impacts of global climate change on the ARF biome (Foster, Reference Foster2001).
CONCLUSIONS
The pollen record from the SDT summit provides a detailed high-resolution analysis of vegetation and climate changes for the last 11,960 cal yr BP. The paleoecological study encompasses the transition from the late glacial period to the Holocene and highlights the signal of important paleoclimatic events, such as the YD chronozone and global shifts that are understood to formally define the boundary between the early and the mid-Holocene.
The record depicts for the first time in southern Brazil a distinctive population expansion of Weinmannia, a member of the cloud forest, as its pollen frequency decoupled from other ALRF taxa in the SDT. This decoupled signal occurs in the YD and extends into the early and mid-Holocene.
During the YD warming in the Southern Hemisphere, the singular response of Weinmannia suggests that precipitation was limited to the highest elevations of the SDT range, affecting exclusively the cloud forests, under the influence of orographic lifting of relatively dry air masses, associated with lower SSTs off the coast of the SDT range. This warming event was weaker in southern Brazil than in the coastal mountain range of southeastern Brazil, suggesting that SSTs may have had a stronger influence on the climate of these coastal mountain areas than farther to the north. During the early Holocene between 11,490 and 10,300 cal yr BP, an unusual cool and dry climate is also documented for the first time in southern Brazil pollen records, associated with a strong decrease in Weinmannia and still rare occurrences of other ALRF taxa.
The relatively cool and dry conditions suggested by the SDT pollen record for the YD and early Holocene do not contradict the strong paleoclimatic evidence derived from the isotopic record of the Botuverá speleothem. Our interpretation is supported by SST data off the coast of Santa Catarina State and southeastern South America and focuses on the local influence of lower SSTs on the SDT record, stressing that precipitation was probably more influenced by extratropical cyclones during the period, resulting in reduced rainfall across the mountain range.
Because of the strong response of cloud forest Weinmannia to the apparently subtle climatic changes in the SDT during the YD and early Holocene, we emphasize the sensitivity of cloud forest taxa to natural and anthropogenic global climate and environmental changes.
ACKNOWLEDGMENTS
Part of the fieldwork expenses and radiocarbon dating were financially supported by the Fundação de Apoio à Pesquisa Científica e Tecnológica do Estado de Santa Catarina (FAPESC; Grant CON08857/2007-9). Complementary fieldwork, GPS/GIS location, and detailed maps were supported by the Conselho Nacional de Desenvolvimento Científico e Tecnológico (CNPq; Grant 459779/2014-1) and by the Sistema Nacional de Pesquisas em Biodiversidade (SISBIOTA Brasil; CNPq: Grant 563307/2010-2 and FAPESC: Grant 1193/2011). We also thank Jeffrey Hoff for improving the English of the manuscript.