Introduction
Bananas and plantains (Musa spp.) are produced in more than 120 tropical and subtropical countries, mainly by small-scale farmers (Pestana et al., Reference Pestana, Amorim, Ferreira, Amorim, Oliveira, Ledo and Silva2011). Musa is the fourth most important food commodity in the world (after rice, wheat and maize), providing a vital source of carbohydrates, fibre, minerals and vitamins (Miller et al., Reference Miller, Passos, Menezes, Souza, Costa, Azevedo, Amorim, Pappas and Ciampi2010; Christelová et al., Reference Christelová, Valárik, Hribová, De Langhe and Doležel2011). Musa has a primary centre of domestication in South-East Asia, and has travelled to Africa through human migrations (De Langhe et al., Reference De Langhe, Pillay, Tenkouano and Swennen2005, Reference De Langhe, Hribová, Carpentier, Doležel and Swennen2010; Blench, Reference Blench2009).
In the Democratic Republic of Congo (DRC), Musa constitutes the third staple food after Manihot esculenta Crantz and Zea mays L., but second after cassava in eastern DRC (Mobambo and Naku, Reference Mobambo and Naku1993; Nzawele et al., Reference Nzawele, Rweyemamu and Maerere2009). The population of DRC is about 60 millions, of which 30% grow and integrate bananas in various farming and livestock production systems (Nzawele et al., Reference Nzawele, Blomme, Dheda, Rweyemam, Velly, Vigheri, Milango, Eden-Green, Karamura and Maerere2010). In contrast, Tanzania has an annual production between 750,000 and 820,000 tonnes, ranking second in East Africa after Uganda. Musa constitutes the major staple food for 15–20% of the Tanzanian population (Msogoya et al., Reference Msogoya, Maerere, Kusolwa and Nsemwa2006; Maerere et al., 2010a).
For plantains, the secondary centre of diversity is in America and Africa, particularly in the areas of Yangambi in the rainforest basin of DRC (Mobambo et al., Reference Mobambo, Staver, Hauser, Dheda and Vangu2010); where De Langhe (Reference De Langhe1961) initially described 56 cultivars which did not exist in West Africa and elsewhere. De Langhe (Reference De Langhe1961) studied DRC's Musa using classical taxonomy (inflorescence and plant size) which showed no correlation with Musa diversity in the world (Stover and Simmonds, Reference Stover and Simmonds1991). The reason being that two characters do not generate genetic variability, unlike numerical taxonomy using life-cycle characters as reliable phenetic markers. Following De Langhe (Reference De Langhe1961), information on the Research Institute (INERA-Mulungu) Musa genebank was provided by Sebasigari (Reference Sebasigari, Persley and De Langhe1987) who partially classified the diversity into beer, boiling, flour and sweet bananas. To date, no research on DRC's Musa has been reported using numerical taxonomy. Conversely, several studies have been conducted on Tanzania's Musa (Stover and Simmonds, Reference Stover and Simmonds1991; Evers, Reference Evers1992; De Langhe et al., 2001).
Musa belong to the family Musaceae of the order Zingiberales. Most of the cultivated bananas are diploid (AA and AB) or triploid (AAA, AAB and ABB) originated from intra- and interspecific hybridizations between seed-bearing Musa acuminata (A genome) and Musa balbisiana (B genome) (Simmonds and Shepherd, Reference Simmonds and Shepherd1955). The AAB group is subdivided into subgroups (Plantains, Mysore, Silk or Pome) through subjective classification using easily observable characters (De Langhe and Valmayor, Reference De Langhe and Valmayor1980; Swennen and Vuylsteke, Reference Swennen, Vuylsteke, Persley and De Langhe1987; Swennen, Reference Swennen and Jarret1990). Plantains are likewise subdivided into three clone sets (French, False Horn and Horn; Tezenas Du Montcel et al., Reference Tezenas Du Montcel, De Langhe and Swennen1983). AAA-Lujugira-Mutika is coined as a subgroup diversified through somaclonal mutation and similarly subdivided into five clone sets (Beer/Mbidde, Nakabululu, Musakala, Nakitembe and Nfuuka) (Karamura, 1999). This study aimed at determining the genomic groups, subgroups and clone sets of banana accessions kept in the INERA-Mulungu genebank and their correlation with known banana accessions in Tanzania. This correlation will allow the integration of DRC materials into the world's Musa diversity through reliable numerical taxonomic methods.
Materials and methods
The eastern DRC Musa spp. genebank was established in 1961 at the National Institute for Agronomic Study in the Belgian Congo (Institut National pour l'Etude Agronomique au Congo Belge) and maintained up to date at the National Agriculture Research Institute, Centre of Mulungu (INERA-M). The Musa spp. genebank at the INERA-M is located at 02°20′167″S and 028°47′541″E at 1686 m above sea level (masl) on a fertile soil described as volcanic soil by Pecrot (Reference Pecrot1958). The mean annual rainfall is around 1600 mm with a year-long growing season. There is currently no meteorological facility at the INERA-M apart from a rain gauge. The 1961 report shows that the mean temperature around the collection was 19°C, whereas the report of World (2012) shows, currently, a slight increase in the mean temperature of 19.7°C.
The Tanzania Musa spp. genebank was established in 2002 at the Horticulture Unit of Sokoine University of Agriculture (SUA) located in the plateau zone of Morogoro Urban District. The site is located between 06°50′ and 06°45′S, 37°35′ and 37°40′E and at 500 masl and experiences annual temperatures of 16–34°C (Maerere et al., 2010b). Rainfall distribution is bimodal with short rains between October and December followed by a dry spell starting from January to February. A long rainy season is between March and May while the dry season is from June to late October. According to Mtengeti (2008), the soil is kaolinitic well-drained clay. Due to climate change, the annual rainfall has decreased from an average of 2000 to 800 mm (Msogoya et al., Reference Msogoya, Grout, Maerere, Batamuzi, Gimbi, Max, Nombo and Msoffe2010).
Forty-one accessions in the INERA-M genebank subdivided into beer (08), boiling (12), flour (08) and sweet (13) bananas were used in this study. The 13 sweet banana accessions were ‘Cibwalo/Prata’, ‘Kamaramasengi/Kamelamasengi’, ‘Dwarf Cavendish’, ‘Bakurura/Kigurube’, ‘Lakatan(i)’, ‘Americani’, ‘Chindege/Naine de chine’, ‘Poyo’, ‘Cavendish B’ (of Butuza), ‘Chisukari’, ‘Chisukari red’, ‘Nyakitembe’ and ‘Gros Michel’. The eight flour banana accessions were ‘Isangi’, ‘Chibulanana I’ (one hand), ‘Chibulanana II’ (two hands), ‘Chibulanana III’ (three hands), ‘Chibulanana VI’ (six hands), ‘Walungu 16’, ‘FHIA 03’ and ‘Nyaluvu’. The 12 boiling banana accessions were ‘Kagera masisi’, ‘Mbwazirume I’, ‘Ingagara’, ‘Inyamico’, ‘Incakara/Barhabesha’, ‘Igisahira’, ‘Muhuna binyoko’, ‘Inzirabushera’, ‘Inconnu INERA’ (with yellow male bud), ‘Muhorogo’, ‘Nyakitengwa’ and ‘Inyoya’. The eight beer banana accessions were ‘Yangambi Km5’, ‘Nsinabuhaka’, ‘Ndundu’, ‘Munyamimba’, ‘Nshikazi’, ‘Intokatoke’, ‘Impysi’ and ‘Intembe’.
In the Tanzania genebank (SUA), there were 18 accessions characteristically divided into dessert (eight), roasting/cooking (seven), beer (one) and East African Highland cooking (two) bananas, which were used in this study. The seven accessions used as dessert included ‘Yangambi Km5’ (AAA-Ibota), ‘Kisukari’ (AAB-Silk), ‘Kimalindi-fupi’ (AAA-Dwarf Cavendish), ‘Mtwike’ (AAA-Cavendish), ‘Kimalindi-ndefu’ (AAA-Giant Cavendish), ‘Jamaica’ (AAA-Gros Michel), ‘FHIA 17’ and ‘FHIA 23’ (AAAA) (Stover and Simmonds, Reference Stover and Simmonds1991; Maerere et al., 2010b). The seven accessions used as roasting/cooking were ‘Ngego I’, ‘Ngego Halisi’, ‘Mzuzu’ (AAB-French Plantain), ‘Unyoya’ (ABB-Pisang Awak), ‘Bokoboko’ (ABB-Bluggoe), ‘Mwajunjila’ (with yellow male bud) and ‘Mshale malembo’ (AA-Pisang lilin) (Evers, Reference Evers1992). The two AAA-EAHB cooking accessions were ‘Embwailuma’ and ‘Bukoba’. The beer accession was ‘Muhowe’ belonging to AAA-EAHB (Stover and Simmonds, Reference Stover and Simmonds1991; Evers, Reference Evers1992; Maerere et al., 2010b).
These Musa accessions were assigned to genomic groups, subgroups and clone sets from a scoring method and subjective classification based on quickly observable characters determined by Simmonds and Shepherd (Reference Simmonds and Shepherd1955), De Langhe and Valmayor (Reference De Langhe and Valmayor1980), Swennen and Vuylsteke (Reference Swennen, Vuylsteke, Persley and De Langhe1987), Tezenas Du Montcel et al. (Reference Tezenas Du Montcel, De Langhe and Swennen1983) and Karamura (1999) which are accepted worldwide. The numerical morpho-taxonomic characterization used 99 characters (Table S1, available online only at http://journals.cambridge.org) described by IPGRI (1996). The 99 characters encompassed the 15 for genomic group determination devised by Simmonds and Shepherd (Reference Simmonds and Shepherd1955). Musa characterization was done in the INERA-M genebank (Eastern DRC) from 16 January 2008 to 20 January 2009. Similarly, the Tanzania's Musa characterization for the purpose of their relatedness to those of eastern DRC was done from June to July 2008 and from July to November 2010. Two qualitative character states, green cigar or red purple cigar, were coded as binary, i.e. by scoring 1 for green cigar and 2 for red purple cigar. Ordered multistate characters were coded as a series of discrete attributes. Low intensities of a character were given lower scores so that the scores would increase with increasing intensity of the character. Non-ordered characters standing on their own, i.e. without an intensity level, were coded as a series of discrete states according to IPGRI (1996). Missing data were coded 999 as recommended by Rohlf (1993, cited by Karamura (1999)).
The product-moment correlation and distance coefficients were used to assess similarity among the banana accessions. The genetic similarity matrices were then used to construct the dendrogram (phenogram) with the single-linkage, complete-linkage and unweighted pair group method with arithmetic mean (UPGMA) algorithms, employing the sequential, agglomerative, hierarchical and nested design clustering procedure (Sneath and Sokal, Reference Sneath and Sokal1973). Cophenetic correlation (coefficients) and principal component analysis (PCA) including the percentage trace and discriminant analyses were conducted using the NT-SYS package (version 2.1) according to Opara et al. (Reference Opara, Jacobson and Al-saady2010).
Results
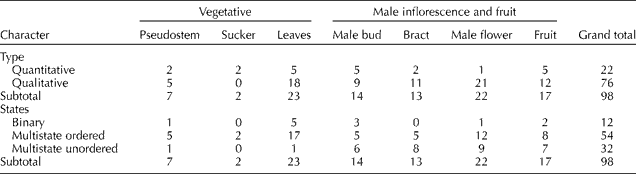
The diversity of Musa kept in the INERA-M genebank was composed of 41 accessions (prior to numerical taxonomic analysis) which expressed, in total, 401 possible phenotypic expressions, hereafter referred to as ‘character cases/states’. The appearance of the leaf upper surface was constant across the diversity, and hence not used in the analysis. So, each accession expressed 98 characters among the 401 character states, thus providing a total of 39,298 feature patterns (data points). The 98 characters (Table 1) were structurally composed of 32 vegetative and 66 male and female inflorescences (Table 1).
The structure of the 98 characters expressed per banana cultivar
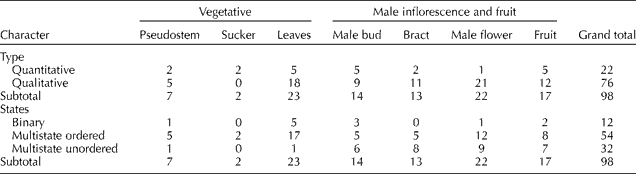
The contributions of qualitative and quantitative characters (Table 1) were of 78 and 22%, respectively, in clustering the diversity. Using the 98 characters, the numerical taxonomy (multivariate methods) effectively clustered the 41 accessions with regard to their genomic groups, subgroups and clone sets supporting subjective classification (Tables 2 and 3). The numerical taxonomy method used in this study related well the 41 accessions from DRC to the 18 known banana accessions from Tanzania maintained in the SUA genebank as revealed by the clustering methods and PCAs.
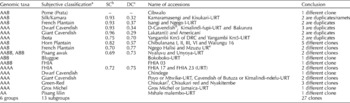
Tie from numerical taxonomy between genomic and subjective classification

a At the subgroup or clone set level.
b Similarity coefficient (Fig. S3).
c Dissimilarity coefficient (Fig. 2).
d Dwarf Cavendish.
e Both of United Republic of Tanzania (URT).
f Also written as ‘Kisukari’ in DRC which is called ‘Mzungu mweupe’ or ‘Buki’ in URT.
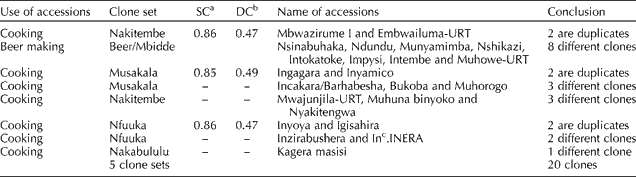
Tie from numerical taxonomy between AAA-EAHB and subjective classification
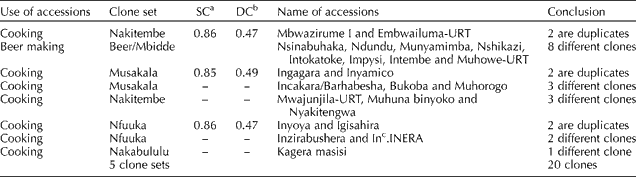
a Similarity coefficient (Fig. S3).
b Dissimilarity coefficient (Fig. 2).
c Inconnu means unknown.
Diversity from the INERA-Mulungu genebank
The 41 accessions were grouped into three main clusters (A, B and C) as shown in the phenograms (Figs 1, S1 and S2, available online only at http://journals.cambridge.org). The first cluster was composed of two subclusters that were exclusively of heterogenomic groups from natural and artificial interspecific crosses between M. acuminata (A genome) and M. balbisiana (B genome). The results showed that the first subcluster (A 1) from ‘Chibulanana I’ to ‘Chibulanana II’ was made of five accessions belonging to the AAB-Horn Plantain clone set on the basis of subjective classification (Table 2). The five accessions were tied with strong similarity coefficients (R s) of 0.83 or dissimilarity coefficients (R d) of 0.63. The insignificant difference observed between the accessions was composed of qualitative characters and hence they were considered as different accessions. The second subcluster (A 2) was composed of AABB-Nyaluvu linked to AABB-FHIA 03 with a high R d of 0.86. Both accessions were found to be linked to AAB-French ‘Isangi’ with a weak correlation coefficient (R s) of 0.37. Based on the difference in character types, the banana accessions were considered to be different.
Phenogram from UPGMA clustering of the correlation coefficient between the 41 banana accessions (Y) (INERA-M) based on the 98 characters (X).

The second cluster (B) was exclusively found to be of triploid homogenomic composition from M. acuminata (A genome) and was subdivided into two subclusters (i.e. B 1 and B 2). The first subcluster (B 1) was composed of twelve accessions, in which the accession ‘Inyoya’ was found to be a duplicate of ‘Igisahira’ with a strong R s of 0.88, with dissimilarity only among the quantitative characters (petiole, leaf and fruit). The 12 accessions were made of eight cooking and four beer types. The subjective classification (Table 3) showed that the first two cooking types were of the Musakala clone set (i.e. Muhorogo and Incakara), followed by three types of the Nakitembe clone set (i.e. Muhuna binyoko, Nyakitengwa and Mbwazirume). The last three accessions ‘InconnuINERA (UnknwonINERA), ‘Inzirabushera’ and ‘Igisahira’ belonged to the Nfuuka clone set. The beer banana types were composed of two accessions (i.e. Nshikazi and Ndundu) belonging to the Nfuuka clone set and the other two belonging to the Nakitembe clone set which were ‘Nsinabuhaka’ and ‘Munyamimba’. Beer bananas of the Nakitembe clone set did pair well (R s= 0.53; Figs 1, S1 and S2, available online only at http://journals.cambridge.org) with their homologues from the cooking types. Six phenetic classifications were in line with subjective classifications of the accessions into the existing genomic groups, subgroups and clone sets (Tables 2 and 3).
The last subcluster (B 2) was composed of 14 accessions in which ‘D-Cavendish’, ‘Americani’ and ‘Ingagara’ were found to be duplicate of ‘Bakurura/Kigurube’, ‘Lakatan’ and ‘Inyamico’, respectively. The subjective classification showed that five accessions (i.e. Chindege, Bakurura/Kigurube, Lakatan, Poyo and Cavendish of Butuza; Table 2) were of the AAA-Cavendish subgroup linked to ‘Chisukari’ and ‘Chisukari red’ that belonged to the AAA-Green-Red subgroup. The Cavendish subgroup was found to be tied to Gros Michel (AAA), five AAA-EAHB and one outline of AAA-Green-Red (Nyakitembe) accessions with a slightly strong correlation coefficient (R s= 0.60) of similarity. The five EAHB accessions were found to be composed of ‘Kagera masisi’ (i.e. Nakabululu clone set) and ‘Inyamico’ (i.e. Musakala clone set) that were linked to three beer types [that were Intokatoke, Impysi and Intembe (i.e. Nfuuka clone set); Table 3]. The second subcluster (B 2; Fig. 1) was weakly (R s= 0.42) linked to the first subcluster (B 1). The third cluster (C) was composed of four accessions tied with moderate correlation coefficients (R s= 0.51). The AAB-Pome accession ‘Cibwalo’ correlated moderately with the similarity (R s) value of 0.59 with the AAB-Silk accession ‘Kamaramasengi’ (also named ‘Namasugampene’) and both tied with ‘Yangambi Km5’ (AAA-Ibota).
Relatedness between Musa spp. from the INERA-M-DRC and SUA-Tanzania genebanks
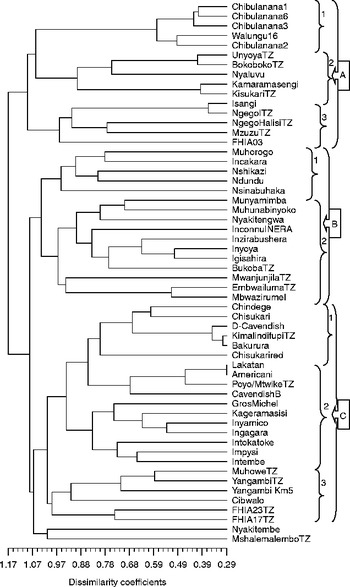
As shown in the phenograms (Figs 2 and S3, available online only at http://journals.cambridge.org) from the similarity and dissimilarity matrices, the 57 accessions were grouped into three main clusters marked as A, B and C, which also supported the subjective classification (Tables 2 and 3). The three main clusters were identified as the ‘A’ cluster from both matrices starting with the accession ‘Chibulanana I’ to ‘FHIA 03’ having three subclusters that were exclusively of heterogenomes from natural and artificial interspecific crosses between M. acuminata (A genome) and M. balbisiana (B genome).
Phenogram from UPGMA clustering of the dissimilarity coefficient between the 57 Musa accessions (41 from INERA-M and 16 from SUA).

The relatedness was observed only within the second and third subclusters. The second subcluster A 2 (Fig. 2) (i.e. from ‘Unyoya’ to ‘Kisukari’) was made of five accessions. There were two accessions, ‘Unyoya’ and ‘Bokoboko’, from Tanzania related to ‘Nyaluvu’ from DRC that were of the ABB and AABB genomic groups, respectively (Table 2). The last two accessions were of AAB-Silk, which also showed that the DRC's accession ‘Kamaramasengi’ was highly similar to the Tanzania's ‘Kisukari’ with a R s of 0.93 (Fig. S3, available online only at http://journals.cambridge.org). While a lesser R d (Fig. 2) of 0.32, between these accession pairs (Kamaramasengi–Kisukari) was observed (Table 2). The similarity between ‘Kamaramasengi’ and ‘Kisukari’ was verified from six phenetic classifications (Figs 2, S3, S4 and S5, available online only at http://journals.cambridge.org), suggesting them as a ramet. On the other hand, the accession ‘Cibwalo’ (AAB) did not cluster with the varieties mentioned above.
The third subcluster A 3 (Figs 2 and S3, available online only at http://journals.cambridge.org) was made of four French Plantain accessions (i.e. Isangi, Ngego I, Ngego Halisi and Mzuzu) and AABB-FHIA 03 from both DRC and Tanzania genebanks (Table 2). The accession ‘Ngego I’, commonly grown in the Southern Highlands of Tanzania, strongly correlated with ‘Isangi’ from DRC with a R s of 0.93 but had a weak R d of 0.37, showing these as a ramet which was verified using six different clustering methods (Figs 2, S3, S4 and S5, available online only at http://journals.cambridge.org).
The second cluster (B) was exclusively of EAHB (i.e. beer and cooking types) and was composed of 16 accessions paired according to the overall relatedness of phenotypic expressions. The important information was that the accession ‘Mbwazirume I’ from DRC paired with ‘Embwailuma’ from Tanzania with a strong R s of 0.87 (Fig. S3, available online only at http://journals.cambridge.org) but with a weak dissimilarity (R d) of 0.47 (Fig. 2), suggesting these as a ramet (Table 3) as also shown in other phenetic classifications (Figs S3–S5, available online only at http://journals.cambridge.org). The differences were in quantitative characters of pseudostem and leaf. The accession ‘Bukoba’ from Tanzania was found to be within the same cluster with the DRC's ‘Igisahira’.
The third cluster (C) was found to be made of dessert and EAHB that was subdivided into three subclusters: C 1, C 2 and C 3. The first subcluster (C 1) (Fig. 2) was composed of 11 accessions. The subjective classification showed that nine accessions named ‘Chindege’, ‘D-Cavendish’, ‘Kimalindi-fupi’, ‘Bakurura’, ‘Lakatan’, ‘Americani’, ‘Poyo’, ‘Mtwike’ and ‘Cavendish B’ belonged to AAA-Cavendish (Table 2). The remaining two accessions (of Green-Red) were mentioned earlier. The accession named ‘Kimalindi-fupi’ (Dwarf Cavendish) from Tanzania was found to be a ramet of ‘Bakurura/Kigurube’ from DRC. The AAA-Cavendish accessions named ‘Mtwike’, ‘Kimalindi-ndefu’ and AAA ‘Jamaica’ from Tanzania were found to be 100% similar to ‘Poyo’, ‘Cavendish B’ and ‘Gros Michel’ from DRC in 2008 and were omitted in some analyses such as ordinations because Eigen vector analysis is based on the variation of character states between the accessions (Sneath and Sokal, Reference Sneath and Sokal1973). The last subcluster (C 3) was a mixture of genomic groups in which the two accessions named AAA-EAHB ‘Muhowe’ and ‘AA-Mshale malembo’ from Tanzania and ‘Nyakitembe’ from DRC (INERA-M) clustered with both ‘Yangambi Km5’ (AAA-Ibota, from DRC and Tanzania). The AAB-Pome/Prata accession ‘Cibwalo’ clumped with FHIA 17 and FHIA 23 (both were of the AAAA genome). The relatedness between the 59 accessions based on the 98 characters using multivariate analysis had ascertained 47 different accessions, and established the remaining as their duplicates (Tables 2 and 3). The leaf upper surface was invariable and deleted by the NT-SYS package (during the standardization process). The high distance coefficient between the ramets was explained by the 22% of the quantitative characters used that were not considered as the element of genetic variability.
The results of the cophenetic (Ultrametric D) matrix presented a cophenetic correlation of 83% (i.e. R u= 0.83, N= 41, P= 0.008) for the 41 accessions characterized from the DRC genebank (Table S2, available online only at http://journals.cambridge.org). The current results showed a good fit (R u>0.8) of the measure of the cluster analysis. A further addition of four accessions from the Tanzania genebank that have been characterized since 2008 had established a cophenetic correlation of 82% (i.e. R u= 0.82, N= 45, P= 0.008) for the accessions characterized from both genebanks (INERA-M and SUA). These results also showed a good fit (R u>0.8) of the measure of the cluster analysis. Furthermore, the addition from the characterization of the 11 banana accessions from Tanzania (SUA Horticulture Unit) in 2010 (from July to November) had lowered the goodness of fit to 77% (R u= 0.77, N= 56, P= 0.008). These were due to the fact that the genebank faced a drought spell. Therefore, the results of clustering analysis have ascertained and pointed out the deviation of character expression due to drought. This has once again established the effectiveness of numerical taxonomy to detect a change in gene expressions in relation to ecological variation. However, the phenetic classifications produced using the single-linkage and complete-linkage methods on the product-moment correlation and distance coefficients established a very poor fit (R u< 0.8) of cophenetic values (Table S2, available online only at http://journals.cambridge.org).
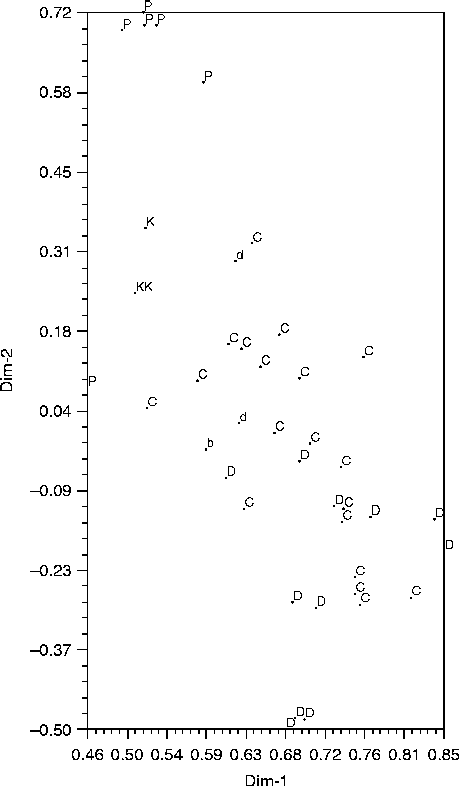
The grouping of the accessions in PCA, shown in Fig. 3, was in line with that in clustering analyses in that the accessions also formed three clusters related to the genomic groups. High loaded character values (>0.5) with a percentage trace of 31.0, 4.75 and 0.13% for principal components (PCs) I, II and III, respectively, were observed (Table S3, available online only at http://journals.cambridge.org). However, the total percentage trace of PCs I, II and III was 43.29, 9.34 and 8.92%, respectively, giving 62%. These results confirm that every succeeding component contained less and less of the total variability and hence ascertain yet again the goodness of fit. As shown in PC axis I (31%) (Table S3, available online only at http://journals.cambridge.org), apart from the peduncle hairiness, bunch and rachis positions that had positive loaded values, the entire remaining characters had negative, high loaded values. All high loaded characters (48) in this component started from leaves and petiole continued to male flower, bract, male bud and fruit that ended with a predominant taste. PC I showed that the heterogenomic bananas (AAB and AABB) clustered on the left side while AAA-EAHB were in the middle and the dessert bananas (AAA) on the right side (Figs 3, S6 and S7, available online only at http://journals.cambridge.org). Hence, these 48 high loaded characters constitute the best in genomic groups’ separation.
PCA showing the relative positions on the first (Dim-1) and second (Dim-2) PCs of the 41 banana accessions of the INERA-M genebank (DR Congo) [6 AAB-Plantains (P), 2 AAB-Kamaramasengi (d), 1 AAA-Ibota (b), 1 AAA-Gros Michel (d), 3 AAA-Green/Red (D), 1 AABB-Pisang Awak (K), 1 AABB-FHIA 03 (KK), 19 AAA-EAHB (C) and 7 AAA-Cavendish (D)].
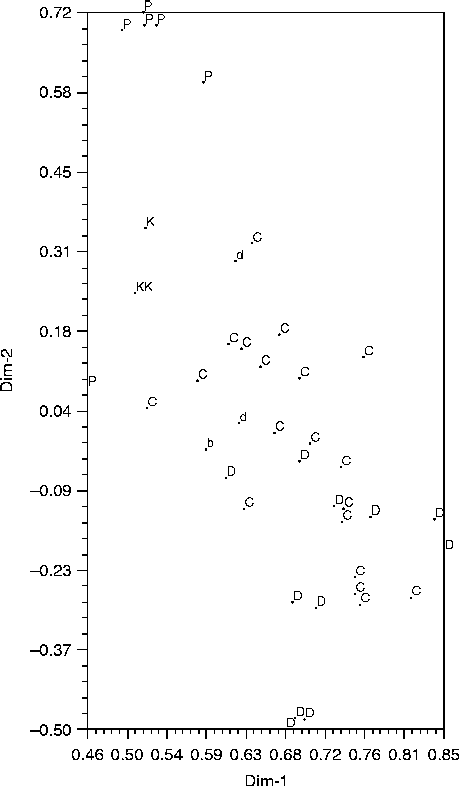
Eleven high loaded (>0.5) characters in PC axis II (Table S3, available online only at http://journals.cambridge.org) were from pseudostem and suckers. These had low loaded values in PC I. A positive, high loaded value was observed on pseudostem height (0.54), blotches at the petiole (0.56) and ovary basic colour (0.50). The negative characters were from other pseudostem and suckers’ characters, leaf blade width ( − 0.54), fruit's pedicel surface ( − 0.61) and fusion of pedicels ( − 0.72). These 11 characters (PC II) showed the separation between AAB-Plantains and AABB, whereas the EAHB sharing many of these characters with dessert bananas were mixed (Figs 3 and S6, available online only at http://journals.cambridge.org). Five characters in PC axis III (Table S3, available online only at http://journals.cambridge.org) with a high loaded value (>0.5) in which a positive, high loaded value was observed for leaf blade length (0.59) but a negative loaded value observed for dwarfism character ( − 0.53). These characters showed low loaded values in PCs I and II. There was a contrast between the petiole length with a negative, high loaded value in PC I but a positive, high loaded value in PC III, and peduncle hairiness with a positive high loaded value in PC I but a negative high loaded value in PC III. The PC III showed the separation between the EAHB and dessert bananas (Fig. S7, available online only at http://journals.cambridge.org).
Therefore, these results show that the PC were independent from each other in the case that all characters with a very low loaded value in PC I were high in the subsequent PC and no character had the same loaded value in the two PCs. These confirmed the validity of clustering analysis done on the banana accessions from DRC (INERA-M) and successfully related these accessions to their homologues from Tanzania (SUA genebank). Furthermore, high loaded character values with exponent ‘a’ (Table S3, available online only at http://journals.cambridge.org) were obtained after the addition of the 11 accessions (under drought in 2010) at SUA in Tanzania. In fact, there was a cut-off below 0.5 of the 11 high loaded characters, and a little addition of four other high loaded (>0.5) characters such as leaf habit, peduncle width (cm), bunch shape and fruit apex. Therefore, 15 characters were severely affected by the effects of drought (climate change). The total percentage trace of PCs I, II and III was 27.46, 8.87 and 7.21%, respectively, that gave a sum of 43.54% (~44%).
Discussion
The current banana genebank kept in INERA-Mulungu contain only 37 accessions in which six are plantain accessions remaining from the 56 cultivars collected by De Langhe (Reference De Langhe1961). This shows the existence of genetic erosion. The observed 78% minimum value of difference between the accessions based on qualitative characters is supported by Sneath and Sokal (Reference Sneath and Sokal1973) who found that the quantitative characters in bananas are influenced by the ecological variation. Even using only six quantitative characters (lengths, width and weight of fruit), Nsabimana (2006) did not succeed in separating the Nfuuka clone set from the Nakitembe clone set in similar ecology (genebank), which shows its weakness in classification. Karamura (1999) has shown that both have similar fruit length and the difference is between persistence flower and bracts on the rachis. Therefore, the use of both quantitative and qualitative characters is a very important method that allows having a good classification. The 39,298 feature patterns (data points) considered as phenetic markers are also supported by the reports of De Langhe et al. (Reference De Langhe, Pillay, Tenkouano and Swennen2005) and Amorim et al. (Reference Amorim, Vilarinhos, Cohen, Amorim, Santos-Serejo, Silva, Pestana, Santos, Paes, Monte and Reis2009), and imply that there are as many phenotypic expressions as there are molecular markers, and hence nullify the concept of the lack of data in phenotypic/phenetic study. The results of the three main clusters A, B and C in phenograms (Figs 1 and 2), which showed different genomic taxa following their genetic resemblance, are in line with the group, subgroup and clone set so far created by De Langhe and Valmayor (Reference De Langhe and Valmayor1980), Tezenas Du Montcel et al. (Reference Tezenas Du Montcel, De Langhe and Swennen1983), Swennen and Vuylsteke (Reference Swennen, Vuylsteke, Persley and De Langhe1987), Swennen (Reference Swennen and Jarret1990) and Karamura (1999). The six accessions of plantains, one belonging to the French clone set and five were of the Horn clone set, show that all the accessions belonging to the False Horn clone set have disappeared. This clarifies the genetic loss in plantain diversity. The accession ‘Isangi’ is found to be a synonym of ‘Isansi’ described by Swennen (Reference Swennen and Jarret1990), while the current ‘Walungu 16’ belonging to the Horn clone set is in contrast with that described by the author (as belonging to French). The separation of AAB-Horn Plantain (in cluster A) from AAB-Silk and Pome (in cluster C; Figs 1 and 2) by numerical taxonomy is in line with the difference in mitochondrial and chloroplast gene pools reported by Boonruangrod (2008). The author has found two M. acuminata-type cytoplasms (III and VIII) in AAB (plantain and Silk) and mixed cytotypes (XII, XIII and XIV) in the ABB genomic groups that constitute the source of genetic variability. The accessions AAB-Pome/Prata ‘Cibwalo’ and AAA-Dwarf Cavendish ‘Bakurura’ were named ‘Prata aña’ and ‘Kigurube’ by Sebasigari (Reference Sebasigari, Persley and De Langhe1987). The DRC's banana accessions clustered well with their homologues from Tanzania. These results ascertained the effectiveness of numerical taxonomy through the mathematical process (i.e. algorithm) to cluster individual banana accessions in the existing Musa genomic groups, subgroups and clone sets regardless of their different agro-ecological conditions. This is supported by Karamura (1999) from two genebanks in Uganda. The Horn accessions ‘Chibulanana one hand (I)’, ‘Chibulanana two hands (II)’ and ‘Chibulanana three hands (III)’ are found to be a synonym of ‘Mkono wa tembo Chana moja’, ‘Mkono wa tembo Chana mbili’ and ‘Mkono wa tembo Chana tatu’ out of the comparison with the characterization by Swennen (Reference Swennen and Jarret1990) and Evers (Reference Evers1992) in Nigeria and Tanzania, respectively. The accessions ‘Mtwike’ and ‘Kimalindi-ndefu’ were highly similar (100%) to ‘Poyo’ and ‘Cavendish B’ and hence omitted in the subsequent analysis. The reason being that it is based on the variation of characters among the accessions (Sneath and Sokal, Reference Sneath and Sokal1973). Both ‘Mtwike’ and ‘Poyo’ are found to be a synonym of ‘Grand(e) Nain(e)’ described by Stover and Simmonds (Reference Stover and Simmonds1991). The accession ‘Gros Michel’ from DRC was found as a duplicate of ‘Jamaica’ in Tanzania. The clustering of the accession ‘Cibwalo’ (i.e. AAB-Prata by Sebasigari, Reference Sebasigari, Persley and De Langhe1987) to the AAAA-FHIA genomic group confirmed the presence of a similarity between their A genome from a breeding programme in Honduras where Prata aña (AAB) was a female plant (Robinson, Reference Robinson1996). The observed cluster of ‘Gros Michel’ with ‘Yangambi Km5’, with the highest distance coefficient (R d) of 1.00 (Fig. 2), is in line with the upshot of Ude et al. (Reference Ude, Pillay, Nwakanma and Tenkouano2002) and Onyango et al. (Reference Onyango, Haymer, Keeley and Manshardt2010) who had reported through molecular characterization (using amplified fragment length polymorphism and simple sequence repeat methods, respectively) that both accessions clustered because of their similar source of some A genome. The current clustering of the AA-Mshale genomic group with the AAA genomic group including the AAA-EAHB subgroups (Figs 2 and S3, available online only at http://journals.cambridge.org) indicates that AA-Mshale malembo may be one of the ancestors of Lujugira-Mutika, which is supported by De Langhe et al. (2001). The accession ‘Mshale’ is similar to Musa acuminata spp. malecensis, which was reported by Ude et al. (Reference Ude, Pillay, Nwakanma and Tenkouano2002) to be one of the ancestors of ‘Yangambi Km5’ and ‘Gros Michel’. However, the exact contribution by AA-‘Mshale malembo’ as one of the ancestors of the Lujugira-Mutika subgroup requires a molecular investigation to confirm the current phylogeny. The clumping of AAA dessert bananas (Cavendish and Gros Michel) with AAA-EAHB is in agreement with Onyango et al. (Reference Onyango, Haymer, Keeley and Manshardt2010) who found similar results from microsatellite analysis but was in contrast with Karamura's (1999) phenetic finding from Ugandan banana collections where these dessert accessions clustered with AAB-Plantain. This contrast may be due to the disparity between the number of characters (73) used by Karamura (1999) and those in this study (98 characters). The percentage trace (62%) being superior to 50% reconfirmed the validity of the cluster analysis between 50 and 95% as described by Wiley (Reference Wiley1981). The observation of the distance between Gros Michel and FHIA 03 in the phenograms (Figs 1 and 2) is explained by somaclonal mutation that changed ‘High gate’ features (to dwarf type) reported by Robinson (Reference Robinson1996). The total percentage trace (44%) after adding the 11 Tanzania accessions (in 2010) being inferior to 50% established the slight fit of the cluster analysis as described by Wiley (Reference Wiley1981). The weak fit explains that the accessions with known character states, once under drought spell, express different character states. PC I (Fig. 3) represented nearly the plant's life cycle and explained up to 43.29% of the observed variation; and did not reach 50% because of the presence of both positive and negative values. This result is supported by the Palmer (2012) report on the validity of PC I. Moreover, the results (Table S3, available online only at http://journals.cambridge.org) show that there were 12 characters not used by Karamura (1999) that had a high loaded value (>0.5) influencing the clustering of AAA-Cavendish to AAA-EAHB. Among these characters were even those which are thought to have high discriminant values described by IPGRI (1996). These were qualitative flowers and fruit pedicel characters that are highly heritable and hence very important in banana breeding. They included the characters reported by De Langhe (Reference De Langhe1961), Tezenas Du Montcel et al. (Reference Tezenas Du Montcel, De Langhe and Swennen1983), Vuylsteke et al. (Reference Vuylsteke, Swennen and De Langhe1991) and De Langhe et al. (Reference De Langhe, Pillay, Tenkouano and Swennen2005) that were used in the subjective classification of the AAB-Plantain subgroup. Numerical taxonomy therefore constitutes the most reliable way for assessing the genetic relationship among diversity using characters covering the crop's life cycle.
Acknowledgements
The authors would like to thank the Canadian International Development Agency (CIDA) (through Bioscience in East and Central Africa Network/NEPAD) for funding this research.