Implications
Predictive equations of duodenal and absorbed flows of saturated fatty acids (FA), and unsaturated FA were derived from a large database in ruminants, including experimental factors (forage nature, nature and dose of lipid supplements). These equations depended on FA intake and interfering factors (conservation mode and botanical families of forages, diet composition and animal characteristics). They are the first step to predict the long-chain fatty acid (LCFA) secreted in the milk or the FA profile in meat. They could be included in the renewed Institut National de la Recherche Agronomique (INRA) feed evaluation systems in ruminants.
Introduction
The FA in milk reflects a combination of ruminant specificities of lipid digestion, as well as mammary lipid metabolism (Chilliard et al., Reference Chilliard, Glasser, Ferlay, Bernard, Rouel and Doreau2007). The rumen biohydrogenation (RBH) of polyunsaturated fatty acid (PUFA) leads to the production of geometric and positional isomers of FA with trans or cis double bonds and saturated FA, mainly C18:0. In the mammary gland, de novo FA synthesis produces C4:0 to C16:0, whereas medium-chain fatty acid (MCFA) (50% of C16:0) and LCFA (FA having a number of carbons >16) from chylomicrons or very-low-density lipoproteins are taken up by lipoprotein lipase (Chilliard et al., Reference Chilliard, Glasser, Ferlay, Bernard, Rouel and Doreau2007). In early lactation, when animals are in negative energy balance, adipose reserves are mobilised and thus some plasma FA are originated from adipose tissue. In parallel with these phenomena, lipid supplementation remains the most effective way to modulate milk FA composition in ruminant.
Due to the extent of RBH, composition of duodenal FA and absorbed FA is very different from the intake. Glasser et al. (Reference Glasser, Schmidely, Sauvant and Doreau2008) and Schmidely et al. (Reference Schmidely, Glasser, Doreau and Sauvant2008) have quantified average regression models for duodenal and absorbed flows of some FA to dietary factors, especially lipid supplementation. They have highlighted the role of additional dietary factors, such as the source of lipids, the physical form (seed v. oil/fat) and the technological processing of lipid supplements on duodenal FA flows. However, the duodenal flows and absorption rates of C18:1, C18:2 and C18:3 isomers have not yet been predicted with accuracy, because of a lack of data and/or an insufficient separation of isomers during chemical analysis. In addition, odd- and branched-chain fatty acid (OBCFA) were not predicted. In the context of the new French INRA feed systems, there is an opportunity to re-evaluate the previous predictive equations of duodenal and absorbed FA flows, including recent studies and characterising the effects of dietary factors on duodenal FA flows with improved precision. Using a meta-analysis approach, the objectives are (1) to quantify duodenal flows and the absorption of different FA including C18:1, C18:2 and C18:3 isomers, OBCFA, MCFA and LCFA; and (2) to quantify more precisely the effects of dietary factors on the relationship between FA intake and duodenal flow.
Material and methods
Selection of publications
The AGRum database (IDDN.FR.001.510032.000.R.C.2011. 000.10300) has been previously described (Glasser et al., Reference Glasser, Schmidely, Sauvant and Doreau2008; Schmidely et al., Reference Schmidely, Glasser, Doreau and Sauvant2008). Its update was performed with trials published between 2008 and 2014. The PRISMA diagram (Moher et al., Reference Moher, Liberati, Tetzlaff and Altman2009) described the selection process of the peer-reviewed papers considered in this study (Supplementary Figure S1). Publications were taken from the Web of Knowledge and Science Direct research platforms, using the keywords: ruminant, cow, ewe, goat, sheep, biohydrogenation, duodenal FA and digestion. Data with ruminal or post-ruminal infusion of nutrients were excluded.
The database was then composed of 104 publications (Supplementary Material S1) reporting 167 experiments (N exp) with a total of 437 treatments (N trt). The animal species are divided between bovine (N trt=358) and ovine (N trt=79). Dairy cows are the most studied animals among bovines (N trt=202) followed by beef cattle (N trt=156). The feedstuffs from the database were characterised according to the INRA (2010) feed tables based on their reported chemical composition on a dry matter (DM) basis for CP, NDF, starch, total FA and FA profile (Baumont et al., Reference Baumont, Dulphy, Sauvant, Tran, Meschy, Aufrère, Peyraud and Champciaux2007; Maxin et al., Reference Maxin, Glasser, Doreau and Baumont2013).
Coding
Codes were assigned to each study according to the experimental factors studied and then four database subsets were created: forage, seed, vegetable oils or animal fats (oil/fat) and fish products (fish) subsets. In the forage subset, botanical families and their conservation mode (fresh or pasture, silage and hay) were coded as experimental factors, with all diets based only on one or several forages called forage diets (Supplementary Table S1). In the seed and oil/fat subsets, the lipid source and their technological processing were coded as experimental factors, with two codes designated to each treatment according to lipid source and technological process. The fish subset was created for studies including fish products (oil and meal), with the lipid percentage in the diet (no lipid supplement v. fish products) and the lipid source (fish oil or fish meal v. vegetable oil or animal fat) as experimental factors. In these three subsets, control diets referred to treatments without lipid supplement. The code for lipid source referred to the nature of the main lipid supplement divided as follows: vegetable source, animal fats (including fish products), hydrogenated fat and animal–vegetable blends. The code for technological processes referred to either dry, hydrothermal and mechanical processes, and formaldehyde treatment for seeds, and amide, Ca salts, encapsulated, and formaldehyde treatments for vegetable oils and animal fats, and amide and Ca salts for fish products, respectively (Supplementary Table S1).
Variable selection criteria
A preliminary selection of individual duodenal FA was made to have more than 50 treatments before relating each selected duodenal FA flow (dependent variable) with its respective FA intake (independent variable). Duodenal OBCFA (Fievez et al., Reference Fievez, Colman, Castro-Montoya, Stefanov and Vlaeminck2012) flows that arise mainly from microbial synthesis in the rumen and isomers of C18:1, C18:2 and C18:3 flows were regressed against dietary data (e.g. concentrate, dietary starch and CP contents) or digestive parameters which may reflect or affect ruminal microbial activities, for example, rumen protein balance (RPB), CP microbial synthesis, efficiency of microbial protein synthesis (EMPS), organic matter truly digested in the rumen (OMDr), using the INRA model of feed and diet nutritive values (Sauvant and Nozière, Reference Sauvant and Nozière2013) implemented within the Sytool.fr. application (Chapoutot et al., Reference Chapoutot, Martin, Nozière and Sauvant2015) and ruminal pH and acetate/propionate (A/P) ratio measured in publications. Absorbed flow was calculated as the difference between duodenal flow and faecal flow or as the difference between ileal flow and faecal flow. Absorbed flows of saturated FA (C14:0, C16:0 and C18:0), total C18:1, C18:2 and C18:3, the main isomers (c9-C18:1, t11-C18:1, c9c12-C18:2 and c9c12c15-C18:3) and LCFA as C20:5n-3 (EPA), C22:5n-3 (docosapentanoic acid (DPA)) and C22:6n-3 (DHA) were predicted from their respective duodenal flows. Different qualitative animal criteria (species and animal physiological stage), quantitative dietary factors (intake level [(dry matter intake (DMI)×100)/BW], concentrate percentage, diet chemical composition) and digestive parameters (predicted from Systool.fr) were selected because of their putative effect on the predictive equations.
Statistical analyses
Description of the meta-design
A description of each subset is presented in Supplementary Tables S2 to S5, respectively. The treatments from the forage subset were presented according to conservation mode (Supplementary Table S2) or botanical families (Supplementary Table S3), whereas those from the seed and oil/fat subsets were described according to the control (Supplementary Table S4) or lipid supplemented diets (Supplementary Table S5). For the fish subset, we separated treatments into three groups: diets supplemented with fish products, other lipid supplements such as vegetable oils or animal fat and control diets without lipid supplement.
Regression models of duodenal fatty acids and absorbed fatty acids
Predictive models for duodenal FA were obtained for each subset using a variance–covariance analysis with a GLM. In the models developed for intra-experiment variations, we considered ‘study effect’ as a fixed effect (Sauvant et al., Reference Sauvant, Schmidely, Daudin and St-Pierre2008). The true intra-experiment response of a dependent variable (Y) to variation in an independent variable (X) was calculated on experiments with a sufficient variation in X: a minimum threshold of variation at intake level (X max−X min) was selected with the hypothesis that RBH of PUFA was 90% in order that the minimal variation range (Y max−Y min) at duodenal level could be detectable by laboratory analysis. This threshold eliminated 30% to 50% of treatments according to the FA considered, that were further used for external validation (see the ‘Model assessments’ section). However, this criterion was not applied to regressions using several independent variables to estimate duodenal FA, nor to predict absorbed FA flows from the duodenal flows. The models in equations (1) and (2) were used to describe the relationships between duodenal FA (FAduo, g/kg DMI) and FA intake (FAint, g/kg DMI) and those between absorbed FA (FAabs, g/kg DMI) and FAduo. For absorbed FA models, the analysis included all experiments from the database without taking into account the separation into different subsets:
 $${\rm FA}_{{{\rm duo},ij}} {\equals}\beta _{{\rm 0}} {\plus}S_{i} {\plus}{\rm }\left( {\beta _{1} {\plus}\beta _{i} } \right) \cdot {\rm FA}_{{{\rm int},ij}} {\plus}{\varepsilon}_{{ij}} $$
 $${\rm FA}_{{{\rm abs},ij}} {\equals}\beta _{{\rm 0}} {\plus}S_{i} {\plus}\left( {\beta _{1} {\plus}\beta _{i} } \right) \cdot {\rm FA}_{{{\rm duo},ij}} {\plus}{\varepsilon}_{{ij}} $$
where i=experiment index and j=treatment index. β 0 is the overall intercept, S i the fixed effect of experiment i, β 1 the overall regression slope, β i the fixed effect of experiment i on the slope and ε ij the unexplained residual error.
Identification of potential additional factors
We studied the influence of different factors on three regression parameters: the least square means (LSmeans) of Y response, slope and residuals of the above equations. First, a t-test was used to compare LSmeans and slope coefficients of the predictive equations between the seed and oil/fat subsets. If the coefficients were not significantly different between the two sets, data were pooled to retain a single regression for both subsets. Second, effects of quantitative (experiment means) and qualitative variables were analysed differently. A Pearson correlation test was applied to determine if the quantitative variables could have an effect on both the slope coefficients and LSmeans. The effect of qualitative variables on slope coefficients and LSmeans was assessed with a one-way ANOVA. To test the influence of qualitative and quantitative factors on previously calculated residuals
 $\left( {y{\minus}\hat{y}} \right)$
, a one-way ANOVA was conducted for qualitative factors, and a linear global regression model (equation (3)) was used for quantitative factors. For the forage subset, in addition of the previous approach, a global linear regression was performed including two variables, mode of conservation and forage families, and their interactions with the FA intake for duodenal FA flows prediction (equation (4)). To study the pure effect of forage families, treatments consisting of a blend of legumes and grasses were not taken into account. The following model was used:
 $$\left( {y{\minus}\hat{y}} \right)_{{{\rm duo},j}} {\equals}\beta _{{0{\rm }}} {\plus}\beta _{{1{\rm }}} \cdot {\rm factor}_{j} {\plus}{\varepsilon}_{j} $$
 $$\scale 97% { {\rm FA}_{{{\rm duo},j}} {\equals}\beta _{0} {\plus}\left( {\beta _{1} {\plus}{\rm FAM}_{j} {\plus}{\rm CM}_{j} } \right) \cdot {\rm FA}_{{{\rm int},j}} {\plus}{\rm FAM}_{j} {\plus}{\rm CM}_{j} {\plus}{\varepsilon}_{j} $$
where FAM and CM are forage families (Gramineae and Leguminosae) and conservation mode (fresh or pasture, silage and hay), respectively. β 0 is the overall intercept, β 1 the regression coefficient and ε ij the random residual error. All statistical analyses were performed with the software Minitab® (version 17; State College, PA, USA). We considered P<0.05 to be statistically significant and P<0.10 to represent a trend.
Model assessments
To evaluate the models, the coefficients of linear regressions between observed and predicted values were tested using a F-test in which the intercept was compared with 0 and the slope was compared with unity. Furthermore, we selected experiments not included in the model (e.g. experiments with a range less than the defined threshold). Then, we calculated a linear regression between observed and predicted values for these experiments, which allowed for the determination of the mean square prediction error (MSPE) from equation (5) (Bibby and Toutenburg, Reference Bibby and Toutenburg1977). Three parameters of MSPE (equations (6) to (8)) were studied: (1) the error in central tendency (ECT) that represents the amount the predictive model does not fit; (2) error due to regression (ER) explaining the proportion of slope deviation and (3) error due to disturbance (ED) representing the optimal linear correction of the prediction model:
 $${\rm MSPE}{\equals}\left( {{{\sum_{n{\equals}1}^i \left( {\overline{{\left[ {\hat{y}_{i} } \right]}} {\minus}\overline{{\left[ {y_{i} } \right]}} } \right)^{2} } \over n}} \right){\rm }$$
 $${\rm ECT}{\equals}\left( {\overline{{\left[ {\hat{y}_{i} } \right]}} {\minus}\overline{{\left[ {y_{i} } \right]}} } \right)^{2} $$
 $${\rm ER}{\equals}\left( {S_{{\hat{y}}} {\minus}r{\minus}{\rm }S_{y} } \right)^{2} $$
 $${\rm ED}{\equals}\left( {1{\minus}{\rm }r^{2} } \right){\times}{\rm }S_{y}^{2} $$
where ŷ was the predicted duodenal FA flow, y the observed duodenal FA flow and n the number of observations.
 $S_{{\hat{y}}} $
and S
y
were the standard deviation of the predicted and observed values, respectively. The r refers to the correlation coefficient.
Results
Models from the forage subset
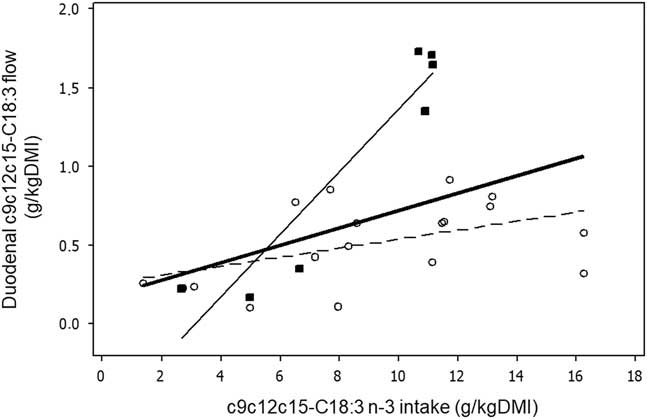
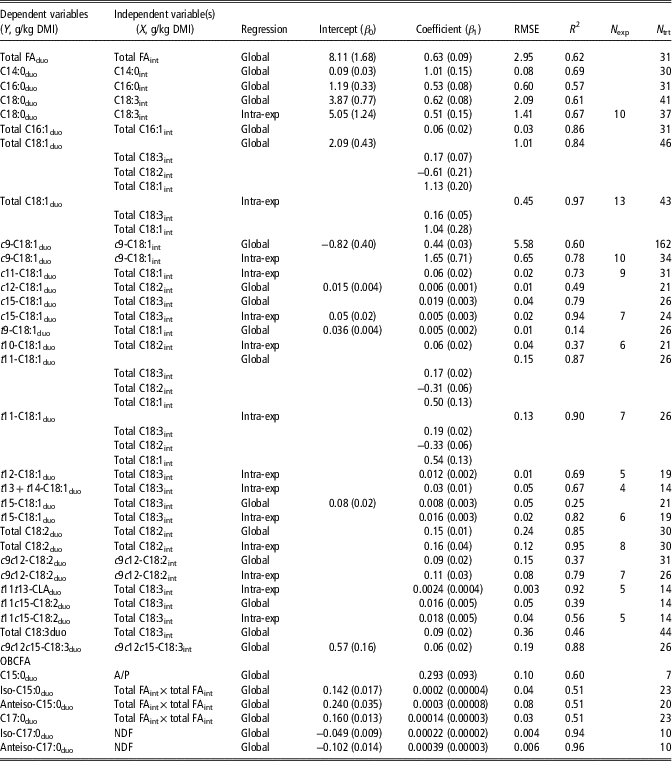
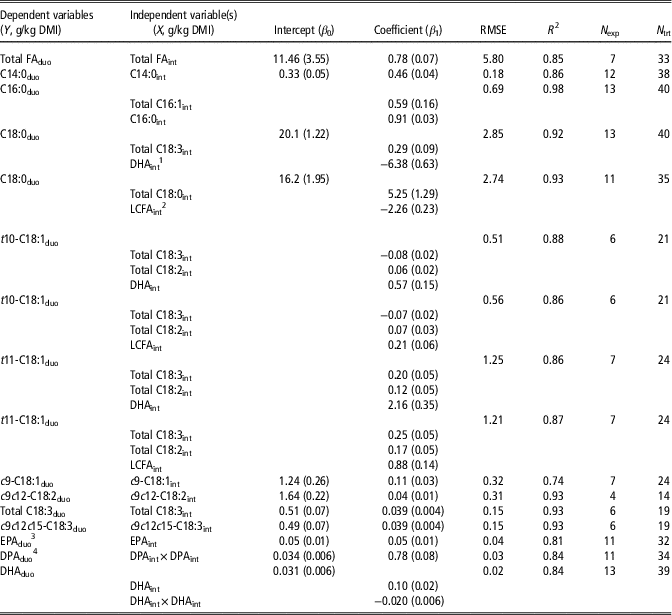
This section deals with duodenal flows of total FA, C18:0, total C18:1, C18:2, C18:3 and related isomers. The global model of duodenal total FA flow (Table 1) depended on the total FA intake. Duodenal C18:0 flow was dependent on C18:3 intake in the global and intra-experimental tests, without effects of total C18:2, total C18:1 and C18:0 intakes. The duodenal total C18:1 flow was positively dependent on total C18:1 and C18:3 intakes and negatively dependent on total C18:2 intake. Furthermore, the duodenal total C18:1 flow was dependent on intra-variation in total C18:1 and total C18:3 intakes. The global and intra-experiment models of duodenal total C18:2 and c9c12-C18:2 flows depended on the intake of their respective FA. The conservation mode and forage families did not affect the models of duodenal total C18:1, total C18:2 and c9c12-C18:2 flows (data not shown). The duodenal total C18:3 flow was positively related to total C18:3 intake. The global model of duodenal c9c12c15-C18:3 flow included an effect of c9c12c15-C18:3 intake (Table 1). Forage families affected the model of duodenal c9c12c15-C18:3 flow, with a significantly higher slope for Leguminosae (0.20±0.03) than for Gramineae (0.03±0.01) (Figure 1).
Relationships between the ruminant duodenal flow of c9c12c15-C18:3 and c9c12c15-C18:3 intake from the forage subset, where (■) are the Leguminosae data and (○) Gramineae data. The bold full line (--), the thin full line (––) and the thin dashed line (---) show the global regression (Y=0.06±0.02·X+0.17±0.22, number of treatments (N trt)=25, root mean square error (RMSE)=0.45, R 2=0.18), the regressions for Leguminosae (Y=0.20±0.03·X−0.63±0.28, N trt=7, RMSE=0.27, R 2=0.87) and for Gramineae data (Y=0.03±0.01·X+0.26±0.13, N trt=18, RMSE=0.24, R²=0.18), respectively. DMI=dry matter intake.

Predictions of duodenal flows of total fatty acids (FA), selected saturated FA, total C16:1, C18:1, C18:2 and C18:3, cis and trans isomers of C18:1, C18:2 and C18:3, and odd- and branched-chain fatty acid (OBCFA) from forage diets in ovine and bovine species

DMI=dry matter intake; RMSE=root mean square error; N exp=number of experiments; N trt=number of treatments; duo=duodenal flows; int=intake; Intra-exp=intra-experiment; A/P=acetate/propionate ratio.
Data were represented by the mean (standard error).
The global and intra-experiment models of c15-, t12-, t13+14- and t15-C18:1 presented a significant effect of total C18:3 intake. For c15- and t15-C18:1, the intra-experiment model was a better fit than the global model (Table 1). The intra-experiment model for duodenal c11-C18:1 flow and the global model of duodenal t9-C18:1 flow was related to total C18:1 intake. The duodenal c12- and t10-C18:1 flows were positively correlated with total C18:2 intake in global and intra-experiments, respectively. The global and intra-experiment models of duodenal t11-C18:1 flow presented a positive effect of total C18:3 and C18:1 intakes, and a negative effect of total C18:2 intake. Among the C18:2 isomers, the global and intra-experiment models of duodenal t11t13-CLA and t11c15-C18:2 flows were dependent on total C18:3 intake.
Models from the seed and oil/fat subsets
Duodenal flows of total fatty acids, C18:0, total C18:1, C18:2 and C18:3 and relative isomers
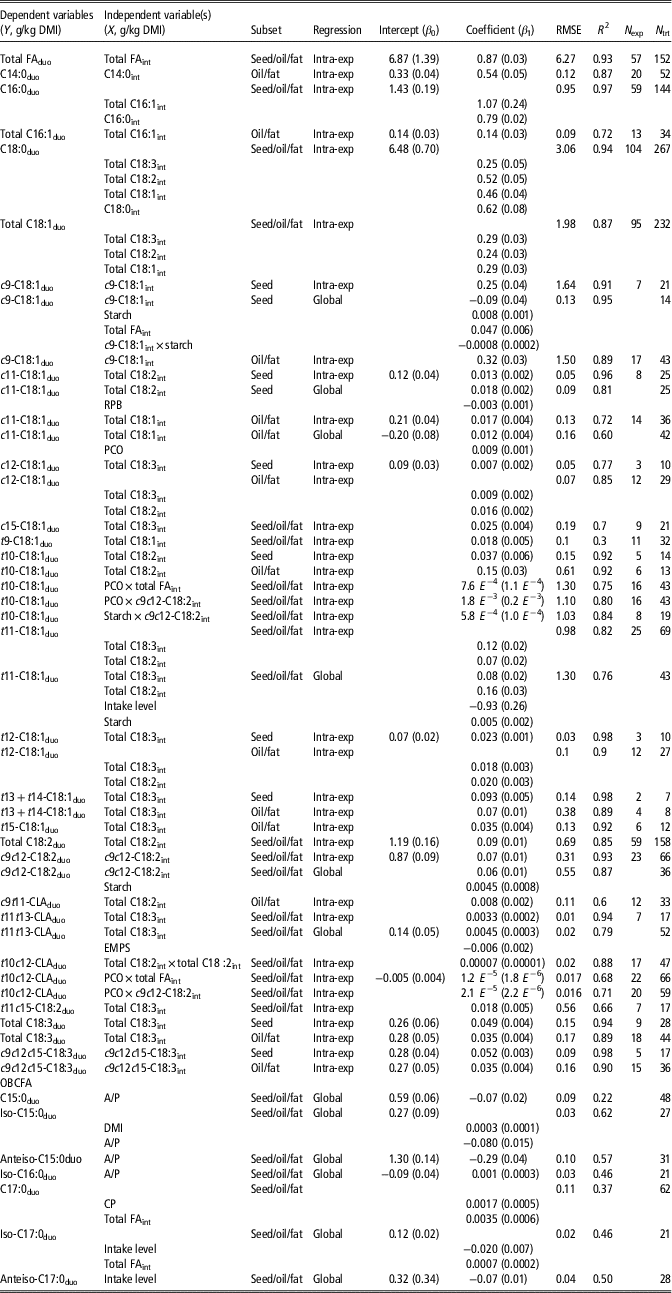
Duodenal total FA flow was significantly related to total FA intake (Table 2), with no difference between the subsets, suggesting that the physical form of lipid supplement had no influence (seed v. oil). For the model of duodenal C18:0 flow, the total C18:3, C18:2, and C18:1, and C18:0 intakes had significant effects. For duodenal total C18:1 flow, there was a positive intra-experiment effect of total C18:3, C18:2 and C18:1 intakes (Table 2). For total C18:1 model, we obtained a single equation for the seed and oil/fat subset. In contrast, the model of duodenal c9-C18:1 flow depended on c9-C18:1 intake and the physical form affected duodenal flows with a lower slope for the seed than for the oil/fat subsets (0.25±0.04 v. 0.32±0.03, respectively, Table 2). The intra-experiment model of duodenal c11-C18:1 and t9-C18:1 flows was related to total C18:1 intake. The global model of duodenal c11-C18:1 flow presented a significant effect of total C18:1 intake and concentrate percentage for oil/fat subset. The duodenal c12-, c15-, t12-, t13+t14-, t15-C18:1 flows were positively correlated with total C18:3 intake in intra-experiments. The intra-experiment model of duodenal t10-C18:1 flow presented a significant effect of the interaction between FA intake and concentrate percentage, but interaction between c9c12-C182 intake and either concentrate percentage or starch content of the diet produced lower root mean square error (RMSE). In these two models including c9c12-C18:2 intake, residual analysis indicated on average −0.20 and −0.25 g duodenal t10-C18:1/kg DMI for the lipids fed as seeds, respectively. The duodenal t11-C18:1 flow indicated a significant effect of both total C18:2 and C18:3 intakes. The duodenal total C18:2 and c9c12-C18:2 flows were positively related to their respective FA intakes.
Predictions of duodenal flows of total fatty acids (FA), selected saturated FA, total C16:1, C18:1, C18:2 and C18:3, cis and trans isomers of C18:1, C18:2 and C18:3, and odd- and branched-chain FA (OBCFA) from diets supplemented with seeds, vegetable oils or animal fats in ovine and bovine species

DMI= dry matter intake; RMSE=root mean square error; N exp=number of experiments; N trt=number of treatments; duo=duodenal flows; int=intake; Intra-exp=intra-experiment; RPB=rumen protein balance; PCO=percentage of concentrate; EMPS=efficiency of microbial protein synthesis; A/P=acetate/propionate ratio.
Data were represented by the mean (standard error).
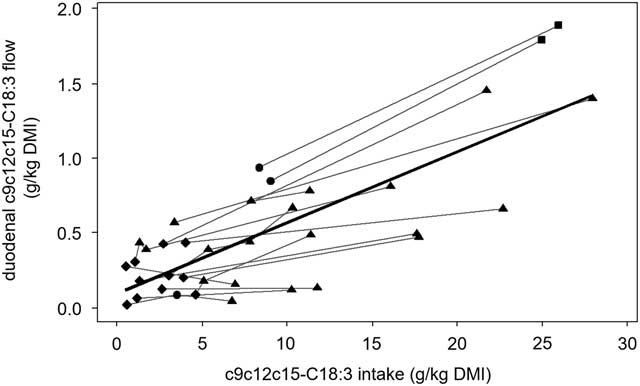
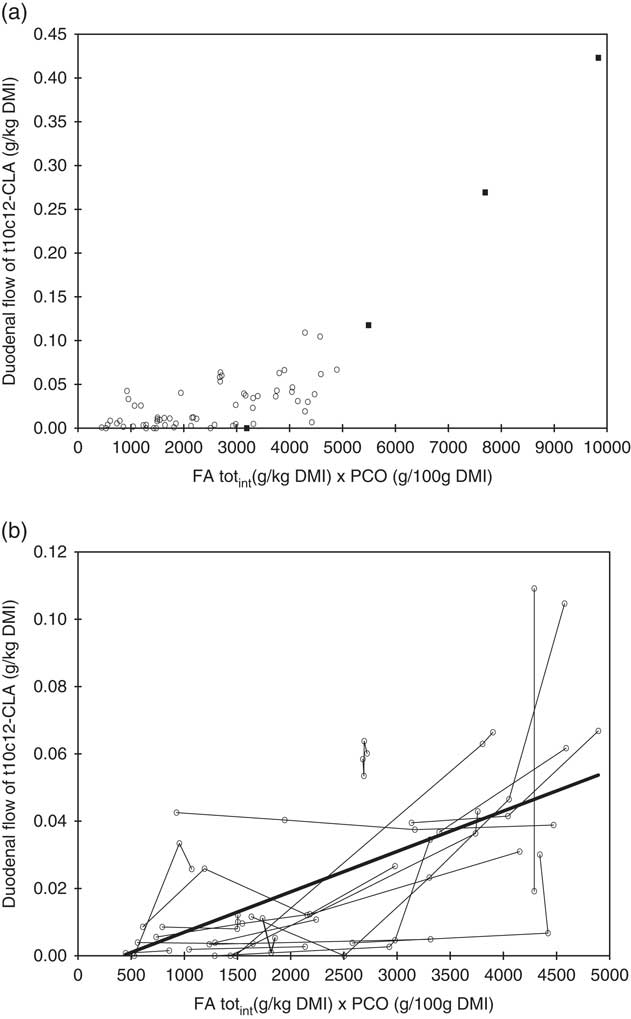
The duodenal total C18:3 and c9c12c15-C18:3 flows depended on their respective FA intake, with slopes of 0.049±0.004 (seed) and 0.035±0.05 (oil/fat) for total C18:3 and 0.052±0.003 (seed) and 0.035±0.004 (oil/fat) for c9c12c15-C18:3, respectively. Concerning the models of duodenal total C18:3 and c9c12c15-C18:3 flows from oil/fat subset, formaldehyde treatment presented an effect on regression residuals. For the c9c12c15-C18:3 intake, the formaldehyde treatment yielded high residuals (0.59 g/kg DMI), but this was only due to two treatments (Figure 2), the Ca salts having no effect. The technological process had no effect on regression residuals for the model of c9c12-C18:2. Duodenal c9t11-CLA flow from the oil/fat subset depended on the total C18:2 intake (slope=0.008±0.002, Table 2). We did not obtain a model from the seed subset, perhaps due to insufficient data. There was a significant effect of C18:3 intake on duodenal t11t13-CLA flow, with no effect of the physical form (seed v. oil/fat) on the slope. For duodenal t10c12-CLA flow (Table 2 and Figure 3), data of Kucuk et al. (2004) obtained with a combination of 3.2% to 9.4% soyabean oil in high-concentrate diet (80% DM) are clearly higher than all others values in the literature. Without these data, the model for duodenal t10c12-CLA flow included the interaction between FA intake and concentrate percentage. A better prediction may be obtained with the interaction of c9c12-C18:2 and concentrate percentage, but with a smaller number of treatments. In both cases, intercept was not significant, but the inclusion of the interaction in the models reduced the RMSE. Duodenal t11c15-C18:2 flow depended on total C18:3 intake, with no effect of the physical form. In addition, none of the selected potential factors had a significant effect on the regression residuals (data not shown).
Intra-experimental relationships between the ruminant duodenal flow of c9c12c15-C18:3 and c9c12c15-C18:3 intake from the oil/fat subset, where (♦) are the control treatments without vegetable oils or animal fats, (▲) free lipids, (∙) calcium salts and (■) formaldehyde-protected lipids. DMI=dry matter intake.

(a) Global relationship between ruminant duodenal flows of t10c12-CLA from the seed/oil/fat subset and the product between total dietary fatty acid intake (total FAint, g/kg dry matter intake (DMI)) and percentage of concentrate (PCO, g/100 g DMI). Data of Kucuk et al. (2004) are indicated as black squares. (b) Within-experiment relationship between ruminant duodenal flows of t10c12-CLA from the seed/oil/fat subset and the product between total FAint (g/kg DMI) and PCO (g/100 g DMI), with the exclusion of data from Kucuk et al. (2004) (Y=−0.005+1.2E −5 X, number of treatments =66, root mean square error=0.017, R 2=0.68).

Odd- and branched-chain fatty acids
The duodenal C15:0 flow was correlated with DMI, A/P ratio, OMDr, and EMPS and ruminal pH (Supplementary Table S6). Among these variables, A/P ratio had significant effect on the duodenal C15:0 flow (Table 2). The duodenal iso-C15:0 and anteiso-C15:0 flows were negatively related on A/P (Supplementary Table S6). The duodenal iso-C16:0 flow was dependent negatively on NDF content and positively on CP content (Supplementary Table S6). The duodenal C17:0 flow was positively affected by starch content and concentrate percentage, and negatively with DMI, NDF content, A/P ratio and ruminal pH (Supplementary Table S6). For duodenal iso-C17:0 and anteiso-C17:0 flows, intake level had a negative effect on both FA, whereas FA intake had a positive effect on duodenal iso-C17:0 flow (Table 2).
Potential factors affecting duodenal flows of isomers of C18:1, C18:2 and C18:3 from the seed and oil/fat subsets
The duodenal c9-C18:1 flow from seed subset was positively correlated with starch content, concentrate percentage and total FA intake, and negatively correlated with intake level, A/P ratio and ruminal pH (Supplementary Table S7), c9-C18:1 intake and starch content×c9-C18:1 intake interaction (Table 2). For duodenal c9c12-C18:2 flow from the seed/oil/fat subset, we observed in the global relationship an effect of starch when associated with c9c12-C18:2 intake. We obtained global and intra-experiment regressions with close intercepts and slopes between the two models. The duodenal c9c12c15-C18:3 flow from the seed subset was not affected by any factor other than c9c12c15-C18:3 intake. For the oil/fat subset, none of the correlated factors presented an effect on the duodenal c9c12c15-C18:3 flow when associated with c9c12c15-C18:3 intake (Table 2). The concentrate percentage was correlated with the duodenal flows of c11-, t9-, and t15-C18:1, t10c12-CLA, t11c15-C18:2 and c9c12-C18:2 (Supplementary Table S7). The duodenal c11-C18:1 flow was a function of total C18:1 intake and concentrate percentage from the oil/fat subset (Table 2). The intake level was correlated with the duodenal flows of c9-, c11- (seed subset), t11-, and t13+t14-C18:1 and t10c12-CLA (seed/oil/fat subset) and positively correlated with t13/t14-18:1 (oil/fat subset) (Supplementary Table S7). The duodenal t11-C18:1 flow from the seed/oil/fat subset was positively dependent on total C18:3 and C18:2 intakes and dietary starch but negatively on intake level (Table 2 and Supplementary Table S7). Furthermore, duodenal t10c12-CLA flow from the seed/oil/fat subset was affected negatively by concentrate percentage and total FA intake interaction (Table 2). The RPB had a negative effect on duodenal c11-C18:1 flow from the seed subset, whereas the total C18:2 intake had a positive effect (Table 2 and Supplementary Table S7). Only the duodenal t11t13-CLA flow was a function of EMPS when associated with total C18:3 intake (Table 2).
Models from the fish subset
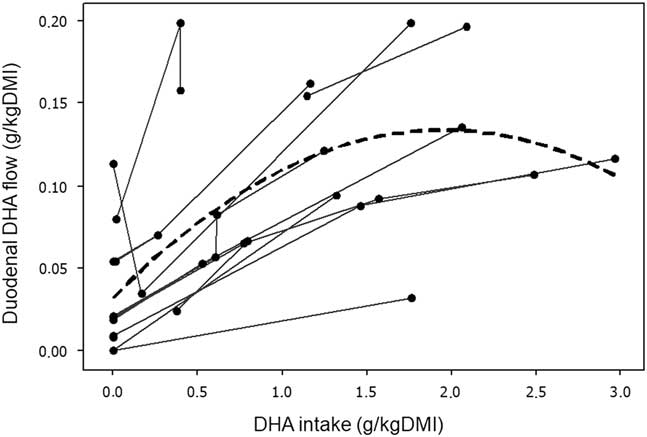
This section deals with duodenal flows of total FA, C18:0, cis and trans C18:1 isomers, EPA, DPA and DHA. The duodenal total FA flow was predicted, taking into account total FA intake (Table 3). Duodenal C18:0 flow was positively related to total C18:3 intake and negatively to DHA intake. Duodenal t11-C18:1 flow was positively dependent on total C18:3 and C18:2, and DHA intakes. Duodenal t10-C18:1 flow was negatively correlated to total C18:3 intake and positively to C18:2 and DHA intakes. The duodenal DPA flow had a quadratic relationship with DPA intake and the model for duodenal DHA flow (Figure 4) presented a linear effect of DHA intake and also a quadratic effect of DHA intake×DHA intake, with significant slopes (0.10±0.02 and −0.020± 0.006, respectively).
Intra-experimental relationships between ruminant duodenal DHA flows and DHA intakes. The bold dashed line shows the quadratic fitted model (Y=0.031±0.006+0.10±0.02·X−0.020±0.006X 2, number of treatments=39, root mean square error=0.02, R 2=0.84).

Predictions of duodenal flows of total fatty acids (FA) and selected saturated, monounsaturated and polyunsaturated FA from diets supplemented with fish products in ovine and bovine species

DMI=dry matter intake; RMSE=root mean square error; N exp=number of experiments; N trt=number of treatments; duo=duodenal flows; int=intake; LCFA=long-chain fatty acid; DPA=docosapentanoic acid.
Data were represented by the mean (standard error).
1 DHA (C22:6n-3).
2 LCFA=sum of EPA+DPA+DHA.
3 EPA (C20:5n-3).
4 DPA (C22:5n-3).
Absorbed fatty acid prediction
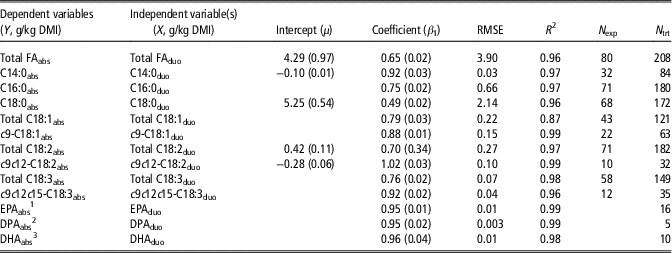
Absorbed total FA and C18:0 flows were linearly related to their respective duodenal flows (Table 4). Similarly, the absorbed flows of total C18:1, c9-C18:1, total C18:2, c9c12-C18:2 and LCFA (EPA+DPA+DHA) depended on their corresponding duodenal FA flow. The model of absorbed c9c12-C18:2 flow had a slope value higher than that of absorbed total C18:2 flow (1.02 v. 0.70, respectively), as well as a lower RMSE (0.10 v. 0.27 g/kg DMI, respectively). For the models of absorbed total C18:3 and c9c12c15-C18:3 flows, duodenal total C18:3 and c9c12c15-C18:3 flows had a significant effect, respectively.
Predictions of absorbed fatty acid (FA) flows from duodenal flows of total FA, selected saturated FA, total and isomers of C18:1, C18:2 and C18:3, and long-chain FA in ovine and bovine species

DMI=dry matter intake; RMSE=root mean square error; N exp=number of experiments; N trt=number of treatments; abs=absorbed flows; duo=duodenal flows; DPA=docosapentanoic acid.
Data were represented by the mean (standard error).
1 EPA (C20:5n-3).
2 DPA (C22:5n-3).
3 DHA (C22:6n-3).
Evaluated models
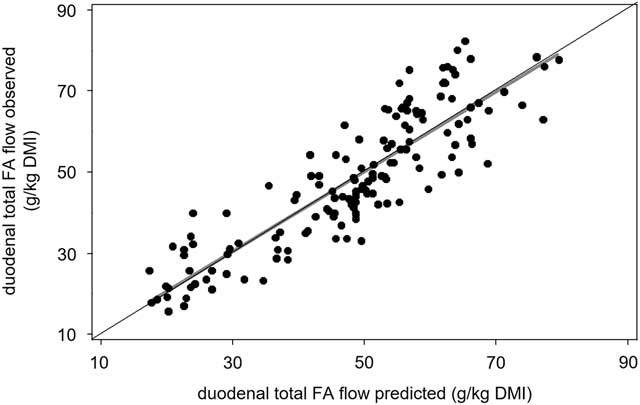
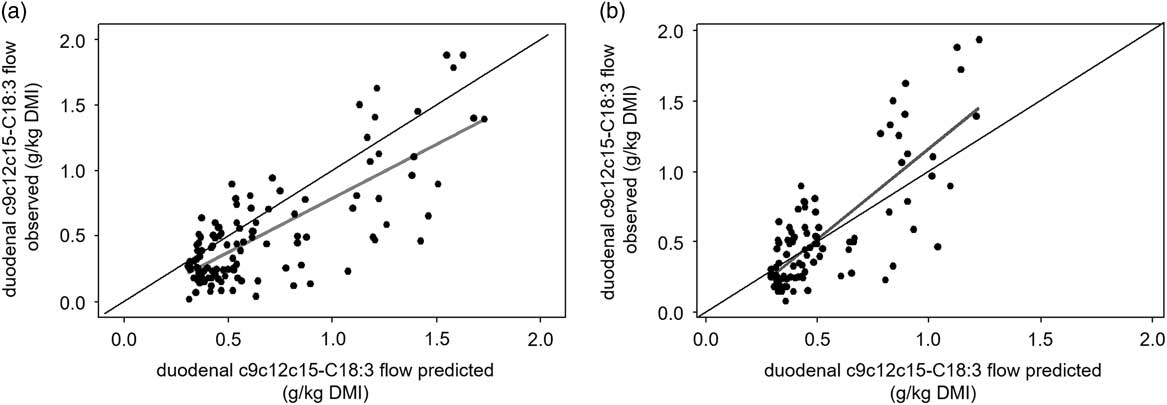
The evaluation procedures were only applied to models from the seed and oil/fat subsets because of the amount of available data. We obtained 15 evaluated models from the 32 performed models from the seed and oil/fat subsets (Supplementary Table S8). In all, 10 of the 15 models (c9- and t13+t14-C18:1, total C18:3, c9c12c15-C18:3 from the seed subset; c9- and t13+t14-C18:1 from the oil/fat subset; and total FA, total C18:2, c9c12-C18:2 and t9-C18:1 from the seed/oil/fat subset) presented regression coefficients close to the expected value of 1. For the c15-C18:1 and t10c12-CLA models (from the seed/oil/fat subset), the regression coefficient was <1, and for total C18:3 and c9c12c15-C18:3 (from the oil/fat subset) and t11t13-CLA (from the seed/oil/fat subset) the regression coefficients were higher than 1. The regression between observed duodenal flows of total FA and c9c12c15-C18:3 and predicted duodenal flows of these FA from the performed models are described in the Figures 5 and 6, respectively.
Relationship between observed ruminant duodenal total fatty acid (FA) flows and predicted duodenal total FA flows from the seed/oil/fat subset (Y=0.99±0.04·X, number of treatments=147, root mean square error=7.96, R 2=0.77). DMI=dry matter intake.

(a) Relationship between observed and predicted ruminant duodenal flows of c9c12c15-C18:3 from the seed subset (Y=0.82·X, number of treatments (N trt)=114, root mean square error (RMSE)=0.27, R 2=0.57). (b) Relationship between observed and predicted duodenal flows of c9c12c15-C18:3 from the oil/fat subset (g/kg of dry matter intake (DMI)) (Y=1.29·X, N trt=94, RMSE=0.26, R 2=0.60).

Concerning the MSPE parameters, errors due to disturbance accounted for the majority of the errors in 12 models (c9- and t13+t14-C18:1, and total C18:3 from the seed subset; c9- and t13+t14-C18:1, total C18:3, c9c12c15-C18:3 and from the oil/fat subset; and total FA, t9-C18:1, total C18:2, c9c12-C18:2 and t10c12-CLA from the seed/oil/fat subset). In the models of duodenal flows of c15-C18:1 and t11t13-CLA from seed/oil/fat subset, the majority of the MSPE was allocated to errors due to regression. When the errors due to disturbance accounted for the majority of MSPE, we observed that regression between predicted and observed data presented a good fit with the Y=X model.
Discussion
The separation of the database into different subsets was essential to highlight the FA digestion according to the nature of lipid supplements or forages. For the seed, oil/fat and fish subsets, the intra-experiment relationships were close to the global ones, indicating that the prediction of these flows was probably not biased. For the forage subset, these relationships were sometimes different, probably because the conservation mode and forage families, were confounded with c9c12c15-C18:3 and c9c12-C18:2 intakes, respectively. Previous meta-analysis (Glasser et al., Reference Glasser, Schmidely, Sauvant and Doreau2008; Schmidely et al., Reference Schmidely, Glasser, Doreau and Sauvant2008) were compared with the present models for total FA, total C18:2, total C18:3 and c9c12-C18:2. Overall, the independent variables are the same between the previous models and those proposed in this study, with the exception of c9c12c15-C18:3 which was not calculated by Glasser et al. (Reference Glasser, Schmidely, Sauvant and Doreau2008). In addition, despite currently having more data, the regression coefficients of the previous and current models are very similar.
Forage subset
Overall slope of the relationship between duodenal flow of total FA and total FA intake was apparently low (0.63) but this is mainly due to the significant intercept of that relationship (8.11 g FA/kg DMI), suggesting that microbial synthesis may contribute largely to the duodenal flow of total FA. It can, however, not be ruled out that methodological considerations during lipid extraction may affect that relationship (Christie and Han, Reference Christie and Han2010). The RBH of c9c12c15-C18:3 was on average 94%, similar to the mean of 92.7% observed by Doreau et al. (Reference Doreau, Lee, Ueda and Scollan2005), with forage families and conservation mode confounded. Moreover, the different slopes of the duodenal c9c12c15-C18:3 flow models between forage families may be explained by the presence of red clover silage in the diets offered to cattle, a Leguminosae rich in polyphenol oxidase with a likely inhibitory effect on RBH (Van Ranst et al., Reference Van Ranst, MRF and Fievez2011). However, this difference in RBH between Leguminosae and Gramineae could be rather attributed to a modification of the bacteria activity with a decrease in microbial protein synthesis when grass silage was replaced by red clover silage (Halmemies-Beauchet-Filleau et al., Reference Halmemies-Beauchet-Filleau, Vanhatalo, Toivonen, Heikkilä, Lee and Shingfield2013). No effect of the conservation mode on the c9c12c15-C18:3 RBH was found in our study, in disagreement with Doreau et al. (Reference Doreau, Lee, Ueda and Scollan2005), where the RBH of c9c12c15-C18:3 was more extensive (+6.4%) for fresh grass than hay. The lack of conservation mode effect in our subset could be explained by the fact that low and high intakes of c9c12c15-C18:3 were associated to hay and fresh grass, respectively (Supplementary Table S2).
Seed and oil/fat subsets
For seed and oil/fat subsets, the regression coefficients of total duodenal C18:3 and duodenal c9c12c15-C18:3 on their respective intake were not different. Glasser et al. (Reference Glasser, Schmidely, Sauvant and Doreau2008) found a slope of 0.05±0.01 for duodenal total C18:3, representing 95% of RBH. The c9c12c15-C18:3 model from the seed subset presented a RBH lower than the oil/fat model with 94.8% and 96.5%, respectively, but this difference is relatively low. This slightly limited RBH is probably due to seed hulls delaying the c9c12c15-C18:3 release for the microbes. The models of C18:2 isomers (c9t11-CLA, t11t13-CLA, t10c12-CLA and t11c15-C18:2) were independent of the physical form of lipid supplements (seed v. oil/fat), and therefore, this factor does not seem to affect the first RBH step. The t11c15-C18:2 and t11t13-CLA were produced during the c9c12c15-C18:3 RBH (Shingfield et al., Reference Shingfield, Bernard, Leroux and Chilliard2010a; Ferlay et al., Reference Ferlay, Bernard, Meynadier and Malpuech-Brugère2017). Moreover, the duodenal t11c15-C18:2 flow is greater than that of t11t13-CLA, which could be explained by the fact that t11c15-C18:2 comes from a major pathway of linolenic acid RBH, whereas t11t13-CLA comes from a minor pathway (Shingfield et al., Reference Shingfield, Bernard, Leroux and Chilliard2010a).
The models for the different C18:1 isomers as a function of total C18:2 and total C18:3 intakes, had slopes <0.1, with the exception of c9-, t11- and t10-C18:1, indicating that these three FA are major isomers of C18:1 at the duodenum (Table 2). Indeed, t11-C18:1 is the main C18:1 isomer, originating both from c9c12-C18:2 and c9c12c15-C18:3 RBH (Harfoot and Hazlewood, Reference Harfoot and Hazlewood1997). Furthermore, c9-C18:1 could be isomerised to t11-C18:1. However, we did not find any effect of c9-C18:1 intake on duodenal t11-C18:1 flow, suggesting that this isomerisation rate is low and/or rapid (Laverroux et al., Reference Laverroux, Glasser, Gillet, Joly and Doreau2011). For the t10-C18:1 model, the duodenal flow was higher with oil/fat than with the seed form. This could be linked to the rate of oil release from raw seed, which is possibly more gradual than directly from the oil (Chilliard et al., Reference Chilliard, Martin, Rouel and Doreau2009). The low slope of the models is valuable for the two subsets forage and seed/oil/fat, suggesting similarities of formation of isomers of C18:1 during the RBH pathway whatever the dietary ingredient (forage or oleaginous).
Our models indicated that the main variable driving the duodenal flows of t10-C18:1 and t10c12-CLA is the combination of total FA intake (or c9c12-C18:2 intake) and percentage of concentrate. More specifically, we quantified the specific effect of starch intake which seems to be a major determinant of the duodenal flows of these FA when associated with c9c12-C18:2 intake. This interaction reflects the changes in microbial population within the rumen associated when high starch with high unsaturated lipid diets are fed, leading to the preferential development of bacterial species such as Propionibacterium acnes (Devillard et al., Reference Devillard, McIntosh, Newbold and Wallace2006) and/or Megasphaera elsdenii (Kim et al., Reference Kim, Liu, Rychlik and Russell2002) that are known to synthesise t10c12-CLA from c9c12-C18:2. Although different in vitro studies have shown an appearance of t10-C18:1 from c9c12c15-C18:3 (Ferlay et al., Reference Ferlay, Bernard, Meynadier and Malpuech-Brugère2017), we found no effect of c9c12c15-C18:3 intake on duodenal t10-C18:1 flow in our meta-analysis.
We proposed predictive equations for the duodenal OBCFA flows, with a positive effect of starch intake on duodenal C17:0 flow, a positive effect of NDF content on duodenal C15:0 flow, a negative effect of concentrate percentage on duodenal iso-C16:0 flow and a negative effect of A/P on duodenal iso-C15:0 and anteiso-C15:0 flows (Table 3). These effects could be related to bacterial metabolism as increasing starch content in the diet favours amylolytic bacterial activity, whereas the NDF content increases that of cellulolytic bacteria (Vlaeminck et al., Reference Vlaeminck, Fievez, Cabrita, Fonseca and Dewhurst2006). Vlaeminck et al. (Reference Vlaeminck, Gervais, Rahman, Gadeyne, Gorniak, Doreau and Fievez2015) demonstrated positive relationships between amylolytic bacteria and anteiso-, linear and odd-chain FA and between cellulolytic bacteria and iso-FA. In addition, Belanche et al. (Reference Belanche, Doreau, Edwards, Moorby, Pinloche and Newbold2012) demonstrated a positive effect of high dietary NDF on duodenal OBCFA flows. We found a positive effect of RPB on duodenal flows of C15:0 and iso-C16:0, in agreement with Vlaeminck et al. (Reference Vlaeminck, Gervais, Rahman, Gadeyne, Gorniak, Doreau and Fievez2015). An increasing intake level is associated with a decrease in OMDr and thus a decrease in availability of nutrients to bacteria, thereby explaining the negative effects of intake level on duodenal iso- and anteiso-C17:0 flows.
Fish subset
The DPA had a lower RBH than EPA and DHA (67%, 95% and 94%, respectively), in agreement with Kairenius et al. (Reference Kairenius, Toivonen and Shingfield2011). These latter authors suggest that RBH of EPA or DHA involves the initial removal of the double bond between carbon atoms 4 and 5, whereas DPA does not have a double bond in this position, explaining a lower RBH of DPA compared with EPA and DHA. Nevertheless, in a recent in vitro study, Aldai et al. (Reference Aldai, Delmonte, Alves, Bessa and Kramer2018) indicate that firstly the cis-13 double bond of DHA migrates to the adjacent position 14 reversing its geometry from cis to trans, forming the trans-14,cis-16 system.
Other models showed inhibitory or positive effects of DHA on the different steps of C18 RBH. The DHA intake as well as the LCFA intake had a negative effect on the duodenal C18:0 flow and a positive effect on duodenal t10- and t11-C18:1 flows, in agreement with Lourenco et al. (Reference Lourenço, Ramos-Morales and Wallace2010) and Shingfield et al. (Reference Shingfield, Lee, Humphries, Scollan, Toivonen, Reynolds and Beever2010b), that reported that EPA and DHA inhibited both the last step of RBH and the bacteria growth, increasing the trans FA and CLA content in the rumen. This effect was not found in our study with EPA or DPA intake, although they were correlated with DHA intake.
In conclusion, this meta-analysis proposes predictive equations for different FA that have not been predicted previously: isomers derived from RBH that affect animal lipid metabolism, notably the milk fat depression; OBCFA, which are specific bacterial FA used for diagnostic of rumen function, and EPA, DPA and DHA from fish products. These predictive equations add to the body of quantitative knowledge on FA digestion. However, the effects of different dietary factors (e.g. lipid source, conservation mode of forage and forage families) have not been demonstrated in our models due to low amounts of available data. In the current context, understanding and controlling the ruminal digestion of FA, and the effects of different qualitative and quantitative diet variations, is essential to improve the quality of ruminant products (meat and milk).
Acknowledgements
The authors are grateful to C. Gérard and B. Delord that funded this meta-analysis study through Neovia and Limagrain brands, respectively, which are greatly acknowledged for their financial support to Lucas de Ofeu Aguiar Prado CIFRE scholarship. In addition, the authors would like to thank Patrick Chapoutot from INRA-UMR0791 Mosar team for granting us permission to work on the Systool model and its help on feedstuff characterisation.
Declaration of interest
No conflict of interest to declare.
Ethics statement
Not relevant.
Software and data repository resources
The AGRum database has been deposited at Inter Deposit Digital Number (https://www.iddn.org/) under the reference (IDDN.FR.001.510032.000.R.C.2011.000.10300).
Supplementary Material
To view supplementary material for this article, please visit https://doi.org/10.1017/S1751731118001982